
International Journal of Otorhinolaryngology
Download PDF
Research Article
*Address for Correspondence: Yussy Afriani Dewi, MD, Department of Otorhinolaryngology Head and Neck Surgery, Faculty of Medicine Padjadjaran University/Hasan Sadikin General Hospital, Pasirkaliki No. 90 Bandung West Java, 40161, Indonesia, Tel: +628112272773; E-mail: yussyad@yahoo.com
Citation: Dewi YA, Shahib MN. Increased Circulating Myeloid-Derived Suppressor Cells and S100A8 Correlate with Clinical Stage in Nasopharyngeal Carcinoma Inter J Otorhinolaryngology. 2015;2(2): 8.
Copyright © 2015 Dewi et al. This is an open access article distributed under the Creative Commons Attribution License, which permits unrestricted use, distribution, and reproduction in any medium, provided the original work is properly cited.
International Journal of Otorhinolaryngology| ISSN: 2380-0569 | Volume: 2, Issue: 2
Submission: 05 October 2015 | Accepted: 25 November 2015 | Published: 28 November 2015
 The qRT-PCR reaction was subjected to reverse transcription (RT) for five minutes at 42 ºC, followed by enzyme inactivation at 95 ºC for 3 minutes, and the cycle of PCR for 40 cycles at 95 ºC for three second (denature), 60 ºC (20 seconds) for annealing, and 72 ºC for 20 seconds (extension data acquisition). The experiments were carried out in duplicate for each data point.
 By Mann Whitney U test analysis for the gene expression level between early and advanced stage in nasopharyngeal carcinoma blood, all genes (MDSC p=0.000 and S100A8 p=0.000) with statistically significant difference in expression (p< 0.05). The results of this analysis were different for tissue, all genes (MDSC p=0.090 and S100A8 p=0.747) with no statistically significant difference in expression for gene expression level between early and advanced stage in nasopharyngeal carcinoma tissue.
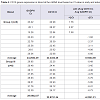
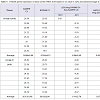
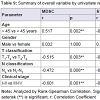
 The expressions of MDSC and S100A8 were positively correlated with T classification (p=0.003 and p=0.022) and age (p=0.002 and p=0.041). The MDSC expression also correlated with N classification (p=0.006), and clinical stage (p=0.001). Contrary for S100A8 expression were not correlated with N classification (p=0.258) and clinical stage (p=0.254) (Table 9). The result indicated that he high expression of MDSC was correlated with clinical stage of nasopharyngeal carcinoma especially in blood.
Increased Circulating Myeloid- Derived Suppressor Cells and S100A8 Correlate with Clinical Stage in Nasopharyngeal Carcinoma
Yussy Afriani Dewi1* and M. Nurhalim Shahib2
- 1Department of Otorhinolaryngology Head and Neck Surgery, Faculty of Medicine Padjadjaran University/Hasan Sadikin General Hospital, Indonesia
- 2Department of Biochemistry and Molecular Biology, Faculty of Medicine Padjadjaran University/Hasan Sadikin General Hospital, Indonesia
*Address for Correspondence: Yussy Afriani Dewi, MD, Department of Otorhinolaryngology Head and Neck Surgery, Faculty of Medicine Padjadjaran University/Hasan Sadikin General Hospital, Pasirkaliki No. 90 Bandung West Java, 40161, Indonesia, Tel: +628112272773; E-mail: yussyad@yahoo.com
Citation: Dewi YA, Shahib MN. Increased Circulating Myeloid-Derived Suppressor Cells and S100A8 Correlate with Clinical Stage in Nasopharyngeal Carcinoma Inter J Otorhinolaryngology. 2015;2(2): 8.
Copyright © 2015 Dewi et al. This is an open access article distributed under the Creative Commons Attribution License, which permits unrestricted use, distribution, and reproduction in any medium, provided the original work is properly cited.
International Journal of Otorhinolaryngology| ISSN: 2380-0569 | Volume: 2, Issue: 2
Submission: 05 October 2015 | Accepted: 25 November 2015 | Published: 28 November 2015
Abstract
Nasopharyngeal carcinoma (NPC) is a squamous epithelial cancer arising from the lateral wall surface of nasopharynx, shows a clear regional and racial prevalence. Developments of tumors are influenced by many factors, generally an interaction between genetic, environmental, and immune system. There is a role of myeloid derived suppressor cells in the process of immune suppression. The presence of MDSC has been described in the peripheral blood and tumors of patients with various forms of cancers. MDSC are able to strongly promote tumor progression by inhibiting anti-tumor immune responses by multiple mechanisms. S100A8 proteins are elevated in inflammation and cancer and are chemotactic; they may contribute to the recruitment and retention of MDSC. MDSC not only have receptors for S100A8/A9, but also synthesize and secrete these proteins, providing an autocrine pathway for MDSC accumulation. The aim of this study is to analyze the expression of MDSC (through CD14 and CD15 genes) and S100A8 gene in relation to clinical stage in nasopharyngeal carcinoma. Peripheral blood specimen and biopsy from primary tumor were collected from 16 nasopharyngeal carcinoma patients. The samples collected undergone RNA isolation and qRT-PCR examination. The Data were analyzed by 2-ΔΔCt method and statistical analysis. MDSC and S100A8 genes were expressed in blood higher than in tumor tissue. MDSC and S100A8 expression in nasopharyngeal carcinoma blood were significantly high correlated to clinical stage (r=-0.879, p=0.000 for MDSC; r=-0.791, p=0.0000 for S100A8). The MDSC expression also correlated with age (p=0.002), T classification (p=0.003), N classification (p=0.006), and clinical stage (p=0.001). The S100A8 expression correlated with age (p=0.041) and T classification (p=0.022). The result indicated that the high expression of MDSC was correlated with clinical stage of nasopharyngeal carcinoma especially in blood.Keywords
MDSC; S100A8; Clinical stage of NPCIntroduction
Nasopharyngeal carcinoma (NPC) is a squamous epithelial cancer arising from the lateral wall surface of nasopharynx, shows a clear regional and racial prevalence [1]. The differences in geographic and ethnic distribution reflect the multifactorial etiology of NPC, including the Epstein Barr virus (EBV) infection, ethnics, genetic susceptibility, environmental factors, and food consumption [1].NPC is a frequent cancer in Indonesia, rating as the fourth most common tumor after cervical cancer, breast cancer, and skin cancer, and is the most common malignancy in the head and neck [1,2]. In Indonesia, which has an ethnically diverse population of 225 million people, NPC is prevalent among different native people and presents a major socioeconomic problem, with an overall incidence estimated at 6.2/1,00,000 or about 12,000 new cases per year [2].
Developments of tumors are influenced by many factors, generally an interaction between genetic, environmental, and immune system. There is a role of myeloid derived suppressor cells in the process of immune suppression.
Myeloid-derived suppressor cells (MDSC) are heterogeneous population of cells comprising immature myeloid progenitors for neutrophils, monocytes, and DC [3-11]. MDSC are potently immunosuppressive, markers that typical for PMN-MDSC is CD15 in blood circulation, while for MO-MDSC is CD14 [4-6]. The presence of MDSC has been described in the peripheral blood and tumors of patients with various forms of cancers [4,6,7,11-16]. MDSC are able to strongly promote tumor progression by inhibiting anti-tumor immune responses by multiple mechanisms [9].
S100A8 is the member of S100 family of calcium binding proteins that are inflammatory mediators released by cells of myeloid origin. These intracellular molecules are released to extracellular compartments in response to cell damage, infection, or inflammation, and function as proinflammatory danger signals [8,17]. Increased of S100A8 expressions are seen in tumor-infiltrating cells in many epithelial tumors like nasopharyngeal carcinoma. The proteins function predominantly as S100A8 heterodimers and are chemotactic for leukocytes, thereby amplifying the local proinflammatory microenvironment, mediate their effects by binding to plasma membrane receptors on their target cells. These receptors include heparan sulfate, TLR4, and carboxylated N-glycans. Carboxylated N-glycans is constitutively expressed on endothelial cells, macrophages, and dendritic cells and is recognized by the mAbGB3 [17]. S100A8 proteins are elevated in inflammation and cancer and are chemotactic; contribute to the recruitment and retention of MDSC [8,17]. MDSC not only have receptors for S100A8, but also synthesize and secrete these proteins, providing an autocrine pathway for MDSC accumulation [17]. S100A8 inflammatory proteins have been reported not only to attract MDSC into tumor site and enhance their immunosuppressive activity but also promote the activation of MAPK and NFκB signaling pathways in tumor cells, stimulating thereby the tumor growth and metastasis [17].
Here, we examined if circulating levels of MDSC correlated with clinical stage of nasopharyngeal carcinoma. Furthermore, we also determined if increased level of circulating MDSC were associated with S100A8. A population of MDSC defined as CD14 and CD15 were readily detected in fresh whole blood and tissue from nasopharyngeal carcinoma patients.
Materials and Methods
Clinical samplesThe peripheral blood specimen and tissue of 16 nasopharyngeal carcinoma samples were collected from oncology head and neck clinic, Department of Otorhinolaryngology, Hasan Sadikin General Hospital Bandung Indonesia with total numbers of samples were 32 (mean age 49.12; median 53; range 16-69; standard deviation ± 14.98) with newly diagnosed and histopathology result are undifferentiated carcinoma of nasopharynx (100%). The numbers of male were 11 (68.8%) and women 5 (31.3%). Early stage were stages I/II (n=8) and advanced stage were III/IV (n=8) in accordance with American Joint Committee on Cancer (AJCC) Cancer Staging Manual, 7th edition 2010. Samples were divided into four groups; group I were blood samples from early stage NPC patients; group II were tissue samples from early stage; group III were blood samples from advanced stage; and group IV were tissue from advanced stages NPC patients. All samples were collected after establishment of NPC diagnosis but before starting treatment. Informed consents were obtained from all participants from whom these samples were obtained. The samples were quickly collected three ml for blood in EDTA tubes and tissue were collected and transferred into sterile tubes containing RNA later solution (Ambion, USA) was stored until RNA extraction. The Research Ethics Board of the Faculty of Medicine, Padjadjaran University Bandung Indonesia, approved this study.
According to TNM classification with AJCC Cancer Staging Manual in nasopharyngeal carcinoma are for primary tumor (T); T1 (Tumor confined to the nasopharynx; T2 (tumor extends to soft tissue), T2a (tumor extends to the oropharynx and/or nasal cavity without parapharyngeal extension, T2b (any tumor with parapharyngeal extension); T3 (tumor involves bony structures and or/paranasal sinuses); T4 (tumor with intracranial extension and/ or involvement of cranial nerves, infratemporal fossa, hypopharynx, orbit, or masticator space). For regional lymph node (N); N0 (no regional lymph node metastasis); N1 (unilateral metastasis in lymph node, 6 cm or less in greatest dimension, above the supraclavicular fossa; N2 (bilateral metastasis in lymph node, 6 cm or less in greatest dimension, above the supraclavicular fossa; N3 (metastasis in a lymph node >6 cm and/or to supraclavicular fossa, N3a (greater than 6 cm in dimension), N3b (extension to the supraclavicular fossa). For distant metastasis (M); M0 (no distant metastasis); M1 (distant metastasis) [18].
Total RNA isolation
Total RNA was isolated with the Trizol reagent (Invitrogen, USA) according to the manufacturer’s instructions. RNA pellets were recovered and purified by phenol-chloroform extraction and ethanol precipitation and underwent conventional RT-PCR (Promega, USA).
Quantitative real time polymerase chain reaction (qRTPCR)
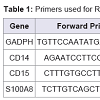
Validation of the expression patterns of the following genes CD14, CD15, and S100A8 was performed using qRT-PCR (the Universal one-step qRT-PCR kit according to the manufacturer’s instructions; Kapa Biosystems, USA). The invariant housekeeping gene control, human glyceraldehyde-3-phosphate dehydrogenase (GADPH) was amplified. The primers consisted of forward and reverse for human GADPH, CD14, CD15, and S100A8 were described at Table 1 .
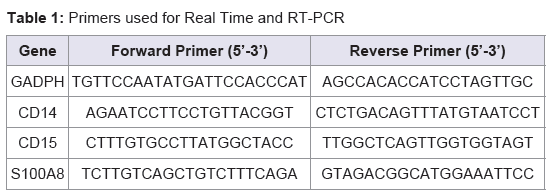
Table 1: Primers used for Real Time and RT-PCR.
The result can be seen in the form of threshold cycle (Ct curves), by applying the relative changes in targeting genes expressing [19-21]. Ct (Cycle of threshold) is reported as the PCR cycle number that crosses an arbitrary placed signal threshold [19,22]. The average Ct was calculated for both targets gene and internal control (GADPH) and the Δ Ct were equal to the difference in the threshold cycles for target and GADPH (Ct target-Ct GADPH).
Data analysis
qRT-PCR was analyzed by calculating the fold difference individually for each gene. Ct is defined as the number of PCR cycles at which the fluorescence signal rises above the threshold value and is inversely propositional to the amount of template present in the reaction. The relative quantification was given by the Ct values and determined for the reactions for each target gene and the internal control genes (GADPH) in blood samples. ΔCt [ΔCt=Ct (target gene) - Ct (GADPH gene)] values were collected for each sample, relative expression level was determined as 2^-ΔΔCt, ΔΔCt = (Ct.target-CtGADPH) time x – (Ct.target-CtGADPH)time 0 [20,22]. Using this method, we obtained the fold changes in gene expression normalized to an internal control gene.
Time x is any time point and time 0 represents the 1x expression of the target gene normalized to GADPH. The mean Ct values for both the target and control genes were determined at time zero and was used in Equation 1. The mean and SD are then determined from the samples a teach time point [20,21]. We categorized the Ct values varying from 15 to 40; 15-20 was very high expression; >20-25 was high expression; >25-30 was moderate expressions; >30-35 was low expression; and >35-40 was very low or no expression. We also adopted the possibilities of genes expression under 15 of Ct value were over expression [19,20]. All these categories were confirmed with gel electrophoretic data.
Statistical analysis
Statistical data were converted to the linear form by the ΔCt calculations. Pearson analysis was used to evaluate the normal data distribution, and alternative Spearman analysis was used if the data were not normally distributed. Spearman was used to analyze the correlation between ordinal and numeric data and correlation between nominal and numeric data by Eta analysis. A p-value < 0.05 as considered significant and statistical test were performed using the software SPSS version 21 (SPSS Inc., Chicago, Illinois).
Results
Freshly drawn whole blood and tissue from nasopharyngeal carcinoma patients was therefore labeled with CD14 and CD15 for myeloid marker and S100A8 gene expression and GADPH by analysis them RNA transcripts. MDSC then defined as average value of CD14 and CD15, thus we don’t describe them separately after analyzed by statistic using Rank Spearman analysis, only MDSC (r=0.856;=0.0001). MDSC expression was significantly high correlated with S100A8 expression in clinical samples of NPC (r=-0.762; p=0.001) with Spearman analysis. Those RNA transcripts were determined by Real-Time PCR, which identified 32 genes expressions. The mean Ct values for four group I, II, III, and IV were determined and the amount of the transcripts = 2-ΔΔCt.For AJCC clinical stage I, there was one patient. While for stage II, there were seven patients, stages III were two patients, and stages IV were six patients. For N classification, there were two patients for NO, eight patients for N1, two patients for N2, and four patients for N3. For T classifications T1 there were two patients, while for T2 classifications were eight patients, one patient for T3 and five patients for T4 classification.
The order of two targeting genes was placed from lower to highest base on their Ct values compared to GADPH. The ΔCt value that was lower than GADPH was placed in a group of negative ΔCt (-ΔCt). – ΔCt suggested a higher expression than GADPH. Calculation of data was adapted from Livak and Schimttgen and Shahib et al. ΔΔCt = ΔCt (target gene) –ΔCt (GADPH). The mean Ct values for both peripheral blood and tissue from early and advanced stage of nasopharyngeal carcinoma were determined and the amount of the transcripts=2-ΔΔCt.
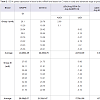
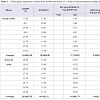
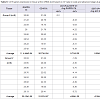
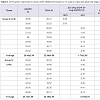
Quantitative Real-time PCR, which identified three genes expressions CD14, CD15, and S100A8, determined the mRNA expression in NPC patients from early and advanced stage NPC patients and the data was expressed in Ct values. There were marked the increased of gene expressions of CD14, CD15, and S100A8. Especially gene expression in advanced stage NPC blood, up to 53.45 (CD14); 39.16 (CD15), and 123.64 (S100A8) (Tables 2-4). Adversely in tumor tissue, gene expressions in advanced stage were not as high as in the blood, up to 7.92 (CD14), 1.27 (CD15), and 4.51 (S100A8) (Tables 5-7). These results suggest that CD14, CD15, and S100A8 genes were expressed in peripheral blood and primary nasopharyngeal carcinoma. Additional experiments showed that nasopharyngeal carcinoma tissue expressing CD14, CD15, and S100A8 genes especially in the peripheral blood containing high level of mRNA, suggesting these genes are more widely expressed in peripheral blood NPC than tissue in advanced stage.
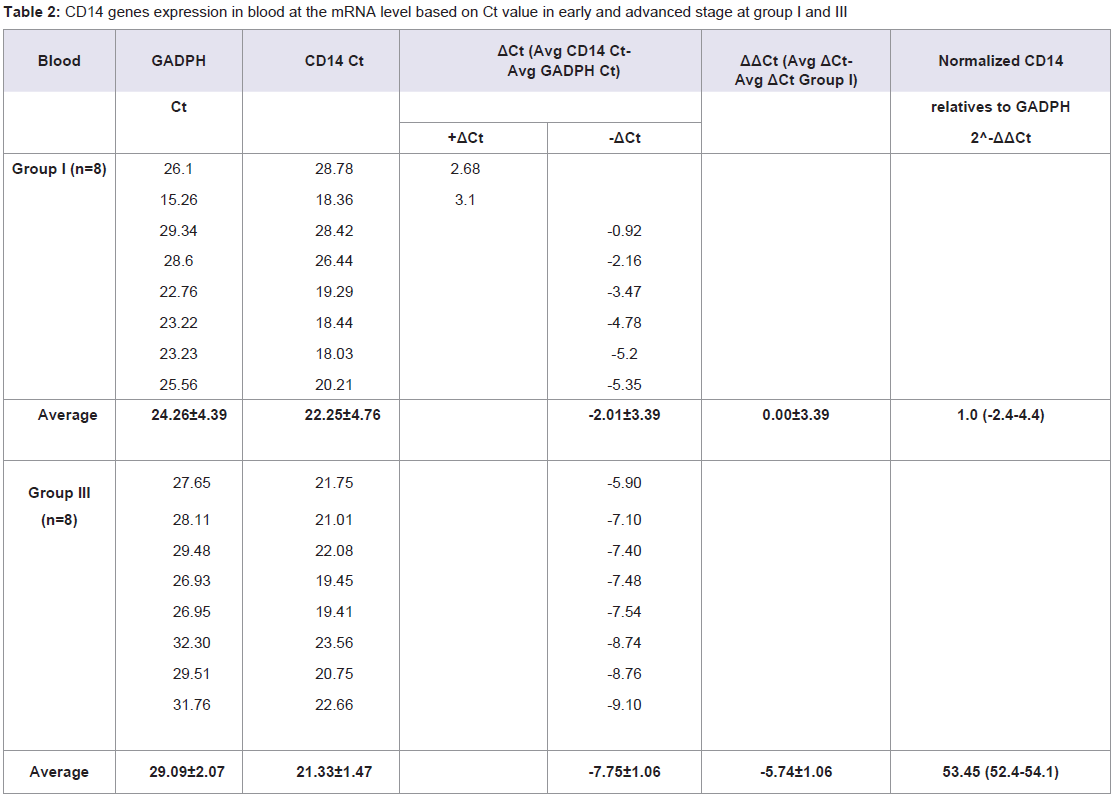
Table 2: CD14 genes expression in blood at the mRNA level based on Ct value in early and advanced stage at group I and III.
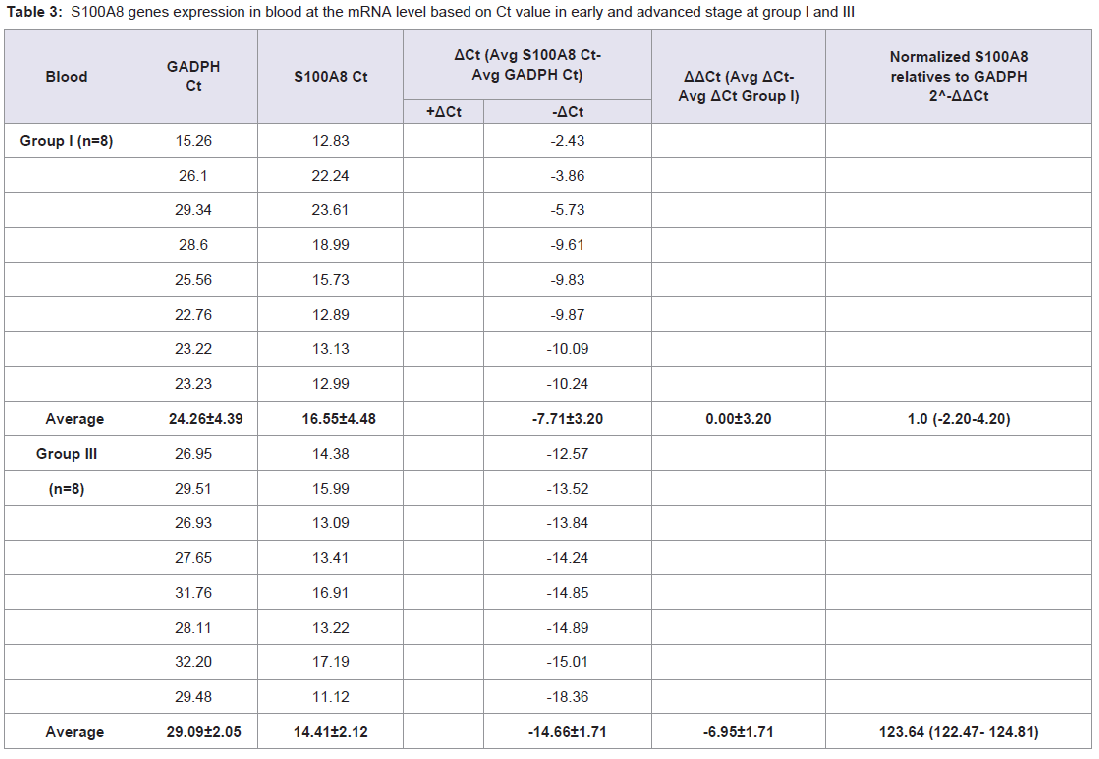
Table 3: S100A8 genes expression in blood at the mRNA level based on Ct value in early and advanced stage at group I and III.
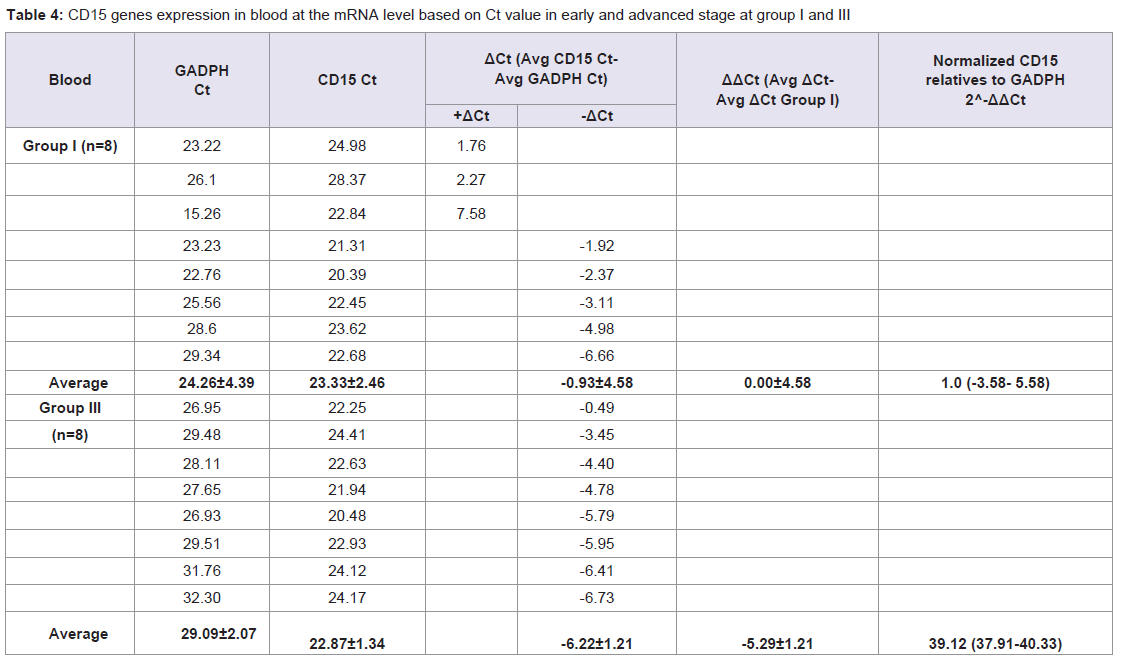
Table 4: CD15 genes expression in blood at the mRNA level based on Ct value in early and advanced stage at group I and III.
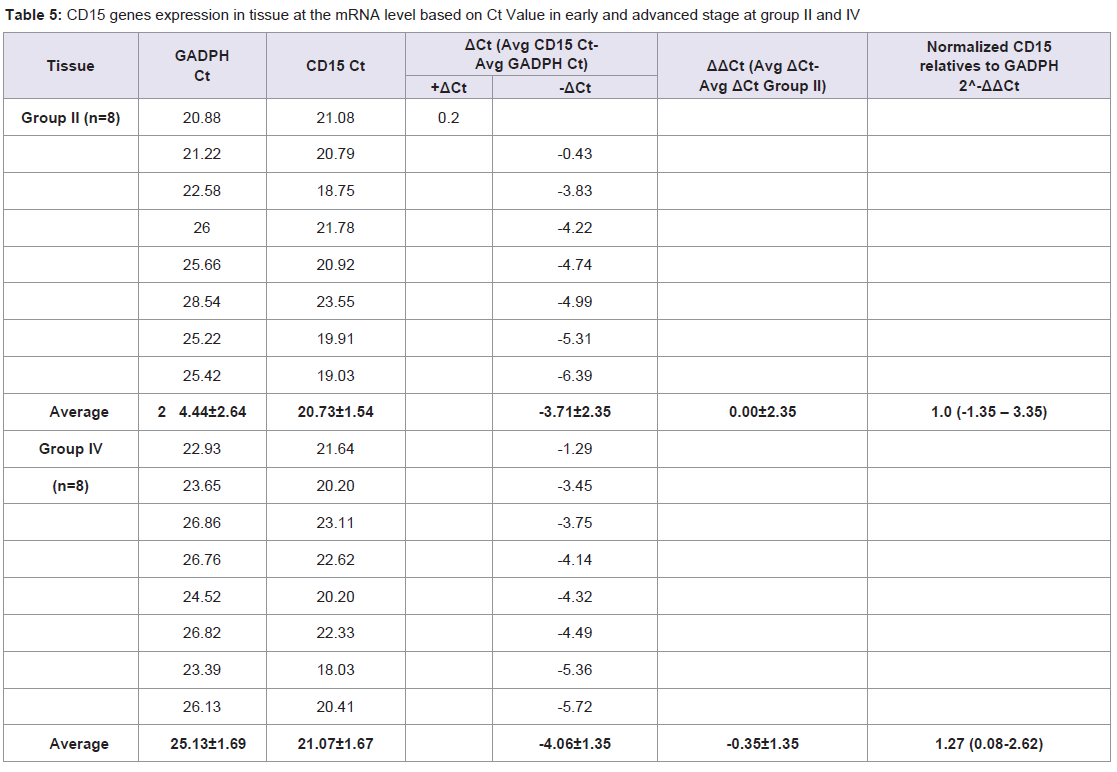
Table 5: CD15 genes expression in tissue at the mRNA level based on Ct Value in early and advanced stage at group II and IV.
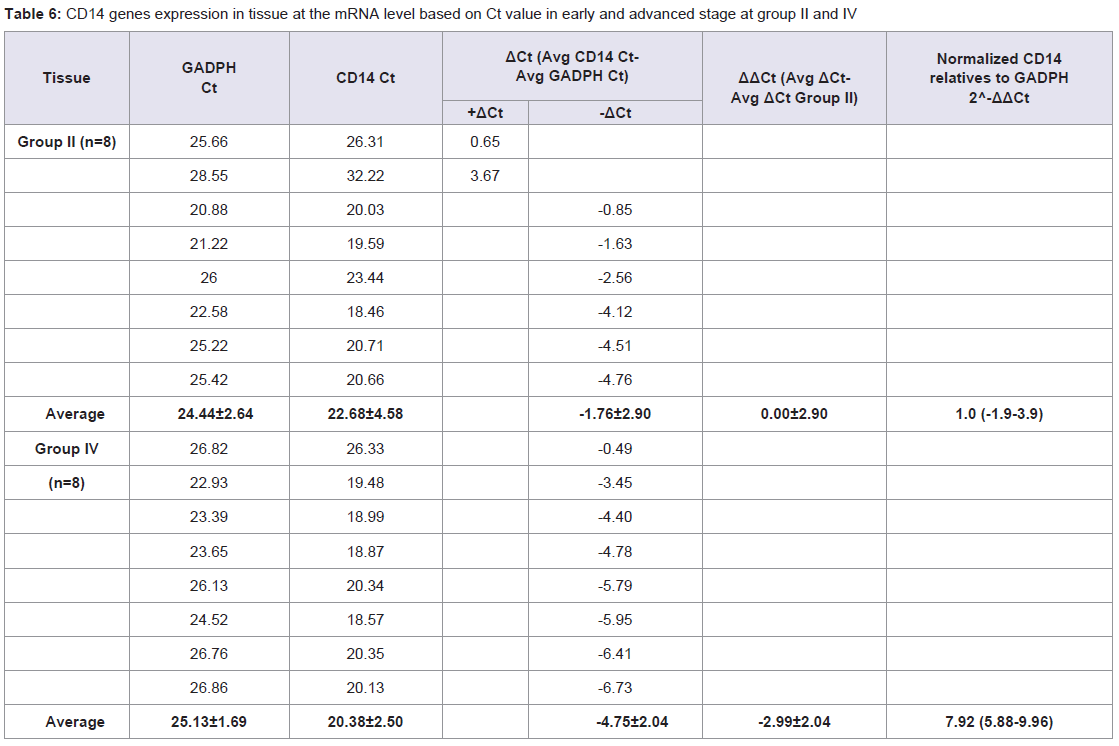
Table 6: CD14 genes expression in tissue at the mRNA level based on Ct value in early and advanced stage at group II and IV.
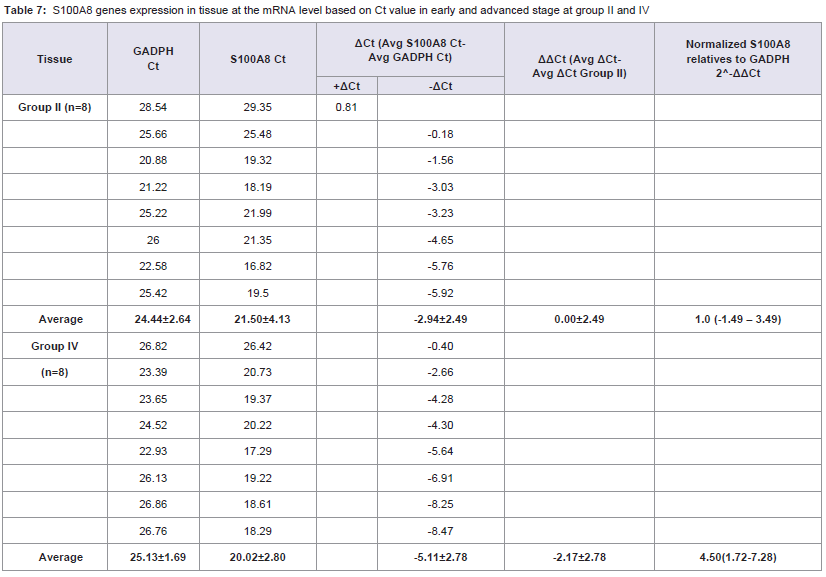
Table 7: S100A8 genes expression in tissue at the mRNA level based on Ct value in early and advanced stage at group II and IV.
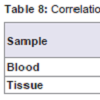
MDSC and S100A8 expression in nasopharyngeal carcinoma blood is significantly high correlated to clinical stage (r=-0.879, p=0.000 for MDSC; r=-0.791, p=0.000 for S100A8). No significant correlation was detected between MDSC and S100A8 expression in nasopharyngeal carcinoma tissue and clinical stage (r=-0.388, p=0.138 for MDSC; r=-0.276, p=0.302 for S100A8) (Table 8).
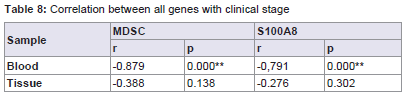
Table 8: Correlation between all genes with clinical stage.
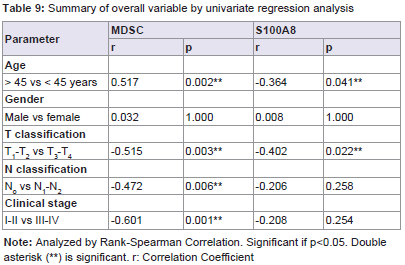
Table 9: Summary of overall variable by univariate regression analysis.
Discussion
MDSC expression was significantly correlated with clinical stage, age, T, and N classifications in NPC patients. Several studies have revealed a relationship between MDSC in carcinoma. Montero et al. demonstrated that circulating Lin-/LoHLA DR-CD33+CD11b+MDSC correlated with clinical tumor stag, increased metastatic tumor burden, and ddAC chemotherapy [12]. Gabrilovich et al. had a conclusion that the myeloid lineage is globally altered in cancer as a single, closely integrated system involving all terminally differentiated myeloid cells and their pathologically activated immature progenitors [5]. Bunt et al. present in his study suggest that the induction of MDSC by proinflammatory cytokines directly contributes to tumor progression by inhibiting tumor immunity [3]. Sherger et al. evaluated in the human literature, the predominance of tumors shown to up regulate MDSCs are carcinoma including those arising from pancreas, colon, and lung [23]. Additionally, specific tumor types many uniquely up regulate specific MDSC subset such as seen with the predominance of CD15. Zhi et al. found the evidence from the literature that MDSC are associated with tumor progression. MDSC in murine tumor models has been found to significantly promote tumor growth [11].Myeloid cells have an important role in facilitating tumor growth by virtue of their ability to locally furnish angiogenic factors and also to deflect the immune response from tumor cells [10]. Myeloid cells with potent immune suppressive activity are present in most patients with malignant tumors like nasopharyngeal carcinoma. MDSC have been characterized by their content of suppressive molecules including arginase, iNOS, and other reactive oxygen species, and have been classified as “neutrophil-like” or “monocyte-like” based on their nuclear morphology [3-6,12]. Since MDSC are induced by multiple tumor and/or host cell-secreted factors, it is likely that the MDSC phenotypes reported in different tumor systems are due to different combinations of factors produced by different tumors [17]. In contrast to MDSC induced by different tumors, MDSC at different sites within an individual are homogeneous in their expression of phenotypic markers and they have the same suppressive activity, indicating that tissue localization does not alter MDSC phenotype or function [17]. In this research we obtained that CD14 and CD15 were sub-phenotype for MDSC.
From the results of qRT-PCR showed that MDSC and S100A8 expression highly expressed in blood rather than tissue. MDSC in blood is easily obtainable in high purity and localized to different sites do not differ.
S100A8 heterodimers mediate these effects through at least two mechanisms: 1) they block the differentiation of myeloid precursors into differentiated DC and macrophages through a STAT3-dependent mechanism and 2) they chemo attract MDSC to tumor sites through a NF-κB-dependent pathway [8]. Therefore, S100A8 proteins facilitate the accumulation of MDSC, unlike the other mediators, MDSC also produce S100A8 proteins, providing for an autocrine feedback loop that sustains the accumulation and retention of MDSC while concomitantly chemo attracting additional pro-inflammatory mediators [8]. In our study showed that MDSC had correlations with S100A8 expression.
In cancer, extracellular S100A8/A9, typically released from the cytoplasm of infiltrating polymorphonuclear leukocytes and macrophages, is associated with inflammation and progressionof the disease [24]. When released, S100A8/A9 can signal through the receptor for advanced glycation end products (RAGE) and tolllike receptor 4 (TLR4) to promote tumor-associated inflammation and progression of advanced stage adenocarcinomas and colitisassociated cancer [24].
Based on the results of this study can be considered to undertake an examination of MDSC in nasopharyngeal carcinoma patients as a determination of progression of the disease. It may be considered to give appropriate therapy if they’re found increased expression of this gene in blood circulation.
Conclusion
MDSC also associated with S100A8 gene expression. The high expression of MDSC and S100A8 was correlated with clinical stage of nasopharyngeal carcinoma especially in blood.Acknowledgements
The Faculty of Medicine Padjadjaran University supports this research. The authors would like to thank Ms. Nurul for their technical assistance and Ms. Nurvita Trianasari for statistical analysis. We are grateful to all patients and clinical colleagues who donated or collected clinical samples.References
- Tulalamba W, Janvilisri T (2012) Nasopharyngeal carcinoma signaling pathway: an update on molecular biomarkers. Int J Cell Biol 2012: 594681.
- Adham M, Kurniawan AN, Muhtadi AI, Roezin A, Hermani B, et al. (2012) Nasopharyngeal carcinoma in Indonesia: epidemiology, incidence, signs, and symptoms at presentation. Chin J Cancer 31: 185-196.
- Bunt SK, Sinha P, Clements VK, Leips J, Ostrand-Rosenberg S (2006) Inflammation induces myeloid-derived suppressor cells that facilitate tumor progression. J Immunol 176: 284-290.
- Gabrilovich DI, Nagaraj S (2009) Myeloid-derived suppressor cells as regulators of the immune system. Nat Rev Immunol 9: 162-174.
- Gabrilovich DI, Ostrand-Rosenberg S, Bronte V (2012) Coordinated regulation of myeloid cells by tumours. Nat Rev Immunol 12: 253-268.
- Greten TF, Manns MP, Korangy F (2011) Myeloid derived suppressor cells in human diseases. Int Immunopharmacol 11: 802-807.
- Murdoch C, Muthana M, Coffelt SB, Lewis CE (2008) The role of myeloid cells in the promotion of tumour angiogenesis. Nat Rev Cancer 8: 618-631.
- Ostrand-Rosenberg S, Sinha P (2009) Myeloid-derived suppressor cells: linking inflammation and cancer. J Immunol 182: 4499-4506.
- Sevko A, Umansky V (2013) Myeloid-derived suppressor cells interact with tumors in terms of myelopoiesis, tumorigenesis and immunosuppression: thick as thieves. J Cancer 4: 3-11.
- Shojaei F, Zhong C, Wu X, Yu L, Ferrara N (2008) Role of myeloid cells in tumor angiogenesis and growth. Trends Cell Biol 18: 372-378.
- Zhi L, Toh B, Abasto JP (2012) Myeloid derived suppressor cells: subsets, expansion, and role in cancer progression. In: Biswas SK (ed). Tumor microenvironment and myelomonocytic cells. Publisher: InTech, pp. 63-88.
- Diaz-Montero CM, Salem ML, Nishimura MI, Garrett-Mayer E, Cole DJ, et al. (2009) Increased circulating myeloid-derived suppressor cells correlate with clinical cancer stage, metastatic tumor burden, and doxorubicin-cyclophosphamide chemotherapy. Cancer Immunol Immunother 58: 49-59.
- Li H, Han Y, Guo Q, Zhang M, Cao X (2009) Cancer-expanded myeloid-derived suppressor cells induce anergy of NK cells through membrane-bound TGF-beta 1. J Immunol 182: 240-249.
- Zhang B, Wang Z, Wu L, Zhang M, Li W, et al. (2013) Circulating and tumor-infiltrating myeloid-derived suppressor cells in patients with colorectal carcinoma. PloS One 8: e57114.
- Sawanobori Y, Ueha S, Kurachi M, Shimaoka T, Talmadge JE, et al. (2008) Chemokine-mediated rapid turnover of myeloid-derived suppressor cells in tumor-bearing mice. Blood 111: 5457-5466.
- Teicher BA, Fricker SP (2010) CXCL12 (SDF-1)/CXCR4 pathway in cancer. Clin Cancer Res 16: 2927-2931.
- Sinha P, Okoro C, Foell D, Freeze HH, Ostrand-Rosenberg S, et al. (2008) Proinflammatory S100 proteins regulate the accumulation of myeloid-derived suppressor cells. J Immunol 181: 4666-4675.
- Cancer AJCo (2002) Pharynx (Including base of tounge, soft palate, and uvula). In: Greene FL, Page DL, Flemming ID, Fritz AG, Balch CM, et al. (Eds). AJCC Cancer Staging Manual (6th Edn). Springer, New York, pp. 33-45.
- Budiman, Feranthy ZA, Shahib MN (2015) The existence of mRNAs and miRNAs expressions for maintaining cell survival networks associated with the human transparent and cataractous lens. J Ocular Biol 3: 8.
- Shahib MN, Budiman, Feranty ZA (2015) Studies on gene expressions at the RNA level associated with the senile lens changes in human lens cataract. Donnish J Med Med Sci 2: 011-018.
- Livak KJ, Schmittgen TD (2001) Analysis of relative gene expression data using real-time quantitative PCR and the 2(-Delta Delta C(T)) Method. Methods 25: 402-408.
- Schmittgen TD, Zakrajsek BA (2000) Effect of experimental treatment on housekeeping gene expression: validation by real-time, quantitative RT-PCR. J Biochem Biophys Methods 46: 69-81.
- Shenger M, Kisseberth W, London C, Olivo-Marston S, Papenfuss TL (2012) Identification of myeloid derived suppressor cells in the peripheral blood of tumor bearing dogs. BMC Vet Res 8: 209.
- Khammanivong A, Wang C, Sorenson BS, Ross KF, Herzberg MC (2013) S100A8/A9 (calprotectin) negatively regulates G2/M cell cycle progression and growth of squamous cell carcinoma. PloS One 8: e69395.