
Research Article
*Address for Correspondence: Malik Altaf Hussain, Department of Wine, Food and Molecular Biosciences, Lincoln University, Lincoln 7647, New Zealand, Tel: +6434230638; E-mail: Malik.Hussain@lincoln.ac.nz
Citation: Hussain MA, Wu X, Natt N, Amoafo O. Cytosolic Proteomes of Lactobacillus rhamnosus ATCC27773 Cells Grown in pH 5.5 and 6.5. J Proteomics Computational Biol. 2015;2(1): 7.
Copyright © 2015 Hussain MA, et al. This is an open access article distributed under the Creative Commons Attribution License, which permits unrestricted use, distribution, and reproduction in any medium, provided the original work is properly cited.
Journal of Proteomics & Computational Biology | Volume: 2, Issue: 1
Submission: 29 January, 2015 | Accepted: 10 February, 2015 | Published: 14 February, 2015
Reviewed & Approved by: Dr. Bin Deng, Assistant Professor, Department of Biology, University of Vermont, USA
 Overall, the assessment of the cytosolic proteomes generated from the cells cultured in MRS broth adjusted and maintained at two different pH conditions (6.5 and 5.5) showed noticeable variations (Figure 2). There were proteins with varying degrees of expression with a 1.50- to 4.27-fold relative increase, or some proteins were absent in the cells grown at a particular pH (6.5 or 5.5). Nineteen proteins were expressed only in the cells grown at pH 6.5 and were not detected in the cells harvested from cultures at pH 5.5. Similarly, six proteins were only present in the cytosolic proteome of the cells grown at pH 5.5. Around 89% proteins were commonly expressed in both cytosolic proteomes. However, fourteen proteins were expressed in greater quantities in the cells grown at pH 6.5 rather than at pH 5.5. Similarly, 23 proteins were induced in the cells in response to pH 5.5. Changes to the homeostatic environment of bacteria (including pH) causes the bacteria to adjust their metabolism, growth, and translational and transcriptional biochemistry by producing enzymes (proteins) to help them adjust to changes in their environments [28-30].
 It has been shown from the literature that the growth pattern of lactobacilli and biomass yield was influenced by pH and temperature. There were noticeable differences between different species and strains in their response to pH conditions. Reports suggested that a lower pH of fermentation (pH 5 vs pH 6) produced cells with diverse and robust physiological attributes [31]. In this study, induction of higher numbers of proteins in pH 5.5 compared to pH 6.5 was observed, which clearly demonstrated a stronger physiological response of L. rhamnosus cells at the lower pH. Deepika et al. evaluated the effect of fermentation conditions (pH 5, 5.5, 6, 6.5 and temperature 25, 30 and 37 °C) on the surface properties of L. rhamnosus GG and its adhesion to Caco-2 cells [32]. The rationale to compare optimal growth conditions (pH 6.5 and temperature 37 °C) to suboptimal conditions (pH < 6 and temperature < 37 °C) was that important changes could take place when growing the cells in such environments.
Cytosolic Proteomes of Lactobacillus rhamnosus ATCC27773 Cells Grown in pH 5.5 and 6.5
Malik Altaf Hussain1*, Xiyang Wu2, Navdeep Natt1 and Omega Amoafo1
- 1Department of Wine, Food and Molecular Biosciences, Lincoln University, Lincoln 7647, New Zealand
- 2Department of Food Science and Engineering, Jinan University, Guangzhou, China
*Address for Correspondence: Malik Altaf Hussain, Department of Wine, Food and Molecular Biosciences, Lincoln University, Lincoln 7647, New Zealand, Tel: +6434230638; E-mail: Malik.Hussain@lincoln.ac.nz
Citation: Hussain MA, Wu X, Natt N, Amoafo O. Cytosolic Proteomes of Lactobacillus rhamnosus ATCC27773 Cells Grown in pH 5.5 and 6.5. J Proteomics Computational Biol. 2015;2(1): 7.
Copyright © 2015 Hussain MA, et al. This is an open access article distributed under the Creative Commons Attribution License, which permits unrestricted use, distribution, and reproduction in any medium, provided the original work is properly cited.
Journal of Proteomics & Computational Biology | Volume: 2, Issue: 1
Submission: 29 January, 2015 | Accepted: 10 February, 2015 | Published: 14 February, 2015
Reviewed & Approved by: Dr. Bin Deng, Assistant Professor, Department of Biology, University of Vermont, USA
Abstract
Lactobacillus rhamnosus is an important bacterium from a health and industry perspective. Cytoplasmic proteomes of L. rhamnosus ATCC2773 were studied to elucidate the specific growth condition variations and the changes occurring in the protein expression patterns of this bacterium when cultivated in a standard rich medium under two different pH conditions (pH 6.4 and 5.5). A total of 220 proteins were identified and compared by quantitative proteomic analysis using iTRAQ LC-MS/MS. A functional classification of the cytoplasmic proteins of L. rhamnosus revealed translation and carbohydrate metabolism associated proteins as the major groups. A comparison of proteome data showed that the majority of proteins (89%) have similar expression patterns in cells grown in pH 6.5 and 5.5. The key differences observed in the proteomes of L. rhamnosus grown in pH 6.5 and 5.5 were: 19 proteins were present at pH 5.5 but not expressed at pH 6.5 and six proteins were expressed at pH 6.5 but not at pH 5.5. Specific proteins were induced by each condition: 14 and 23 proteins in response to pH 6.5 and pH 5.5, respectively. This study illustrated the impact of culture conditions on the proteome of L. rhamnosus.Keywords
Growth specific proteins; Lactobacillus rhamnosus; Cytosolic proteome; iTRAQ analysis; pHAbbreviations
GI: Gastrointestinal; LAB: Lactic Acid Bacteria; iTRAQ: Isobaric Tags for Relative and Absolute Quantitation; MRS: Mann Rogosa Sharpe; SCX: Strong Cation Exchange; LC-MS: Liquid Chromatography–Mass Spectrometry; NCBI: National Center for Biotechnology InformationIntroduction
Lactobacilli are members of the microbial community associated with the human gastrointestinal (GI) tract. There is documented evidence that lactobacilli are beneficial for their host due to their ability to inhibit the growth of potential harmful bacteria in the GI tract [1-4]. One of the most commonly marketed probiotic lactobacilli is Lactobacillus rhamnosus GG. L. rhamnosus is frequently isolated from a large variety of ecological niches that include fermented food products, the human gastrointestinal tract and oral and vaginal cavities. It is classified as a facultatively hetero-fermentative lactic acid bacterium (LAB). Several strains of L. rhamnosus (GG, HN001, ATCC53103) demonstrate probiotic effects. L. rhamnosus GG and HN001 are the most prominent probiotic strains [5-9] and have been extensively studied. The use of bacteria in an expanding array of microbial applications creates stressful conditions for their survival, thus, bacteria like L. rhamnosus have developed various metabolic responses to cope with these conditions. A significant amount of research has focused on bacterial stress responses. Accordingly, L. rhamnosus has been shown to respond to stress factors such as heat shock [10,11], presence of lactic acid [12], bile [13,14] and low pH [15].Proteomics is considered to be a new technology-driven approach dedicated to the identification of proteins on a genome-wide scale [16]. The latest high-throughput proteomic approaches offer new options to study probiotic bacteria from a different perspective. This technique allows not only the identification of proteins but also the extensive characterisation of their primary structures (maturation, post-translational modifications and degradation), topology (structural proteomics), interaction networks (interactomics), function (chemical proteomics), regulation (quantitative proteomics) and turnover [17]. Proteomics is an emerging field in probiotic research. The first important application of proteomics is to obtain a proteome map, or overview, of the bacterial protein content; secondly, understanding the adaptation to gut conditions, such as low pH and bile acids, is an important research theme; thirdly, proteomics is a tool to answer important questions about the molecular biology of potential probiotic bacteria. Previous reviews have discussed the proteomics of LAB in general [18-20] but only a few have focused on the proteomics of probiotic bacteria [21,22] are available.
In a recent study, Savijoki et al. compared the proteomes of two L. rhamnosus strains, GG and Lc705 [23]. The GG strain is a well-known for probiotic applications and strain Lc705 is used by the dairy industry. Proteomics analysis resulted in the identification of more than 1600 proteins in each strain. The identified proteins make up nearly 60% of the predicted proteomes of L. rhamnosus. Comparative analysis revealed that the expression of more than 90 and 150 proteins were uniquely present in GG and Lc705, respectively. Differences were in the proteins with functionalities in biofilm formation, phage-related functions, reshaping the bacterial cell wall and immunomodulation. These differences did not come as a surprise, as lactobacilli such as L. casie, L. plantarum and L. rhamnosus have diverse habitats and, thus, the variation in the protein expression patterns of different strains adapted to diverse ecological niches is natural. However, more detailed information on the dynamics of global protein expression patterns during the growth of these microorganism is needed and, more importantly, studies are required to detect the specific differences under different physiological conditions.
In this work, we investigated growth-related variations in the cytoplasmic proteome of L. rhamnosus strain ATCC27773, a strain with potential uses as a probiotic research and in industry applications. This strain has been applied in microbiological assays to determine folate in serum and red cells [24,25]. L. rhamnosus ATCC27773 also showed a positive effect as a probiotic for the treatment of functional dyspepsia [26]. In order to achieve a better understanding of strainspecific differences in the protein expression patterns of industrial strains adapted to specific applications, we report on the cytoplasmic proteome of L. rhamnosus and differences seen in the proteomes of cells grown in two pH conditions (6.4 and 5.5).
Materials and Methods
Bacteria and growth conditionsL. rhamnosus ATCC27773 was procured from the New Zealand Reference Culture Collection (ESR Ltd New Zealand) and long-term stock was maintained in 50% MRS-glycerol at -80 °C. An overnight culture was prepared by inoculating 10 mL of Mann Rogosa Sharpe (MRS) broth (Oxoid) and incubating at 37 °C under anaerobic conditions. Harvested cells were transferred into a modified MRS broth [27] prepared using 0.3 M phosphate buffer to maintain the required pH (5.5 and 6.5) during the incubation period. The starting OD600nm of the cultures was adjusted to ~0.2. All cultures were incubated at 37 °C for 8 h under anaerobic conditions. The cells were then harvested by centrifugation at 10,000 x g for 10 min at 4 °C and washed twice with 40 mM Tris-buffer (pH 7.0) before re-suspending them in appropriate volumes of 40 mM Tris buffer to achieve a final OD600nm of 20. Bacterial cell suspensions were stored at -80 °C until further use. Each growth condition was tested in duplicate and the experiments were repeated at least twice.
Cytosolic protein samples preparation
The frozen bacterial suspensions were thawed and lysed using a mini-bead beater. Half a gram of sterile zirconium beads (0.1 mm) were mixed with 0.5 ml of cell suspension before mechanically lysing the cells through four beating cycles, e.g. one x 90 s cycle was followed by three beating cycles of 60 s each (with a five minute cooling on ice between each beating cycle). The cytosolic protein rich supernatant was collected after removing the cell debris by centrifugation at 13,000 x g for 30 min at 4 °C. Cytosolic protein samples were stored at -80 °C until used for proteomic analysis.
iTRAQ labelling of the protein sample
Eighty micrograms of cytosolic proteins from each sample were mixed with ten μg of trypsin for digestion and then incubated at 37 °C overnight. The trypsin digests were dried and suspended each in 20 μl 0.5M TEAB and labeled using an iTRAQ reagents-8plex k it (AB SciexPte. Ltd) according to the manufacturer’s instructions. Every sample was labeled twice and the aliquots of iTRAQ were combined with peptide mixtures from different samples, and incubated at room temperature for 1 h.
Identification of proteins through LC-MS/MS and data analysis
The iTRAQ labeled peptides were fractionated through a 5 μM BioX-SCX column (Dionex, Auckland, New Zealand) into 10 fractions with 0, 1, 5, 10, 20, 40, 60, 80, 100% 2 M ammonium formate in 2%. The SCX fractionation was performed using high-pressure liquid chromatography. For LC-MS/MS analysis, two microlitres of sample were loaded on a C18AQ nano trap (Bruker, 75 μm × 2 cm, C18AQ, 3 μm particles, 200 Å pore size) using nanoAdvance UPLC coupled to a maXis impact mass spectrometer equipped with a CaptiveSpray source (Bruker Daltonik, Bremen, Germany). The column oven was heated to 50 °C. Elution was with a gradient from 0% to 40% B in 90 min at a flow rate of 800 nl/min. Solvent A was LCMS-grade water with 0.1% FA and 1% ACN; solvent B was LCMS-grade ACN with 0.1% FA and 1% water. Samples were measured in the auto MS/MS mode, with a mass range of m/z 50-2200, followed by one full MS scan, the 10 most abundant ions were subjected to MS/MS analysis. The acquisition speed was maintained at 2 Hz in MS and 10 or 5 Hz in MS/MS mode depending on precursor intensity. Precursors were selected in the m/z 400-1400 range, with charge states of 2-5 (single charge ions were excluded) and active exclusion was activated after 1 spectrum for 0.3 min.
Data analysis was conducted by submitting peak list files (mgf format) to an in-house Mascot server (v2.4) (Matrix Science, UK). The search parameters included: taxonomy Lactobacillus rhamnosus; enzyme semi trypsin; cysteine modification carbamidomethyl; MS tolerance 0.02 Da; MS/MS tolerance 0.1 Da; 1 missed cleavage; instrument specificity ESI-QUAD-TOF. Mascot iTRAQ parameters included variable iTRAQ8plex (N-term, K, Y), with reporter ions defined as appropriate for the experiment. Peptides with a score below 20, and proteins with fewer than two peptides were discarded. Only unique peptides were used for this quantification. Normalisation was based on division by channel sum. Protein functionalities were searched in several online proteomics databases (http://www.ncbi.nlm.nih.gov/; http://www.matrixscience.com/; http://www.uniprot.org/) and appropriate literature. Proteins were classified into different groups through manual processing.
Results and Discussion
The gel free proteomics technique, iTRAQ LC-MS/MS analysis, was used to identify constitutively expressed proteins in the cytosolic extract of L. rhamnosus grown in MRS broth under anaerobic conditions. This study also described the dynamics of the cytosolic proteome of L. rhamnosus in response to two pH conditions (5.5 and 6.5). An increase of 1.5-fold or more in the relative expression of a protein was considered for differential expression.Cytosolic proteome of L. rhamnosus
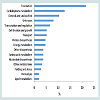
In this study, a total of 220 different proteins were identified in the cytosolic proteome of L. rhamnosus (Supplementary Table). The identified proteins were grouped according to their functionalities (Figure 1). Functional grouping revealed the distribution of the proteins: translation (n=46, 21.60%), carbohydrate metabolism (n=27, 12.68%), general and unclassified proteins (n=22,12.68%), unknown proteins (n=17, 10.33%), transcription and regulation (n=14, 6.57%), cell division and growth (n=11 5.16%), transport, (n=11,5.16%), protein biosynthesis (n=10, 4.69%), energy metabolism (n=10, 4.96%), other biosynthesis (n=8, 3.76%), amino acids (n=8, 3.76%), nucleotides (n=8, 3.76%), other metabolisms (n=7, 3.29%), folding and stress (n=6, 2.82%), proteolysis (n=4, 1.88%) and lipid metabolism (n=4, 1.88%). This study showed that proteins involved in translation and carbohydrate metabolism were the major functional groups in the cytoplasmic proteome of L. rhamnosus ATCC 27773. Koskenniemi et al. reported that growth of L. rhamnosus LGG in a laboratory medium (MRS broth) increased the expression of translation proteins [24].
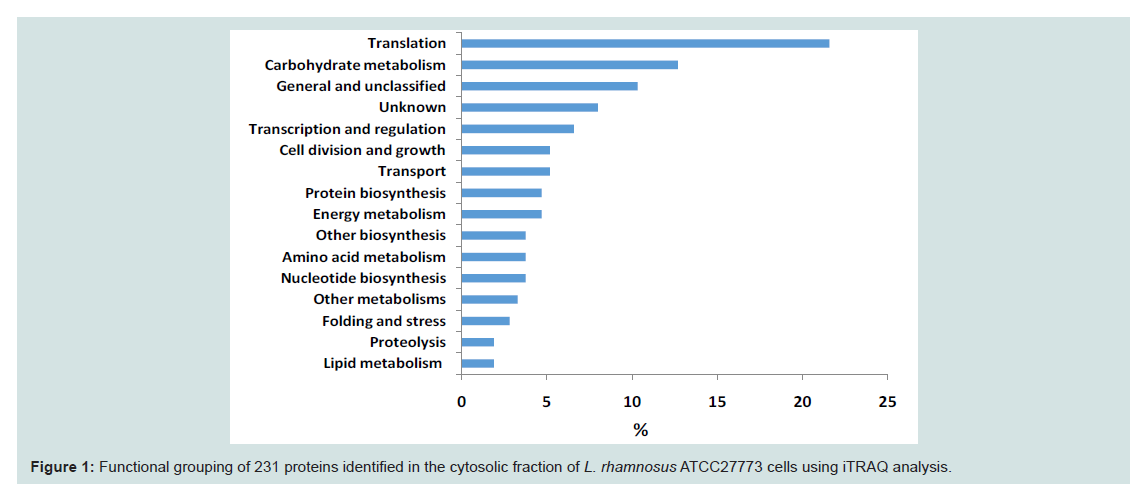
Figure 1: Functional grouping of 231 proteins identified in the cytosolic fraction of L. rhamnosus ATCC27773 cells using iTRAQ analysis.
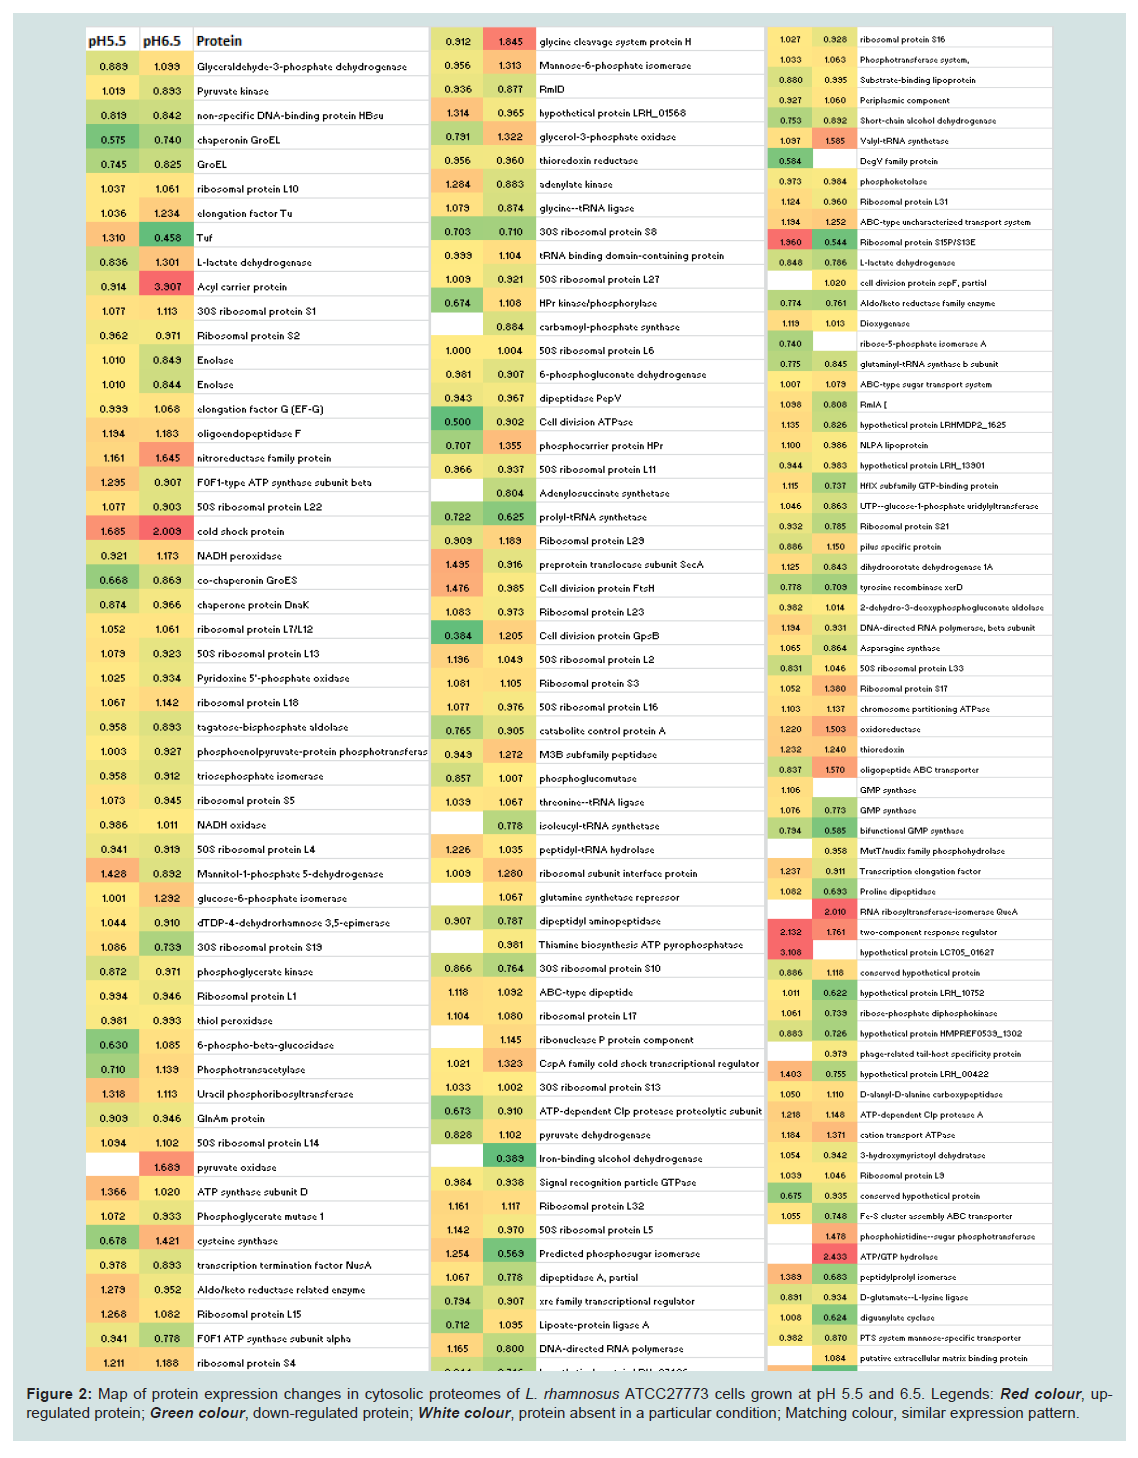
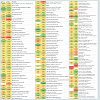
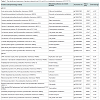
Figure 2: Map of protein expression changes in cytosolic proteomes of L. rhamnosus ATCC27773 cells grown at pH 5.5 and 6.5. Legends: Red colour, upregulated protein; Green colour, down-regulated protein; White colour, protein absent in a particular condition; Matching colour, similar expression pattern.
Proteins induced at pH 6.5
Fourteen proteins were induced in response to pH 6.4 and five of them had an induction factor in the range of 2.02 - 4.27 (Table 1). Among the highly expressed proteins were: acyl carrier protein, a transport protein, was expressed 4.27-fold; cell division protein GpsB (homology with L. rhamnosus LRHMDP2) increased 3.14 times; a transcriptional protein of the MarR family had a 3.08-fold increase; a cysteine synthase protein and a glycine cleavage system protein H were over-expressed 2.10- and 2.02-fold, respectively. Other differentially expressed proteins (increased 1.56 to 1.92 times) were phosphotransacetylase, a lysine transporter protein, uracil phosphoribosyltransferase, lipoate-protein ligase A, HPrkinase/ phosporylase, a cell division ATPase protein, glycerol-3-phosphate oxidase, L-lactate dehydrogenase and phosphocarrier protein HPr.
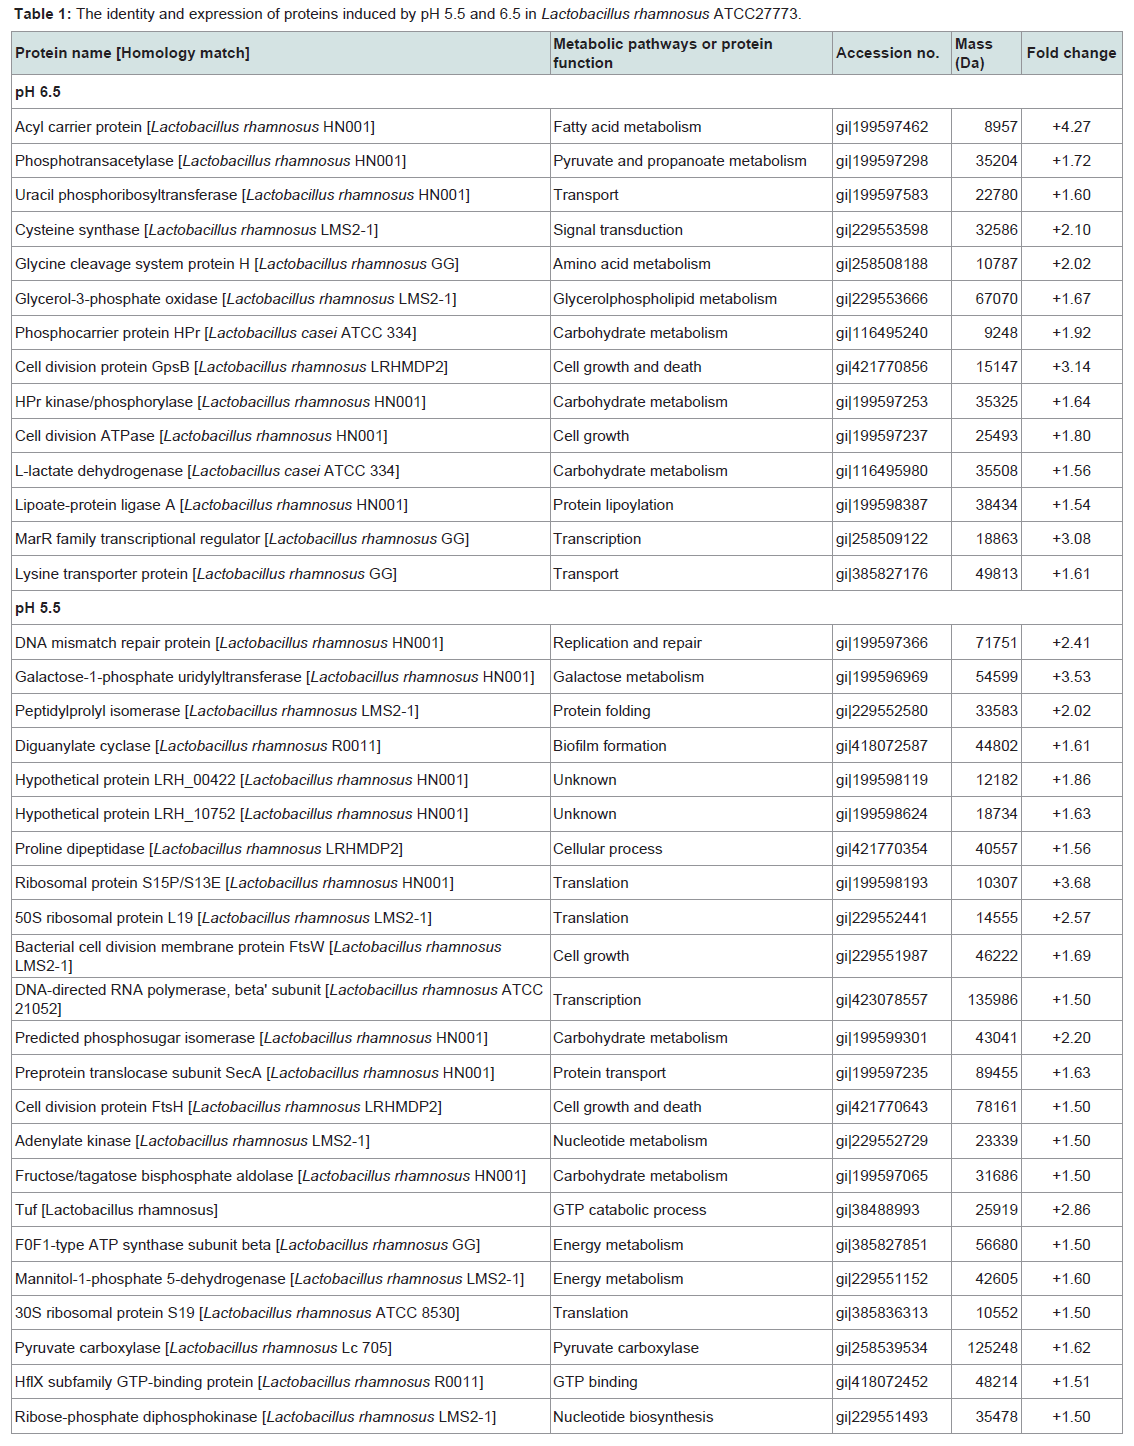
Table 1: The identity and expression of proteins induced by pH 5.5 and 6.5 in Lactobacillus rhamnosus ATCC27773.
Nineteen proteins were detected in the cells of L. rhamnosus grown at pH 6.5 that were not present in cultures of L. rhamnosus grown at pH 5.5. These proteins included pyruvate oxidase, adenyl succinate synthase, carbamoyl-phosphate synthase, isoleucyl-tRNA synthase, glutamine synthetase repressor, thiamine biosynthesis ATP pyrophosphatase, ribonuclease P protein component, iron-binding alcohol dehydrogenase, Hsp33-like chaperonin, 3-oxoacyl (acyl carrier protein) synthase III, cell division protein sepF partial, MutT/nudix family phosphohydrolase, RNA ribosyltransferase-isomerase Que A, phage-related tail-host specificity protein, phosphohistidinesugar phosphotransferase, ATP/GTP hydrolase, putative extracellular matrix binding protein, a conserved hypothetical protein and preprotein translocate subunit YajC.
Most of the proteins produced and/or expressed by the cells at pH 6.5 were associated with cell growth and active metabolic cellular processes. Previous studies showed that pH 6.5 and 37 °C were the best conditions for L. rhamnosus GG cells’ adhesion ability [32]. Our observations on the basis of proteomics data supported that cells produced a range of enzymes required for vigorous growth and normal cell activities at pH 6.5 and 37 °C. Induction of protein-related stress factors or cellular damage was not seen under these conditions.
Proteins induced at pH 5.5
Twenty three proteins were up-regulated at pH 5.5 with the increase ranging from1.50- to 3.68-fold; seven of these proteins had a differential expression value of >2-fold. These highly expressed proteins included a DNA mismatch repair protein (2.41-fold), galactose-1-phosphate uridylytransferase (3.53-fold), ribosomal protein S15P/S13E (3.68-fold), 50S ribosomal protein L19 (2.57-fold), predicted phosphosugar isomerase protein (2.20-fold) and Tuf protein (2.86-fold). Preprotein translocase subunit SecA, fructose/ tagatose bisphosphate aldolase, ribose-phosphate diphosphokinase, mannitol-1-phosphate 5-dehydrogenase, bacterial cell division membrane protein FtsW, diguanylate cyclase, prolinedipeptidase protein, cell division protein FtsH, 30S ribosomal protein S19, HfIX subfamily GTP-binding protein, pyruvate carboxylase protein, hypothetical proteins LRH_0042 and LRH_10752 were also detected in relatively higher amounts in the cells growth at pH 5.5. Six proteins expressed at pH 5.5 but not at pH 6.5 included: DegV family protein, ribose-5-phosphate isomerase A, GMP synthase, hypothetical protein LC705_01627, adhesion exoprotein and translation initiation protein.
Cells grown at the relatively suboptimal pH (5.5) had a higher expression of proteins involved in DNA repair, translation, protein folding and transport, biofilm formation and adhesion abilities. Induction of hypothetical proteins was also seen in cells grown at lower pH. The pH conditions used in this study were harsh enough to impose acidic stress on bacterial cells as generally used by other authors [33]; thus discussion on acid stress responses will be irrelevant. This proteomic study was to identify and characterize protein expression in L. rhamnosus in two different growth conditions, which were important to understand its functionality and characteristics when used as a probiotic and industrial microorganism. Further proteomics work is needed to develop better understanding of protein expression differences in different Lactobacillus strains in relation to specific growth conditions.
Conclusions
This study was initiated to construct the cytosolic proteome of L. rhamnosus ATCC27773 and evaluate the impact of culture conditions (pH) on the proteomic profile of cells. This present cytosolic proteome is the first study to catalogue L. rhamnosus ATCC27773 proteins to date. The temperature and the pH of cultures influenced several physiological and technological properties such as growth, mass yield, surface composition, metabolic by-products and the level of adhesion of lactobacilli. Comparison of changes in the cytosolic proteomes of cells grown at pH 6.5 and 5.5 clearly showed that the strain had difference in their proteomics expression under the different culture conditions. Suboptimal growth conditions generally improved physiological responses as shown by the expression of greater numbers of proteins seen in the case of pH 5.5. This attribute was thought to increase the robustness and technological properties of the cells. In conclusion, this study provided a detailed cytosolic proteome of a lactobacilli strain and paved the way to understand its functionality and characteristics for industrial use.Acknowledgements
This work was supported by the faculty of agriculture and life sciences, Lincoln University New Zealand. The authors thank AgResearch Ltd Lincoln (New Zealand) for the iTRAQ-LC-MS/MS analysis and help with data interpretation.References
- Gill HS, Shu Q, Lin H, Rutherfurd KJ, Cross ML (2001) Protection against translocating Salmonella typhimurium infection in mice by feeding the immuno-enhancing probiotic Lactobacillus rhamnosus strain HN001. Med Microbiol Immunol 190: 97-104.
- Kalliomäki M, Salminen S, Poussa T, Arvilommi H, Isolauri E (2003) Probiotics and prevention of atopic disease: 4-year follow-up of a randomised placebo-controlled trial. Lancet 361: 1869-1871.
- Collado MC, Jalonen L, Meriluoto J, Salminen S (2006) Protection mechanism of probiotic combination against human pathogens: in vitro adhesion to human intestinal mucus. Asia Pac J Clin Nutr 15: 570-575.
- Wickens K, BlackP, StanleyT, Mitchell E, Barthow C, et al. (2012) A protective effect of Lactobacillus rhamnosus HN001 against eczema in the first 2 years of life persists to age 4 years. Clin Exp Allergy 42: 1071-1079.
- Cross M, Mortensen R, Kudsk J, Gill H (2002) Dietary intake of Lactobacillus rhamnosus HNOO1 enhances production of both Th1 and Th2 cytokines in antigen-primed mice. Med Microbiol Immunol 191: 49-53.
- Shu Q, Gill HS (2002) Immune protection mediated by the probiotic Lactobacillus rhamnosus HN001 (DR20™) against Escherichia coli O157: H7 infection in mice. FEMS Immunol Med Microbiol 34: 59-64.
- Lin PW, Myers LE, Ray L, Song SC, Nasr TR, et al. (2009) Lactobacillus rhamnosus blocks inflammatory signaling in vivo via reactive oxygen species generation. Free Radic Biol Med 47: 1205-1211.
- Thomas DJ, Husmann RJ, Villamar M, Winship TR, Buck RH, et al. (2011) Lactobacillus rhamnosus HN001 attenuates allergy development in a pig model. PLoS ONE 6: e16577.
- Lahtinen SJ, Forssten S, Aakko J, Granlund L, Rautonen N, et al. (2012) Probiotic cheese containing Lactobacillus rhamnosus HN001 and Lactobacillus acidophilus NCFM® modifies subpopulations of fecal lactobacilli and Clostridium difficile in the elderly. Age (Dordr) 34: 133-143.
- Tao Y, Drabik KA, Waypa TS, Musch MW, Alverdy JC, et al. (2006) Soluble factors from Lactobacillus GG activate MAPKs and induce cytoprotective heat shock proteins in intestinal epithelial cells. Am J Physiol Cell Physiol 290: C1018-C1030.
- Sikora A, Grzesiuk E (2007) Heat shock response in gastrointestinal tract. J Physiol Pharmacol 58: 43.
- De Keersmaecker SC, Verhoeven TL, Desair J, Marchal K, Vanderleyden J, et al. (2006) Strong antimicrobial activity of Lactobacillus rhamnosus GG against Salmonella typhimurium is due to accumulation of lactic acid. FEMS Microbiol Lett 259: 89-96.
- Succi M, Tremonte P, Reale A, Sorrentino E, Grazia L, et al. (2005) Bile salt and acid tolerance of Lactobacillus rhamnosus strains isolated from Parmigiano Reggiano cheese. FEMS Microbiol Lett 244: 129-137.
- Koskenniemi K, Koponen J, Kankainen M, Savijoki K, Tynkkynen S, et al. (2009) Proteome analysis of Lactobacillus rhamnosus GG using 2-D DIGE and mass spectrometry shows differential protein production in laboratory and industrial-type growth media. J Proteome Res 8: 4993-5007.
- Saarela M, Alakomi H, Puhakka A, Mättö J (2009) Effect of the fermentation pH on the storage stability of Lactobacillus rhamnosus preparations and suitability of in vitro analyses of cell physiological functions to predict it. J Appl Microbiol 106: 1204‑1212.
- VerBerkmoes NC, Connelly HM, Pan C, Hettich RL (2004) Mass spectrometric approaches for characterizing bacterial proteomes. Expert Rev Proteomics 1: 433-447.
- Doherty MK, Whitfield PD (2011) Proteomics moves from expression to turnover: update and future perspective. Expert Rev Proteomics 8: 325-334.
- De Angelis M, Gobbetti M (2004) Environmental stress responses in Lactobacillus: a review Proteomics 4: 106-122.
- Di Cagno R, De Angelis M, Calasso M, Gobbetti M (2011) Proteomics of the bacterial cross-talk by quorum sensing. J Proteomics 74: 19-34.
- Hussain MA, Hosseini Nezhad M, ShengM, Amoafo OY (2013) Proteomics and the stressful life of lactobacilli. FEMS Microbiol Lett 349: 1-8.
- Aires J, Butel MJ (2011) Proteomics, human gut microbiota and probiotics. Expert Rev Proteomics 8: 279-288.
- Hosseini Nezhad M, Hussain MA, Britz ML (2013) Stress responses in a probiotics Lactobacillus casei. Crit Rev Food Sci Nutr 55: 740-749.
- Savijoki K, Lietzén N, Kankainen M, Alatossava T, Koskenniemi K, et al. (2011) Comparative proteome cataloging of Lactobacillus rhamnosus strains GG and Lc705. J Proteome Res 10: 3460-3473.
- O'Broin S, Kelleher B (1992) Microbiological assay on microtitre plates of folatein serum and red cells. J Clin Pathol 45: 344-347.
- Shane B (2011) Folate status assessment history: implications for measurementof biomarkers in NHANES. Am J Clin Nutr 94: 1S-6S.
- Nicita R (2012) Lactobacillus rhamnosus ATCC27773 showed positive effect as probiotics for the treatment of functional dyspepsia. L’Integratore Nutrizionale® 15: 29-33.
- Hussain MA, Knight MI, Britz ML (2009) Proteomic analysis of lactose-starved Lactobacillus casei during stationary growth phase. J Appl Microbiol 106: 764-773.
- Lee JY, Pajarillo EAB, Kim MJ, Chae JP, Kang DK (2012) Proteomic and transcriptional analysis of Lactobacillus johnsonii PF01 during bile salt exposure by iTRAQ shotgun proteomics and quantitative RT-PCR. J Proteome Res 12: 432-443.
- Prasad J, McJarrow P, Gopal P (2003) Heat and osmotic stress responses of probiotic Lactobacillus rhamnosus HN001 (DR20) in relation to viability after drying. Appl Environ Microbiol 69: 917-925.
- Stanier R (1951) Enzymatic adaptation in bacteria. Ann Rev Microbiol 5: 35-56.
- Rault A, Bouix M, Beal C (2009) Fermentation pH Influences the physiological-state dynamics of Lactobacillus bulgaricus CFL1 during pH-controlled culture. App Environ Microbiol 75: 4374-4381.
- Deepika G, Karunakaran E, Hurley CR, Biggs CA, Charalampopoulos D (2012) Influence of fermentation conditions on the surface properties and adhesion of Lactobacillus rhamnosus GG. Microbiol Cell Fact 11: 116.
- Wu R, Zhang W, Sun T, Wu J, YueX, et al. (2011) Proteomic analysis of responses of a new probiotic bacterium Lactobacillus casei Zhang to low acid stress. Int J Food Microbiol 147: 181-187.