
Journal of Ocular Biology
Download PDF
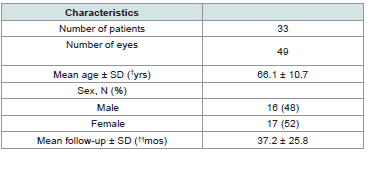 Table 1:Baseline demographic characteristics, means ± SD or N (%)
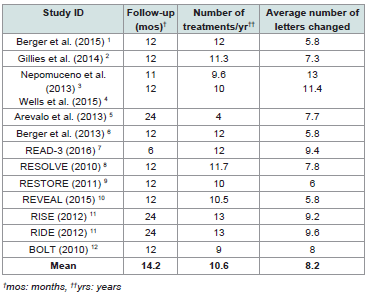 Table 2:Study characteristics of the trials considered as other studies
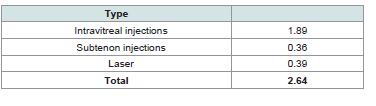 Table 3: Average Number of Treatments Per Year
 Table 4: Average Number of Letters Changed in the C-Data group
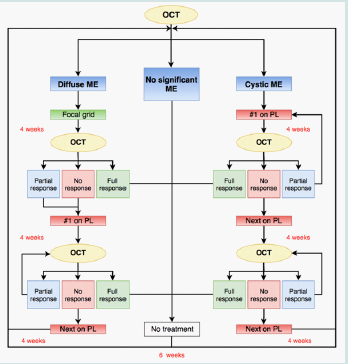 Figure 1:C-DATA Algorithm (PL= Preference List)
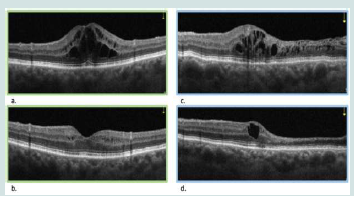 Figure 2: Optical coherence tomography (OCT) of a typical patient with full
response [Figure 2a. (top left) and 2b. (bottom left)] and a typical patient with
a partial response to treatment [Figure 3a. (top right) and 3d (bottom right].
Figure 2: Optical coherence tomography (OCT) of a typical patient with full
response [Figure 2a. (top left) and 2b. (bottom left)] and a typical patient with
a partial response to treatment [Figure 3a. (top right) and 3d (bottom right].
Baseline OCT Assessment
· Perform baseline optical coherence tomography (OCT) on all eyes.
· Classify into three categories: diffuse macular edema (ME), no significant ME, or cystic ME
Treatment Protocol Based on Baseline OCT
A. DME
a. Perform focal grid laser
b. Conduct follow-up OCT after 4 weeks
c. Assess response:
i. Full response: No additional treatment, reassess with OCT after 6 weeks
ii. Partial or no response: Proceed to first treatment on preference list, reassess with OCT after 4 weeks
B. No Significant ME
a. No treatment given
b. Reassess with OCT after 6 weeks
C. Cystic ME
a. Administer first treatment on preference list
b. Conduct follow-up OCT after 4 weeks
Follow-up Protocol
A. Second OCT (4 weeks after initial treatment)
a. Full response: No additional treatment, reassess with OCT after 6 weeks
b. Partial response:
i. For diffuse ME: Administer first treatment on preference list
ii. For cystic ME: Repeat first treatment on preference list
c. No response: Administer next treatment on preference list
d. Reassess with OCT after 4 weeks in all cases of partial or no response
B. Third OCT (4 weeks after second treatment, if applicable)
a. Full response: No additional treatment, reassess with OCT after 6 weeks
b. Partial response: Readminister same treatment, reassess with OCT after 4 weeks
c. No response: Administer next treatment on preference list, reassess with OCT after 4 weeks
Response Definitions: Full response: complete resolution of ME see (Figure 2a) (Figure 2b). Partial response: incomplete resolution of ME see (Figure 2c) (Figure 2d). No response: no significant change in ME
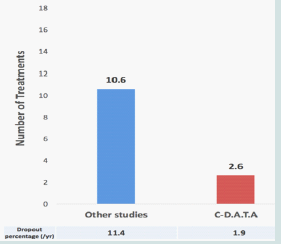 Figure 3: Follow-up period (in months) and change in best corrected visual
acuity (ΔV) in C-DATA patients compared to patients from other studies.
Figure 3: Follow-up period (in months) and change in best corrected visual
acuity (ΔV) in C-DATA patients compared to patients from other studies.
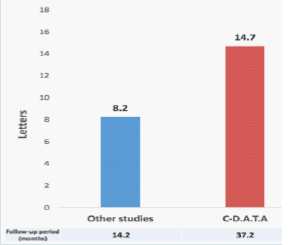 Figure 4:Dropout percentage per year (/yr) and difference in number of
treatments per year (N) in C-DATA patients compared to patients in other
studies.
Figure 4:Dropout percentage per year (/yr) and difference in number of
treatments per year (N) in C-DATA patients compared to patients in other
studies.
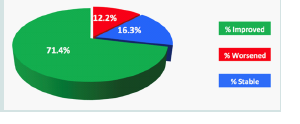 Figure 5: Percentage of eyes with improved (green color), worsened (red
color), and stable vision (blue color).
Figure 5: Percentage of eyes with improved (green color), worsened (red
color), and stable vision (blue color).
Research Article
Custom-Designed Approach to Treatment with Algorithms (C-DATA) for Diabetic Macular Edema
Yaghy A and Jabbour NM
1Department of Ophthalmology and Visual Sciences, University of
Massachusetts Chan Medical School, Worcester, MA, USA
2West Virginia University Eye Institute
3Mid-Atlantic Retina Consultations
4ForSight Foundation
2West Virginia University Eye Institute
3Mid-Atlantic Retina Consultations
4ForSight Foundation
*Address for Correspondence:Nabil M. Jabbour, Department of Ophthalmology, West Virginia University Eye Institute, USA. Email Id: nnjabbour@gmail.com
Submission: 26-April-2025
Accepted: 09-May-2025
Published: 12-May-2025
Copyright: © 2025 Yaghy A, et al. This is an open access article
distributed under the Creative Commons Attribution License, which
permits unrestricted use, distribution, and reproduction in any medium,
provided the original work is properly cited.
Keywords:Diabetic Macular Edema; Custom-Designed Treatment Algorithm
(C-DATA); Anti-VEGF Therapy; Intravitreal Injections; Personalized
Medicine
Abstract
Objective: To evaluate the efficacy of a custom-designed
approach to treatment with algorithms (C-DATA) for diabetic macular
edema (DME) compared to established published protocols.
Design: Prospective, comparative clinical study.
Subjects: 33 patients with DME, contributing to 49 distinct eyes treated.
Methods: Patients were treated according to the C-DATA algorithm, which guided the selection and timing of intravitreal injections, subtenon injections, and focal grid laser therapy based on individual patient characteristics and treatment responses. Comprehensive ophthalmic examinations, including Optical Coherence Tomography (OCT), were performed at each visit. Main Outcome Measures: Best-corrected visual acuity, treatment frequency, and patient dropout rate.
Results: Eyes treated with C-DATA showed a mean improvement of 14.7 letters over an average follow-up period of 37.2 months, compared to 8.2 letters for eyes treated with standard protocols. 71.4% of C-DATA-treated eyes improved, gaining an average of 22.14 letters. C-DATA required an average of 2.6 treatments per year, compared to 10.6 treatments per year for regimented protocols. The dropout rate for C-DATA was 1.9%, versus 11.4% for standard protocols.
Conclusions: The C-DATA approach for DME management demonstrated superior visual acuity outcomes, significantly reduced treatment burden, and enhanced patient compliance compared to traditional regimented protocols. These findings suggest that personalized, algorithm-based treatment strategies may optimize DME management and improve long-term patient outcomes.
Introduction
Diabetic macular edema (DME) is a common and potentially
sight-threatening complication of diabetic retinopathy that occurs
when fluid accumulates in the macula. If left untreated, DME can
lead to significant and sometimes irreversible reduction in visual
acuity, severely impacting a patient’s quality of life. The management
of DME has evolved significantly over the past few decades. In 1985,
the landmark Early Treatment Diabetic Retinopathy Study (ETDRS)
evaluated the role of focal grid laser therapy for clinically significant
DME and established it as the standard of care at the time. This
approach remained the primary treatment option for many years,
providing a foundation for DME management.[1]
However, the landscape of DME treatment changed dramatically
with the advent of anti-vascular endothelial growth factor (anti-
VEGF) therapies. These treatments, administered as intravitreal
(IV) injections, have revolutionized the management of DME.[2]
In addition to anti-VEGF agents, steroids have emerged as another
valuable therapeutic option. Administered either as intravitreal or
subtenon injections, steroids are particularly beneficial in cases of
anti-VEGF resistance and chronic DME. This multi-modal approach
to DME management and variable dosing regimens allow clinicians
to tailor treatment to individual patients’ needs and responses.
[3]
Traditionally, the administration of intravitreal injections and
laser treatments has been guided by protocols derived from major
multicenter clinical trials and/or subsequent modifications of these
protocols. While these standardized approaches have been valuable,
especially for clinical trials, they may not always account for the
heterogeneity of DME presentation and individual patient responses
to treatment. Notably, custom-designed, response-based algorithms
have not been previously developed, tested, or implemented on a
wide scale in DME management.
Given the variability in DME presentation and treatment
response, there is a clear need for more personalized treatment
strategies. This study aims to address this gap by developing and
evaluating a custom-designed approach to treatment with algorithms
(C-DATA) for DME. Our primary objective is to determine whether
this tailored approach can provide a more effective guide for treating
patients with DME compared to established published protocols. By
doing so, we hope to contribute to the ongoing effort to optimize
DME management and improve outcomes for patients affected by
this challenging condition.
Methods
This prospective study evaluated the efficacy of a custom designed
approach to treatment with algorithms (C-DATA) for
DME. All comers presenting with DME were treated based on the
C-DATA protocol. To ensure adequate follow-up and data collection,
only patients with a minimum of 8 continuous months of care and
follow-up were included in the final analysis. Study participation
was terminated when an intra-ocular procedure was performed, if a
significant ocular event occurred, or if a patient was lost to follow-up.
A total of 49 eyes from 33 patients met the above inclusion
criteria.Comprehensive ophthalmic examinations were performed at
each visit. These included Optical Coherence Tomography (OCT) to
assess retinal thickness and morphology, best-corrected visual acuity
measurement, intraocular pressure (IOP) measurement and anterior
segment examination.Vitreous and dilated retinal examinations
as well and fluorescein angiography (FA) were conducted when
clinically indicated.
Patients were treated according to the C-DATA algorithm
[Figure 1]. This algorithm guided the selection and timing of various
treatment modalities based on individual patient characteristics
and treatment responses. The available treatment options included
intravitreal (IV) injections of Bevacizumab (Avastin), Ranibizumab
(Lucentis), Aflibercept (Eylea), or Dexamethasone implant (Ozurdex);
subtenon (ST) injections of Dexamethasone or Triamcinolone;
and focal grid laser therapy. The C-DATA algorithm provided a
structured yet flexible approach to treatment selection, allowing for
personalized care based on each patient’s clinical presentation and
response to previous interventions.
Throughout the study, detailed records were maintained for
each patient, including OCT measurements, visual acuity scores,
treatment decisions, and any adverse events. These data were
systematically collected and analyzed to evaluate the efficacy of the
C-DATA approach compared to traditional treatment protocols.
Statistical analysis was performed using the `scipy.stats` module from
the SciPy library in Python 3. Comparison between pretreatment
Best Corrected Visual Acuity (BCVA) and posttreatment BCVA
at the end of follow-up period was performed using the paired
t-test. A p-value <0.05 was considered statistically significant.
The study was conducted in accordance with the Declaration of
Helsinki and approved by the institutional review board of the
West Virginia University Eye Institute. Informed consent was
obtained from all participants prior to their inclusion in the study.
Results
The study findings demonstrated a significant improvement in
visual acuity for eyes treated using the custom-designed approach
to treatment with algorithms (C-DATA) compared to those treated
with regimented protocols [4-12]. A total of 49 eyes from 33 patients
were included in the study. The mean age of participants was 66.1 ±
10.7 years, with a fairly even sex distribution of 16 males (48%) and
17 females (52%) [Table 1]. Eyes managed with C-DATA exhibited a
mean improvement of 14.7 letters over an average follow-up period
of 37.2 months (p<0.001). In contrast, eyes treated according to
standard regimented protocols showed a lesser improvement of 8.2
letters over the same mean follow-up period of 37.2 months. These
results are summarized in [Table 2] and visually represented in
[Figure 3]. A more detailed analysis of the C-DATA treatment
outcomes revealed that a substantial majority of treated eyes
experienced visual improvement and/or stabilization. Specifically,
71.4% of eyes managed with C-DATA showed enhanced vision, with
an average gain of 22.14 letters. A small proportion of eyes, 12.2%,
experienced a decline in vision, losing an average of 9.37 letters. The
remaining 16.3% of eyes maintained stable vision throughout the
follow-up period. These outcomes are presented in [Table 4] and
illustrated in [Figure 5]. The C-DATA approach also demonstrated
efficiency in terms of treatment frequency. Eyes managed using
this algorithm received an average of 2.6 treatments per year. This
annual treatment regimen typically consisted of 1.89 intravitreal
injections, 0.36 subtenon injections, and 0.39 laser treatments.
Notably, the dropout rate for patients treated with C-DATA was
remarkably low at 1.9%. These statistics are detailed in (Table 3) and
graphically represented in (Figure 4). In stark contrast, eyes treated
according to regimented protocols required a significantly higher
number of interventions, averaging 10.6 treatments per year. This
increased treatment burden was associated with a substantially higher
dropout rate of 11.4% for patients following standard protocols.
The comparative treatment frequencies and dropout rates between
C-DATA and regimented protocols are illustrated in [Figure 4].
Discussion
The findings of this study demonstrate the potential benefits of a
custom-designed approach to treatment with algorithms (C-DATA)
for DME compared to traditional regimented protocols. The results
suggest that C-DATA offers improved visual outcomes, reduced
treatment burden, and enhanced patient compliance.
A notable finding of this study is the improvement in visual
acuity achieved with C-DATA. Eyes treated using this approach
showed a mean improvement of 14.7 letters over an average followup
period of 37.2 months, compared to 8.2 letters for eyes treated
with standard protocols. This difference of 6.5 letters is significant,
potentially translating to meaningful improvements in patients’ daily
visual function and quality of life. Furthermore, the detailed analysis
of C-DATA outcomes reveals that a substantial majority (71.4%) of
treated eyes experienced visual improvement, with an impressive
average gain of 22.14 letters. This suggests that the personalized
approach of C-DATA may be more effective in addressing the
heterogeneous nature of DME and individual patient responses
to treatment [13]. An important benefit of C-DATA appears to be
its efficiency in terms of treatment frequency.The average of 2.6
treatments per year under C-DATA stands in stark contrast to the
10.6 treatments per year required by regimented protocols. This
fourfold reduction in treatment burden has significant implications
for both patients and healthcare systems. Fewer treatments mean
less disruption to patients’ lives, reduced risk of injection-related
complications, and potentially lower anxiety associated with frequent
medical procedures. The substantial reduction in treatment frequency
could also lead to significant cost savings and more efficient use of
healthcare resources. Perhaps most notably, the dramatically lower
dropout rate observed with C-DATA (1.9% vs. 11.4% for regimented
protocols) suggests that patients find this approach more manageable
Baseline OCT Assessment
· Perform baseline optical coherence tomography (OCT) on all eyes.
· Classify into three categories: diffuse macular edema (ME), no significant ME, or cystic ME
Treatment Protocol Based on Baseline OCT
A. DME
a. Perform focal grid laser
b. Conduct follow-up OCT after 4 weeks
c. Assess response:
i. Full response: No additional treatment, reassess with OCT after 6 weeks
ii. Partial or no response: Proceed to first treatment on preference list, reassess with OCT after 4 weeks
B. No Significant ME
a. No treatment given
b. Reassess with OCT after 6 weeks
C. Cystic ME
a. Administer first treatment on preference list
b. Conduct follow-up OCT after 4 weeks
Follow-up Protocol
A. Second OCT (4 weeks after initial treatment)
a. Full response: No additional treatment, reassess with OCT after 6 weeks
b. Partial response:
i. For diffuse ME: Administer first treatment on preference list
ii. For cystic ME: Repeat first treatment on preference list
c. No response: Administer next treatment on preference list
d. Reassess with OCT after 4 weeks in all cases of partial or no response
B. Third OCT (4 weeks after second treatment, if applicable)
a. Full response: No additional treatment, reassess with OCT after 6 weeks
b. Partial response: Readminister same treatment, reassess with OCT after 4 weeks
c. No response: Administer next treatment on preference list, reassess with OCT after 4 weeks
Response Definitions: Full response: complete resolution of ME see (Figure 2a) (Figure 2b). Partial response: incomplete resolution of ME see (Figure 2c) (Figure 2d). No response: no significant change in ME
and are more likely to comply with their course of treatment. This
improved compliance is crucial for long-term management of a
chronic condition like DME.
The success of C-DATA in this study challenges the one-sizefits-
all approach often employed in DME management and other
protocol-based studies [13]. By allowing for a more nuanced,
responsive treatment strategy, C-DATA appears to optimize the use
of available therapies (intravitreal injections, subtenon injections, and
laser treatments) based on individual patient needs and responses.
This personalized approach aligns with the broader trend towards
precision medicine in healthcare. For DME, a condition known for
its variability in presentation and treatment response, such tailored
strategies are, therefore, particularly beneficial.
While these results are promising, it’s important to acknowledge
potential limitations of the study. The sample size, while sufficient to
demonstrate significant differences, is relatively small. Larger, multicenter
studies would be valuable to confirm these findings and explore
their generalizability across diverse patient populations. Additionally,
longer-term follow-up could provide insights into the durability
of visual gains and the long-term safety profile of the C-DATA
approach. This study was concluded before some newer VEGFs were
introduced, but it is very easy to incorporate any new treatment into
C-DATA, because it is a strategy (approach) not a treatment. Future
research might also explore the potential of integrating advanced
imaging technologies or artificial intelligence to further refine and
personalize treatment algorithms.
Conclusion
The C-DATA approach represents a promising advancement in
the management of DME. By offering improved visual outcomes,
reduced treatment burden, and enhanced patient compliance,
it addresses several key challenges in current DME care. As we
continue to seek ways to optimize outcomes for patients with this
complex condition, the principles of personalized, responsive
treatment exemplified by C-DATA may well shape the future of
DME management. The promising results of C-DATA in DME
management have prompted its application to other medical
conditions. Currently, we are evaluating the efficacy of this
algorithmic approach in the treatment of wet age-related macular
degeneration (AMD), with data collection ongoing and publication
of results anticipated in the near future. Other applications of the
C-DATA concept have also been explored in non-ophthalmic fields
[13]. This expansion of C-DATA to diverse medical conditions shows
its potential as a versatile and adaptable framework for personalized
treatment across various specialties, extending well beyond
ophthalmology.
References
Citation
Yaghy A, Jabbour NM. Custom-Designed Approach to Treatment with Algorithms (C-DATA) for Diabetic Macular Edema. J Ocular Biol. 2025; 9(1): 1.