Journal of Forensic Investigation
Download PDF
Research Article
*Corresponding author: Bobbie-Jo M. Webb-Robertson, Computational Biology & Bioinformatics, Pacific Northwest National Laboratory, 902 Battelle Blvd, J4-33 Richland, WA, 99352, USA, Tel: +1 509 375-2292; Fax: +1 509 372-4720; E-mail: david.grubb@med.lu.se
Citation: Webb-Robertson BJ, Corley CD, McCue LA, Clowers BH, Dowling CP, et al. Forensic Signature Detection of Yersinia pestis Culturing Practices across Institutions Using a Bayesian Network. J Forensic Investigation. 2014;2(1): 7.
Copyright © 2014 Webb-Robertson BM, et al. This is an open access article distributed under the Creative Commons Attribution License, which permits unrestricted use,distribution, and reproduction in any medium, provided the original work is properly cited.
Journal of Forensic Investigation | ISSN: 2330-0396 | Volume: 2, Issue: 1
Submission: 03 February 2014| Accepted: 18 March 2014| Published: 21 March 2014

The following sections describe the experimental and textual components of the networks used to generate the conditional models in Eq. 1.Y. pestis laboratory data
Forensic Signature Detection of Yersinia pestis Culturing Practices across Institutions Using a Bayesian Network
Bobbie-Jo M. Webb-Robertson1*, Courtney D. Corley2, Lee Ann McCue1, Brian H. Clowers3, Chase P. Dowling2, Karen L. Wahl3, David S. Wunschel3 and Helen W. Kreuzer3
- 1Computational Biology & Bioinformatics, Pacific Northwest National Laboratory, 902 Battelle Blvd, J4-33 Richland, WA, 99352, USA
- 2Knowledge Discovery and Informatics, Pacific Northwest National Laboratory, 902 Battelle Blvd, K7-38Richland, WA, 99352, USA
- 3Chemical and Biological Signature Science, Pacific Northwest National Laboratory, 902 Battelle Blvd, P7-50, Richland, WA, 99352, USA
*Corresponding author: Bobbie-Jo M. Webb-Robertson, Computational Biology & Bioinformatics, Pacific Northwest National Laboratory, 902 Battelle Blvd, J4-33 Richland, WA, 99352, USA, Tel: +1 509 375-2292; Fax: +1 509 372-4720; E-mail: david.grubb@med.lu.se
Citation: Webb-Robertson BJ, Corley CD, McCue LA, Clowers BH, Dowling CP, et al. Forensic Signature Detection of Yersinia pestis Culturing Practices across Institutions Using a Bayesian Network. J Forensic Investigation. 2014;2(1): 7.
Copyright © 2014 Webb-Robertson BM, et al. This is an open access article distributed under the Creative Commons Attribution License, which permits unrestricted use,distribution, and reproduction in any medium, provided the original work is properly cited.
Journal of Forensic Investigation | ISSN: 2330-0396 | Volume: 2, Issue: 1
Submission: 03 February 2014| Accepted: 18 March 2014| Published: 21 March 2014
Abstract
The field of bioforensics is focused on the analysis of evidence from a biocrime. Existing laboratory analyses can identify the specific strain of an organism, as well signatures of the specific culture batch of organisms, such as low-frequency contaminants or indicators of growth and processing methods. To link these disparate types of physical data to potential suspects, investigators may need to identify institutions or individuals whose access to strains and culturing practices match those identified from the evidence. In this work, we present a Bayesian statistical network to fuse different types of analytical measurements that predict the production environment of a Yersinia pestis (Y. pestis) sample under investigation with automated text processing of scientific publications to identify institutions with a history of growing Y. pestis under similar conditions. Furthermore, the textual and experimental signatures were evaluated recursively to determine the overall sensitivity of the network across all levels of false positives. We illustrate that institutions associated with several specific culturing practices can be accurately selected based on the experimental signature from only a few analytical measurements. These findings demonstrate that similar Bayesian networks can be generated generically for many organisms of interest and their deployment is not prohibitive due to either computational or experimental factors.Keywords
Bayesian Networks; Bioforensics; Fusion; Integration; Intelligence; ProbabilityIntroduction
Investigative chemical or biological forensic programs focus on the identification of a threat agent and the interpretation of intelligence data to identify sources of information to ultimately solve a crime. Specifically, for biological forensics the investigators typically focus on characterization of the specific biological agent used to perpetrate the crime, using analytical measurements from various instruments. The data obtained from these instruments yield features that, when integrated, create signatures indicative of the agent’s identity and various aspects of how the agent was produced [1-3]. However, these instrument-driven analyses of the sample do not make a connection directly between the forensic signature and the potential source of the agent (i.e., suspect), although in some cases they might point to a region or institution [4,5]. It remains a challenge to link physical and genetic signatures to non-traditional sources of information to identify who and where the relevant source materials, equipment, and training exist to produce the sample.The value of Bayesian networks to assist in investigations has been well established in the chemical and biological forensics fields [5-11]. Our previous work developed an automated Bayesian network framework to fuse the results of laboratory measurements with textual data associated with institutional capabilities to grow a specific organism under specific conditions [5]. The premise of our model is that scientists at these institutions make public, often through formal publication, their routine culturing practices, such as the types of materials they work with and how they use them. The physical and genetic characteristics of evidence recovered from a biocrime can be compared to these published research practices to point to institutions or research groups that use similar methods. Further investigation of individuals who learned culturing practices from these groups could lead to potential suspects. To date, the fusion of mass spectral data (E) collected on spores of Bacillus anthracis and textual data from the scientific literature has been demonstrated as a predictive method to obtain the probability that a specific institution (I) could produce a specific sample given the data (E): P(I|E). The Bayesian network is framed as layers of conditionally independent levels of information, which allows the direct prediction of institution from experimental evidence where traditional classification-based approaches would not work.
In this work, we extend the investigative forensics Bayesian network to a new model organism, Yersinia pestis (Y. pestis). We also systematically evaluate the contribution of specific features at the mass spectral (e.g., carbohydrates) and textual levels (e.g., keywords) to determine the network’s sensitivity to changes in the text and experimental data signatures. These series of investigations demonstrate that this approach to data fusion for investigative forensics can be applied with relatively good accuracy using a small set of features from the textual and mass spectral data that capture key components of separation between the culturing practices.
Material and Methods
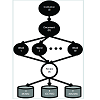
The Bayesian network to fuse the experimental and textual data for Y. pestis is depicted in Figure 1 and computed in a manner analogous to that previously reported for Bacillus anthracis [5]. The experimental and textual nodes are modeled as independent. Although this assumption may not hold completely, it has been shown that assuming independence does not typically dramatically affect the classification accuracy of Naïve Bayesian classifiers [10-12]. Using standard Bayesian statistical properties of conditional independence between the layers of the network, the probability of a specific institution (I) having a demonstrated history of organism culturing that matches a sample, based on the observed experimental data using isotope ratio mass spectrometry (IRMS), gas chromatography mass spectrometry (GC-MS), and liquid chromatography tandem mass spectrometry (MS/MS), E(I), E(G), and E(M), respectively, is:
The following sections describe the experimental and textual components of the networks used to generate the conditional models in Eq. 1.Y. pestis laboratory data
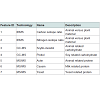
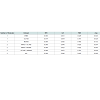
To evaluate the capability of a series of analytical measurements to characterize culture media used to produce Y. pestis, a series of experiments was executed on the attenuated strain KIM D1 (lcr-) cultured in three common medium formulations: tryptic soy broth (TSB), brain-heart infusion (BHI) and Luria-Bertani broth (LB). TSB typically contains hydrolysate of soy, hydrolysate of casein, and glucose. BHI commonly contains infusion of organs, meat protein hydrolysate, and glucose. LB combines hydrolysate of casein with yeast extract. Specifics of the bacterial strain, biosafety, medium formulations, and microbial growth conditions are described in Clowers et al. [13]. Cells were collected by centrifugation and the cell pellet from an individual culture constituted a sample. Triplicate cultures were produced in each formulation of growth medium, and from three to six different formulations of each growth medium were tested; thus, 9 – 18 samples produced on each growth medium were analyzed. Three types of analyses were performed and methods are described below: 1) Carbohydrate profiles were generated by gas-chromatography-mass spectrometry (GC-MS). 2) Stable isotope ratios of C and N were determined by isotope ratio mass spectrometry (IRMS). 3) Finally, peptides from the growth medium that remained associated with the cellular biomass were analyzed by liquid chromatography-tandem mass spectrometry (MS/MS). Table 1 outlines the specific features that were extracted from the larger data sets produced by each type of instrument and components of the culturing medium that are expected to be differentiated by these features.
Isotope ratio mass spectrometry: C and N stable isotope ratios were determined as previously described [14] using a Thermo- Finnegan (Bremen, Germany) Delta V Plus IRMS coupled to a Costech Analytical Technologies (Valencia, CA, USA) 4010 Elemental Analyzer and Zero-Blank Autosampler. 700 μg±10%, was weighed into a tin capsule (Costech Analytical Technologies) and introduced into the instrument via an autosampler. Each sample was analyzed in triplicate. Stable isotope content is measured as a ratio, R (13C/12 C or 15N/14N), and reported as a delta (δ) value where δ = δ (RA/Rstd- 1)* 1000‰ and RA and RStd are the isotope ratios of the sample and an internationally recognized standard, respectively.
The standard for C is Vienna PeeDeeBemnite and for N, air [15,16]. IRMS processing was completed for 12cultures of TSB, BHI, and LB each. For the purposes of generating conditional probability matrices for the Bayesian network, the C and N stable isotope ratios were binned into six specific regions wherfe C could be greater than -21.5, less than -24.5, or in between, and N could be greater or less than 3.8. Thus, the conditional probability of observing a specific IRMS state(E(I)) given one of the three culture recipes (R) was computed directly from these data: P(E(1)|R).
GC-MS: GC-MS processing of the samples followed standard protocols as described in Colburn et al. [17]. GC-MS data was examined for retention time and electron impact mass spectra matching a list of 18 standard carbohydrates (analyzed separately). GC-MS processing was completed for nine replicates of BHI and LB and 18 replicates of TSB. Two specific carbohydrates, scyllo-inositol and pinitol, were marked as present or absent for each sample (Table 1); therefore, there were four possible carbohydrate states that could be associated with a sample. Thus, the probability of observing a specific GC-MS state (E(G)) given R was computed directly from these data: P(E(G)|R).
The subject can either exhale directly into the inlet of the analyser or through a mouthpiece which can be connected to the inlet. The mouthpiece consists of a plastic tube with a length of 60 mm, an outer diameter of 18 mm and an inner diameter of 16 mm.
MS/MS: MS/MS processing of the samples followed standard protocols as described in Clowers et al. [13] on an Orbitrap XL mass spectrometer (Thermo-Fisher Scientific) with a mass resolution setting of 30,000 [13]. Datasets were screened against a database composed of the nonredundant proteomes for the organisms expected to be found in microbial growth media, such as cow, pig, soy, wheat, rice, and yeast (http://www.Uniprot.org). Three categories of proteins that cover the distinctions of the three growth media were selected, including actin, casein, and yeast proteins (Table 1). Again, nine replicates of BHI and LB and 18 replicates of TSB were analyzed. In particular, if a peptide from one of the defined proteins was observed, then the associated protein category was defined to be present. Thus, three specific protein classes were marked as present or absent for each sample yielding eightpossible states. The probability of observing a specific MSMS-MS state (E(M)) given R was computed directly from these data: P(E(M)|R).
Y. pestis textual data
Y. pestis was linked to institutions through the manual annotation of a large collection of relevant documents. A total of 1,491 publications associated with Y.pestis were identified by querying PubMed (http:// www.ncbi.nlm.nih.gov/pubmed) for journal articles under the medical subject heading “Yersinia pestis” published between 1-Jan 2010 and 2-Feb 2012. Of the 1,491 documents, the full texts of 382 were not available. Therefore, 1,109 publications were manually curated to identify the culturing practice(s). For each of the full text articles, the title, authors, institutions, abstract and material and methods were extracted. Next, we manually annotated these documents with the culture medium, its brand, and the strain of Y. pestis, referring back to the original document if necessary. The process is described in detail in Webb-Robertson et al. [5]. Of the 1,109, only 303 could be associated with one or more of the three primary culture media (BHI, LB and TSB) we evaluated via experimentation.
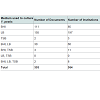
To meet the constraints of the laboratory data, we created textbased signatures (see Table 2) that describe using the growth media TSB, BHI, and/or LB to culture Y. pestis across the 303 publications. Culture media were then linked to institutions through a series of independent random variables associated with 1) the presence of keywords within a given document’s abstract or material and methods sections, 2) the association of a culture medium with the keywords in each document, and 3) the document linked to one or more institutions. Table 3 lists the culture media used across the 303 documents and defines the distribution of the 364 institutions associated with these documents. The probability of observing a culture medium recipe R given a document (D) was computed by the product of the conditional probability of observing R given each keyword. In total, 19 keywords were identified with adequate prevalence for inclusion in the model (Table 4). As was previously done, keywords are treated independently:
Where P(wk|D) is 1 if word k is in the document and 0 otherwise, and P(R|wk) is the normalized frequency of the number of times keywordk is observed in a specific culturing recipe.
Accuracy metrics and feature selection
To obtain a robust measure of accuracy, the final probability for each institution must be generated in a fashion that is independent from the training phase of the network. Because the final goal of this analysis was to determine the feasibility of triaging institutions capable of generating a sample based on experimental evidence, cross-validation procedures were performed at the institution level.The final metrics of accuracy were based on a Receiver Operating Characteristic (ROC) curve and the associated area under this curve (AUC). The ROC curve yields a visual comparison of true positive rate (TPR) across the full range of possible false positives (FPR), 0 to 1 [18]. A perfect classifier will find all true positives at a zero FPR and therefore results in an AUC of 1.0, while a random classifier will yield an AUC of 0.5. We performed repeated 5-fold cross-validation at the institution level for each of the three culture media to obtain an average metric of accuracy [19]. Specifically, each culture medium was evaluated 100 times, where the experimental data were selected via sampling in proportion to the observed data and 5-fold crossvalidation was performed. For each of the five-folds, the ROC curve (FPR and associated TPR values) was saved and these averaged to a single ROC curve associated with that iteration. This process was repeated 100 times for the various states of experimental data associated with the culture recipe medium of interest, and the final answer was reported as an average ROC curve, which captures the variability due to various possible experimental data states for the culturing and separations into 5-fold cross-validation sets. The final AUC was computed from this average AUC using the standard triangle rule.
Feature selection was performed using Recursive Feature Elimination (RFE) [20,21]. RFE is an iterative process that identifies features that can be removed sequentially, thereby reducing the overall accuracy of the model by the least amount. Using the Y. pestis textual data, we began with 19 features. These 19 variables were removed one at a time from the model, and the AUC values for each culture media and the average across all culture media were evaluated. Of the 19 average AUC values, the feature corresponding to a maximum average AUC was removed from the model, meaning its removal had the lowest effect on the accuracy of the model. This process was then repeated on the 18 remaining features.
Results and Discussion
The Bayesian network was evaluated for how accurately it could identify institutions that have a history of growing Y. pestis in a manner consistent with data matching a defined growth condition. Furthermore, the textual and experimental components of the network have various positive and negative effects on this accuracy, which are not known a priori. Each culture type was evaluated using a ROC analysis. In particular, for each culture medium, data were simulated to match the culturing practices and then run through the Bayesian network using 5-fold cross-validation (CV) on the document-level data to attain the probability of observing each institution given the three data types (E(I), E(G), E(M)). Those institutions that are associated with the selected culturing practice (Table 3) are assigned as true positives. Finally, using the probability, a ROC curve value and an AUC value are attained. To assure that the AUC value is robust to the CV performed at the document stage, the full procedure is repeated 100 times and the average AUC is reported.This exercise resulted in an average AUC of 0.889, 0.832, and 0.809 for BHI, LB, and TSB respectively. The results, based upon the 19 keywords shown in Table 2 and the seven experimental features in Table 1], were very promising for all three culturing practices. There is likely redundancy in the keywords that can reduce this signature; furthermore, the seven experimental features are based upon three independent assays. The identification of the most relevant experimental features would be beneficial in respect to the time required to obtain that data, as well as to identify which assays would be most relevant when the sample limited. We first evaluated the impact of specific keywords as given in [Table 2] on the accuracy of identifying institutions for both individual media and the average across the three media formulations. Subsequently, in a similar iterative fashion, we evaluated each of the seven experimental features associated with the three technologies.
Sensitivity of network based on keywords
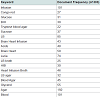
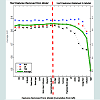
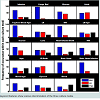
RFE was used to identify a core set of keywords that worked well in combination for all three culture media. Figure 2 displays the results for each RFE iteration where removal of nine features resulted in the maximum average AUC. Overall, the average accuracy increased from ~0.84 to ~0.86 with the 10 keyword model versus the full 19 keywords. Although accuracy did not increase dramatically, removing these keywords did result in the ability to achieve the same or higher accuracy with approximately one-half of the starting keyword set. [Figure 3 ]shows bar graphs of the frequency of each keyword in respect to the three cultures. They are ordered based upon the order of the RFE where the single most predictive keyword is first and so forth. For example, “agar” is the last keyword to be removed by RFE and is therefore identified as highly significant for the identification of documents that separate by culture medium. The second to last model includes “infusion” and “Congo red.” The features are continually ordered in this manner for the isualization in Figure 3. Many of the features in the bottom nine that were removed appear to be highly similar to those retained above in the top 10. RFE offered a statistical approach to identify these redundancies and determine the specific keywords to maintain in the model.
Sensitivity of network based analytical measurements
For usability, a Bayesian model that requires as little experimental data as possible to start an investigation would be highly beneficial. [ Table 4] gives the AUC values across the three culture media when using one or more of the IRMS, GC-MS, and MS/MS datasets. As seen in [ Table 4], none of the datasets alone or in combination offer accuracy as high as the full model, but some, such as IRMS+GCMS, are nearly as accurate. This result was expected because all three datasets yield some metrics of separating animal and plant materials. RFE was again employed across the seven distinct features to identify a minimum set to separate BHI, LB, and TSB with the same or better accuracy than the full model of 19 keywords and three datasets (seven experiment features).
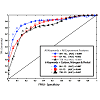
RFE found that only the carbon isotope ratio (measured by IRMS), which generically separates animal from plant material, could predict all three culture media fairly well. Adding nitrogen from IRMS and Pinitol from GC-MS resulted in the maximum average classification accuracy. Again, the nitrogen isotope ratio separates plant from animal material [ Table 1] and Pintol is a soy-related carbohydrate. These three components cover the spectrum of the three culturing practices used in this experiment (BHI, LB, and TSB). Similar to the keyword analysis, we are able to achieve the same or higher accuracy with less than one-half of the originating experimental features, as shown in [ Table 5]. [ Figure 4] shows a comparison of the average ROC curves of the models when using the full collection of information available (19 keywords and seven experimental features) versus the RFE-base model identified (10 key-words and three experimental features). Based on a Wilcoxon sign rank test, the pre- and post-RFE models are not statistically different. However, LB and TSB both have an increase in average AUC, which is statistically significant with ap-value less than 1e-3.
Conclusions
Narrowing the potential sources of a biological sample in a statistically robust fashion would be highly beneficial to investigative forensics [1,22]. The general method presented here moves beyond existing Bayesian networks focused on identifying specific characteristics of a sample to linking that knowledge to soft forms of data that can lead an investigation towards a suspect. The study conducted here on Y. pestis demonstrated that a limited number of culture media are generally used to produce a specific organism and several straight forward analytical measurements can identify useful experimental signatures of that media. Furthermore, the link from experimental data to institution can be achieved by scanning the scientific literature for a small set of specific keywords. The combination of these two findings demonstrates that in practice, a Bayesian network can both rapidly and accurately (in many cases) identifies the institutions with a history of growing Y. pestis in a manner consistent with the experimental evidence. Manual exploration of the 364 institutions included in this study would be time prohibitive. Our study did not include features of the organism; thus we did not attempt to narrow the publication search terms for organism beyond genus and species. Identification of the organism at the strain level, such as was performed during the Amerithrax investigation where the agent was determined to have been Bacillus anthracis Ames, would presumably decrease the number of publications and institutions initially associated with a sample. The Bayesian network targeted at investigative forensics would further reduce the list of those institutions that may have relevant information and yield a quantitative probability measure to guide the investigation.Acknowledgements
This work was supported by Laboratory Directed Research and Development funding through the National Security Directorate and the Signature Discovery Initiative at Pacific Northwest National Laboratory (PNNL). PNNL is a multiprogramming national laboratory operated by Battelle for the United States Department of Energy under contract DE-AC06-76RL01830.References
- Budowle B, SE Schutzer, A Einsein, LC Kelley, AC Walsh, et al. (2003) Public health. Building Microbial Forensics as a Response to Bioterrorism. Science 301: 1852-1853.
- Fraga CG, GA Perez Acosta, MD Crenshaw, K Wallace, GM Mong, et al. (2011) Impurity Profiling to Match a Nerve Agent to Its Precursor Source for Chemical Forensics Applications. Anal Chem 83: 9564-9572.
- Murch RS (2003) Microbial forensics: Building a National Capacity toInvestigate Bioterrorism. Biosecur Bioterror 1: 117-122.
- Ehleringer JR, GJ Bowen, LA Chesson, AG West, DW Podlesak, et al. (2008) Hydrogen and Oxygen Isotope Ratios in Human Hair Are Related to Geography. Proc Natl Acad Sci USA 105: 2788-2793.
- Webb-Robertson BJ, C Corley, LA McCue, K Wahl, H Kreuzer, (2013) Fusion of Laboratory and Textual Data for Investigative Bioforensics. Forensic Sci Int 226: 118-124.
- Garbolino P, F Taroni (2002) Evaluation of Scientific Evidence Using Bayesian Networks. Forensic Sci Int 125: 149-155.
- Gittelson S, A Biedermann, S Bozza, F Taroni (2012) Bayesian Networks and the Value of the Evidence for the Forensic Two-Trace Transfer Problem. J Forensic Sci 57: 1199-1216.
- Jarman KH, HW Kreuzer-Martin, DS Wunschel, NB Valentine, JB Cliff, et al. (2008) Bayesian-Integrated Microbial Forensics. Appl Environ Microbiol 74: 3573-3582.
- Taroni F, A Biedermann, P Garbolino, CGG Aitken, (2004) A General Approach to Bayesian Networks for the Interpretation of Evidence. Forensic Sci Int 139: 5-16.
- Webb-Robertson BJ, H Kreuzer, G Hart, J Ehleringen, J West, et al. (2012)Bayesian Integration of Isotope Ratio for Geographic Sourcing of Castor Beans. J Biomed Biotechnol : 450967.
- Webb-Robertson BJ, LA McCue, N Beagley, JE McDermott, DS Wunschel, et al. (2009) A Bayesian Integration Model of High-Throughput Proteomics and Metabolomics Data for Improved Early Detection of Microbial Infections. Pac Symp Biocomput 451-463.
- Hilden J (1984) Statistical Diagnosis Based on Conditional Independence Does Not Require It. Comput Biol Med 14: 429-435.
- Clowers BH, DS Wunschel, HW Kreuzer, HE Engelmann, N Valentine, et al. (2013) Characterization of Residual Medium Peptides from Yersinia pestis Cultures. Anal Chem 85: 3933-3939.
- Kreuzer H, LA Chesson, MJ Lott, JV Dongan, JR Ehleringer (2004) Stable Isotope Ratios as a Tool in Microbial Forensics, Part 1. Microbial Isotopic Composition as a Function of Growth Medium. J Forensic Sci 49: 954-960.
- Coplen TB (1996) New Guidelines for Reporting Stable Hydrogen, Carbon and Oxygen Isotope-Ratio Data. Geochimica et Cosmochimica Acta 60:3359-3360.
- Groning M, K Frohlich (1999) Intended Use of the IAEA Reference Materials. Part II: Examples on Reference Materials Certified for Stable Isotope Composition. International Atomic Energy reference 21. Royal Society of Chemistry 238.
- Colburn HA, DS Wunschel, KC Antolick, AM Melville, NB Valentine (2011) The Effect of Growth Medium on B. anthracis Sterne Spore Carbohydrate Content. J Microbiol Methods 85: 183-189.
- Lasko TA, JG Bhagwat, KH Zou, L Ohno-Machado (2005) The Use of Receiver Operating Characteristic Curves in Biomedical Informatics. J Biomed Inform 38: 404-415.
- Kim JH (2009) Estimating Classification Error Rate: Repeated Cross- Validation, Repeated Hold-Out and Bootstrap. Comput Stat & Data Anal 53: 3735-3745.
- Zhang X, X Lu, Q Shi, X Xu, HE Leung, et al. (2006) Recursive SVM Feature Selection and Sample Classification for Mass-Spectrometry and Microarray Data. BMC Bioinformatics 7: 197.
- Guyon I, J Weston, S Barnhill, V Vapnik (2002 ) Gene Selection for Cancer Classification Using Support Vector Machines. Mach Learning 46: 389-422.
- Kreuzer-Martin HW, MJ Lott, J Dorigan, JR Ehleringer (2003) MicrobeForensics: Oxygen and Hydrogen Stable Isotope Ratios in Bacillus Subtilis Cells And Spores. Proc Natl Acad Sci USA 100: 815-819.


