
Journal of Bioanalysis & Biostatistics
Download PDF
Research Article
*Address for Correspondence: Yohan Yoon, Department of Food and Nutrition, Sookmyung Women’s University, Seoul 140-742, Korea, Tel: +82-2-2077-7585; Fax: +82-2-710-9479;, E-mail: yyoon@sookmyung.ac.kr
Citation: Ha J, Kim WI, Ryu JG, Lee J, Kim S, et al. A Dynamic Model for Toxin-Producing Bacteria on Tomatoes. J Bioanal Biostat 2015;1(1): 4
Copyright © 2015 Ha J, et al. This is an open access article distributed under the Creative Commons Attribution License, which permits unrestricted use, distribution, and reproduction in any medium, provided the original work is properly cited.
Journal of Bioanalysis and Biostatistics | Volume: 1, Issue: 1
Submission: 31 July 2015 | Accepted: 14 August 2015 | Published: 20 August 2015
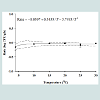
 Our results indicate that even if S. aureus contaminates a tomato, the pathogen did not grow, while B. cereus is quickly inactivated. Although no significant S. aureus growth was observed at all storage temperatures, a secondary model was necessary for the development of a dynamic model. The effect of temperature on death rate could be described by an inverse second order polynomial model. Our results showed that temperature had no significant effect on death rate (Figure 1). To evaluate the performance of the models, S. aureus cell counts at 12, 18, and 23 °C were conducted but not used in the development of the model. The observed S. aureus cell counts were compared with those predicted by the combined primary and secondary models at the given temperatures. To evaluate model performance, many researchers have used accuracy (A) and bias (B) factors. However, it has been pointed out that A and B factors have significant limitations and can result in the incorrect evaluation of model performance. In the current study, we calculated RMSE to evaluate performance. The RMSE values were around 0.55, indicating that the developed model was appropriate. For fluctuating temperatures, S. aureus cell counts were predicted and the values compared with experimental values. The observed S. aureus cell counts were lower than the predicted values by approximately 1 log CFU/g (Figure 2). This result indicates that our model slightly overestimates under dynamic temperature conditions. A predictive model for B. cereus was not developed because the bacterial cell counts were below detection limit after 3 h (Figure 3).
A Dynamic Model for Toxin- Producing Bacteria on Tomatoes
Jimyeong Ha1, Won-Il Kim2, Jae-Gee Ryu2, Jeeyeon Lee1,Sejeong Kim1, Heeyoung Lee1, Soomin Lee1 and Yohan Yoon1*
- 1Department of Food and Nutrition, Sookmyung Women’s University, Seoul 140-742, Korea
- 2Microbial Safety Team, Agro-Food Safety & Crop Protection Department, National Academy of Agricultural Science, Rural Development Administration, Wanju 565-851, Korea
*Address for Correspondence: Yohan Yoon, Department of Food and Nutrition, Sookmyung Women’s University, Seoul 140-742, Korea, Tel: +82-2-2077-7585; Fax: +82-2-710-9479;, E-mail: yyoon@sookmyung.ac.kr
Citation: Ha J, Kim WI, Ryu JG, Lee J, Kim S, et al. A Dynamic Model for Toxin-Producing Bacteria on Tomatoes. J Bioanal Biostat 2015;1(1): 4
Copyright © 2015 Ha J, et al. This is an open access article distributed under the Creative Commons Attribution License, which permits unrestricted use, distribution, and reproduction in any medium, provided the original work is properly cited.
Journal of Bioanalysis and Biostatistics | Volume: 1, Issue: 1
Submission: 31 July 2015 | Accepted: 14 August 2015 | Published: 20 August 2015
Abstract
We developed a dynamic model to determine the growth patterns of toxin-producing bacteria on tomatoes during their storage and distribution. Dynamic temperature profiles were also recorded while tomatoes were stored, and during their distribution to three cities. Tomatoes were inoculated with Staphylococcus aureus and Bacillus cereus, and the bacterial cell counts were then enumerated. The Baranyi model was fitted to the cell counts to calculate death rate and lag phase duration (LPD). These parameters were then fitted to a second order polynomial in the inverse temperature to evaluate the effects of temperature fluctuations. The developed model was validated with observed values, and the root mean square error (RMSE) was calculated. A dynamic model was then developed with the results of the secondary model, and S. aureus growth patterns were simulated. Death rates of S. aureus ranged from −0.157 to −0.024 log CFU/g/h, depending on the storage temperature. No difference in the death rates was observed among storage temperatures, and LPD was not observed for all storage temperatures. The model performance was appropriate with 0.55 of RMSE. B. cereus cell counts decreased rapidly and thus, predictive model was not developed. In conclusion, S. aureus cell counts on tomatoes may not be changed at ≥10 °C, but B. cereus cannot survive on the produce. In addition, the developed model should be appropriated to describe the fate of S. aureus on tomato.Keywords
Staphylococcus aureus; Bacillus cereus; Tomato; Dynamic modelIntroduction
Tomatoes are widely consumed across the world [1]. When tomatoes are left at room temperature for a prolonged period, there is an increased risk of their contamination with pathogens [2]. There were also reports related to the identification of pathogenic bacteria on tomatoes [3]. Therefore microbiological management is necessary, especially for toxin-producing bacteria.The bacteria Staphylococcus aureus and Bacillus cereus are associated with major food-borne illnesses [4]. Gram-positive S. aureus is known to produce harmful toxins [5], and can grow at pH 4.5–9.3 with an Aw in excess of 0.83, and a sodium chloride concentration up to 20% [6]. Therefore, S. aureus is prevalent in a wide variety of foods [7]. In addition, S. aureus on worker’s hands might be transferred to tomatoes during harvesting and packaging. Grampositive B. cereus is a spore-forming, toxin-producing bacterium [8]. This pathogen is widely distributed in nature and found in various foods. It is also known to cause food-borne illnesses in humans associated with vomiting and diarrhea [9]. The spread of B. cereus is facilitated by spores, while the toxin it produces is responsible for illness. B. cereus can be grown at pH 4.3–9.3 and even in low moisture such as 0.91 of Aw [10,11]. Also, vegetative cells and spores of B. cereus can be cross-contaminated to tomatoes from soil.
Predictive microbiology is useful in studying and predicting the growth and death of microorganisms by using mathematical equations [12]. The purpose of predictive microbiology is to ensure food safety in advance, allowing stakeholders to address all possible risk factors in advance [13]. Most predictive models have been developed for constant temperatures, with environmental changes, such as temperature and humidity, during food distribution not usually considered. The development of a dynamic model using primary and secondary models is considered appropriate to describe the fate of bacteria in changing environments.
The objective of our study was to develop a dynamic model of toxin-producing S. aureus and B. cereus on tomatoes and predict their behavior.
Materials and Methods
Preparation of inocula
Considering strain variation, five-strain mixtures for S. aureus and B. cereus were prepared as inocula as follows. Five S. aureus strains [ATCC13565 (SEA; staphylococcal enterotoxin A), ATCC14458 (SEB), ATCC23235 (SED), ATCC27664 (SEE), and NCCP10826 (SEC)] and five B. cereus strains (KCTC1013, KCTC1014, KCTC1092, KCTC1094, and KCTC3624) were cultured in 10 ml of tryptic soy broth (TSB; Becton, Dickinson and Company, Sparks, MD, USA) at 35 °C for 24 h. Aliquots (0.1 ml) of cultures were transferred into 10 ml fresh TSB for subculture at 35 °C for 24 h. For each bacterial species, the cultures of the five strains were mixed. Each mixture was then centrifuged (1,912 × g, 15 min, 4 °C), and the cell pellets washed twice with phosphate-buffered saline (PBS; 0.2 g of KH2PO4, 1.5 g of Na2HPO4, 8.0 g of NaCl, 0.2 g of KCl, 1 l of distilled water, pH 7.4). Cell suspensions of the two bacterial species were diluted with PBS to 6–7 log CFU/ml.Inoculation and enumeration of bacterial cell counts
The 0.1 ml aliquots of S. aureus or B. cereus were inoculated on the surface of intact tomatoes at approximately 5 log CFU/g, and left for 15 min to allow for the attachment of bacterial cells. Following inoculation with S. aureus, tomatoes were placed in plastic containers and stored at 4, 10, 15, 20, 25, and 30 °C for up to 7 days, with samples analyzed every 24 h. Tomatoes inoculated with B. cereus were stored at 30 °C for up to 3 h. Every tomato (180 ± 20 g) was aseptically transferred to a filter bag (3MTM, Seoul, Korea) containing 100 ml of 0.1% buffered peptone water (BPW; Becton, Dickinson and Company, Sparks) and homogenized for 30 s (BagMixer®, Interscience, St. Nom, France). Homogenates were serially diluted with 9 ml BPW, and 0.1 ml of the diluents was plated on tryptic soy agar (TSA; Becton, Dickinson and Company) for total bacteria, mannitol salt agar (MSA; Becton, Dickinson and Company) for S. aureus, and mannitol-salt egg-yolk polymyxin agar (MYP; Becton, Dickinson and Company) for B. cereus. Plates were incubated at 35 °C for 24 h. After microbial analysis, the pH values of the homogenates were measured with a digital pH meter (Accumet®, Denver Instruments, Arvada, CO, USA).Enterotoxin measurement
Because 78% of S. aureus intoxication is caused by SEA [14], SEA production was measured. To measure SEA production by S. aureus on tomatoes during storage, 1 ml aliquots of the homogenates used for the quantitation of bacterial populations at 25 and 30 °C were analyzed using a Tecra Staph Enterotoxins Visual Immunoassay (3MTM, North Ryde, NSW, Australia) according to the manufacturer’s instructions. Since B. cereus cell counts decreased rapidly on tomatoes, the enterotoxin production was not measured.Model development
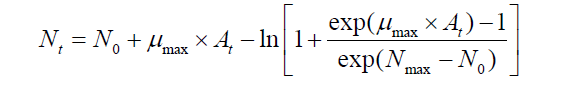
The Baranyi model [15] was fitted to the S. aureus cell count data to estimate kinetic parameters such as death rate (log CFU/g/h) which is defined as μmax in a growth curve, and lag phase duration (LPD; h), and initial cell concentration (N0; log CFU/g) and the lowest cell concentration in a death curve (Nmax; log CFU/g) with DMFit (http:// www.ifr.ac.uk/safety/dmfit/;Institute of Food Research, Norwich, UK) which is an Excel add-in to fit curves with the Baranyi model [15] as follow: Where Nt is the S. aureus cell counts at time t, and N0 and Nmax is the initial and the lowest S. aureus cell counts in a death curve, respectively. At is the adjustment function, which denotes physiological status of S. aureus cell to define the LPD [15].
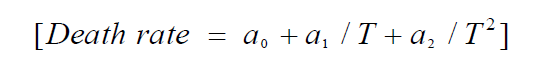
We use a second order polynomial in the inverse temperature to describe the effect of temperature on death rate values as follows:
Where ai is the coefficient and T is the storage temperature (°C). To describe the growth patterns of S. aureus under changing temperatures which also simulates the conditions of tomato distribution, the equation (1) was used.
Validation
Given that S. aureus growth data on tomatoes was not available in the published literature, additional experiments at 12, 18, and 23 °C were conducted. The observed data were then compared with predicted S. aureus cell counts (log CFU/g), which were calculated by developed models. The model performance was evaluated using root mean square error (RMSE) [16]:[RMSE = square root [Ʃ (observed values – predicted values)2 /n]] (3)
Where n represents the number of data points.Changes in temperature during the distribution of tomatoes to three cities were recorded using a Testo 174H electronic temperature recorder (Testo, Sparta, NJ, USA). To evaluate the performance of the model when temperatures were changing, S. aureus population data were collected as the temperature fluctuated and compared with predicted S. aureus populations as simulated by a dynamic model.
Results and Discussion
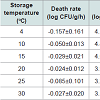
During storage, the growth of S. aureus was not observed at all investigated temperatures. The death rate of S. aureus ranged from −0.157 to −0.024 log CFU/g/h, and was dependent on the storage temperature (Table 1). At 4 °C, the decrease in S. aureus cell counts was obvious with −0.157 log CFU/g/h of death rate. However, at 10–30 °C there was only a minimal decrease in S. aureus cell counts (Table 1). The correlation coefficients (R2) for the primary models varied from 0.733–0.811 (Table 1). In addition, no SEA production by S. aureus was observed (data not shown). Cell counts of B. cereus rapidly decreased below detection limit (0.5 log CFU/g/ml), thus a primary model was not developed. The lack of significant bacterial growth on tomatoes could be due to evaporation occurring at the surface of tomatoes during storage [17], or their waxy surface, which likely protects them from bacterial penetration.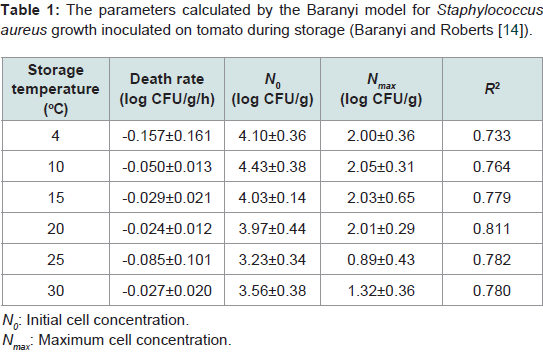
Table 1: The parameters calculated by the Baranyi model for Staphylococcusaureus growth inoculated on tomato during storage (Baranyi and Roberts [15]).
Conclusion
S. aureus cell counts on tomatoes were decreased slightly during storage at ≥10 °C, while B. cereus was not able to survive on tomatoes. In addition, the developed primary and secondary models should be useful in predicting the behavior of S. aureus on tomatoes.
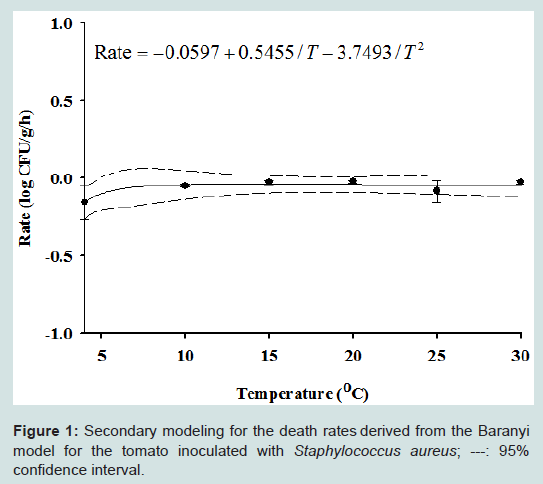
Figure 1: Secondary modeling for the death rates derived from the Baranyi model for the tomato inoculated with Staphylococcus aureus; ---: 95% confidence interval.
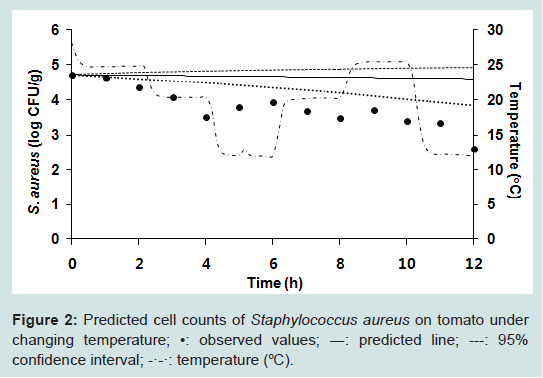
Figure 2: Predicted cell counts of Staphylococcus aureus on tomato under changing temperature; •: observed values; ―: predicted line; ---: 95% confidence interval; -·-·: temperature (°C).
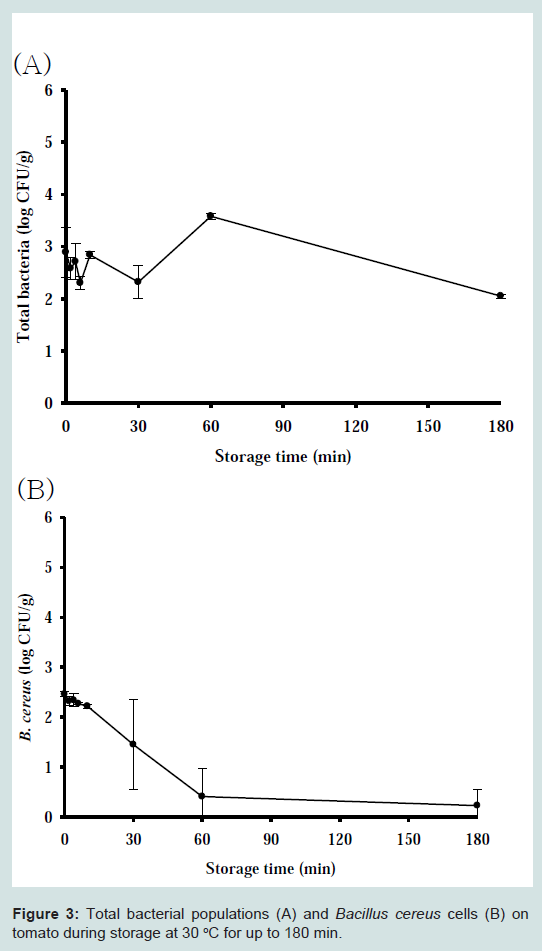
Figure 3 : Total bacterial populations (A) and Bacillus cereus cells (B) on tomato during storage at 30 °C for up to 180 min.
Acknowledgements
This work was carried out with the support of the “Cooperative Research Program for Agriculture Science & Technology Development (Project No. PJ009404)” through the Rural Development Administration of the Republic of Korea.References
- Agarwal S, Rao AV (2000) Tomato lycopene and its role in human health and chronic diseases. CMAJ 163: 739-744.
- Brackett RE (1999) Incidence, contributing factors, and control of bacterial pathogens in produce. Postharvest Biol Technol 15: 305-311.
- Berger CN, Sodha SV, Shaw RK, Griffin PM, Pink D, et al. (2010) Fresh fruit and vegetables as vehicles for the transmission of human pathogens. Environ Microbiol 12: 2385-2397.
- Ham seonbok (2014) Food Poisoning statistics update (January- December 2014). MFDS (Ministry of Food and Drug Safety)
- 5. Lappin E, Ferguson AJ (2009) Gram-positive toxic shock syndromes. Lancet Infect Dis 9: 281-290.
- Sutherland JP, Bayliss AJ, Roberts TA (1994) Predictive modelling of growth of Staphylococcus aureus: the effects of temperature, pH and sodium chloride. Int J Food Microbiol 21: 217-236.
- Le Loir Y, Baron F, Gautier M (2003) Staphylococcus aureus and food poisoning. Genet Mol Res 2: 63-76.
- Granum PE, Lund T (1997) Bacillus cereus and its food poisoning toxins. FEMS Microbiol Lett 157: 223-228.
- Stenfors Arnesen LP, Fagerlund A, Granum PE (2008) From soil to gut: Bacillus cereus and its food poisoning toxins. FEMS Microbiol Rev 32: 579-606.
- Barrie D, Wilson JA, Hoffman PN, Kramer JM (1992) Bacillus cereus meningitis in two neurosurgical patients: an investigation into the source of the organism J Infect 25: 291-297.
- Peters AC, Thomas L, Wimpenny JW (1991) Effects of salt concentration on bacterial growth on plates with gradients of pH and temperature. FEMS Microbiol Lett 61: 309-314.
- Whiting RC, Buchanan RL (1997) Development of a quantitative risk assessment model for Salmonella enteritidis in pasteurized liquid eggs. Int J Food Microbiol 36: 111-125.
- Yoon Y (2010) Principal theory and application of predictive microbiology. Food Sci Ind 43: 70-74.
- Baranyi J, Roberts TA (1994) A dynamic approach to predicting bacterial growth in food. Int J Food Microbiol 23: 277-294.
- Fan X, Niemira BA, Doona CJ, Feeherry FE, Gravani RB (2009) Microbialsafety of fresh produce. Wiley-Blackwell.
- Mejia-Torres S, Vega-Garcia M, Valverde-Juarez J, Lopez-Valenzuela J, Caro-Corrales J (2009) Effect of wax application on the quality, lycopene content and chilling injury of tomato fruit. J Food Quality 32: 735-746.
- Oscar TP (2005) Validation of lag time and growth rate models for Salmonella typhimurium: acceptable prediction zone method. J Food Sci 70: M129-M137.