
Advances in Diabetes & Endocrinology
Download PDF
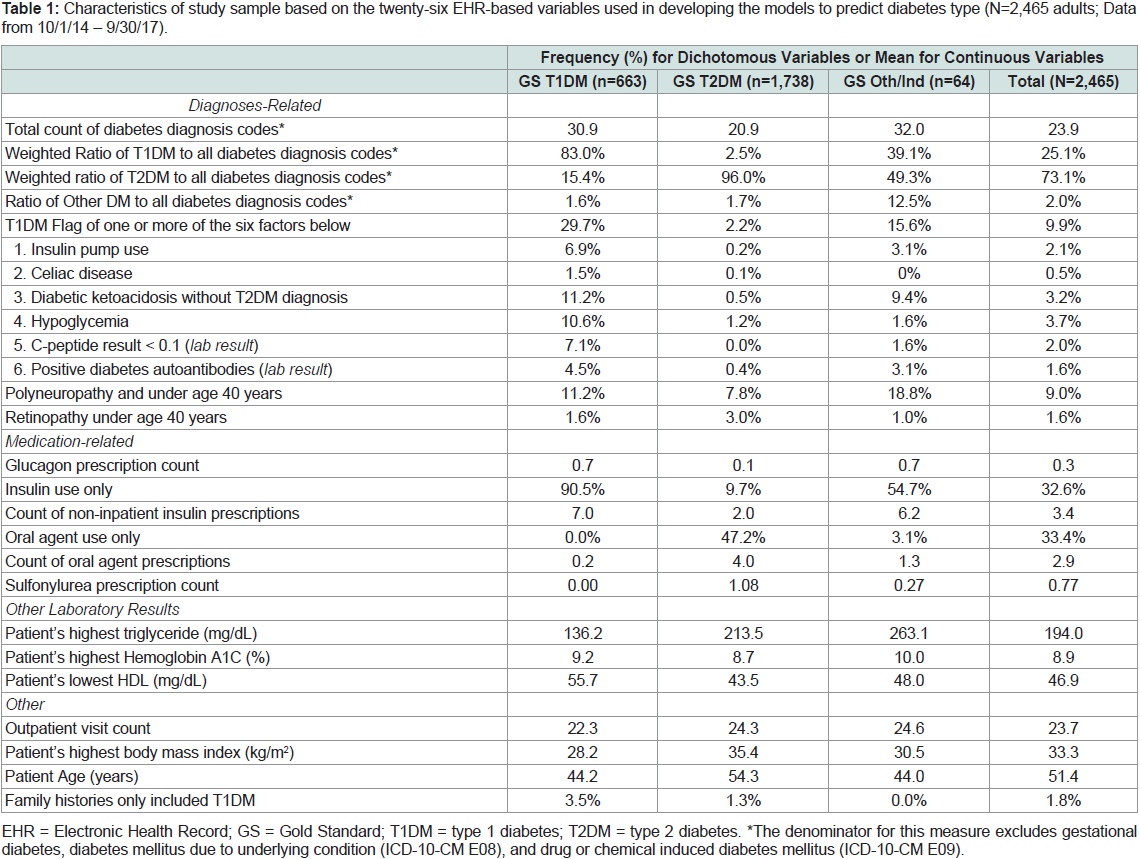 Table 1: Characteristics of study sample based on the twenty-six EHR-based variables used in developing the models to predict diabetes type (N=2,465 adults; Data
from 10/1/14 – 9/30/17).
Table 1: Characteristics of study sample based on the twenty-six EHR-based variables used in developing the models to predict diabetes type (N=2,465 adults; Data
from 10/1/14 – 9/30/17).
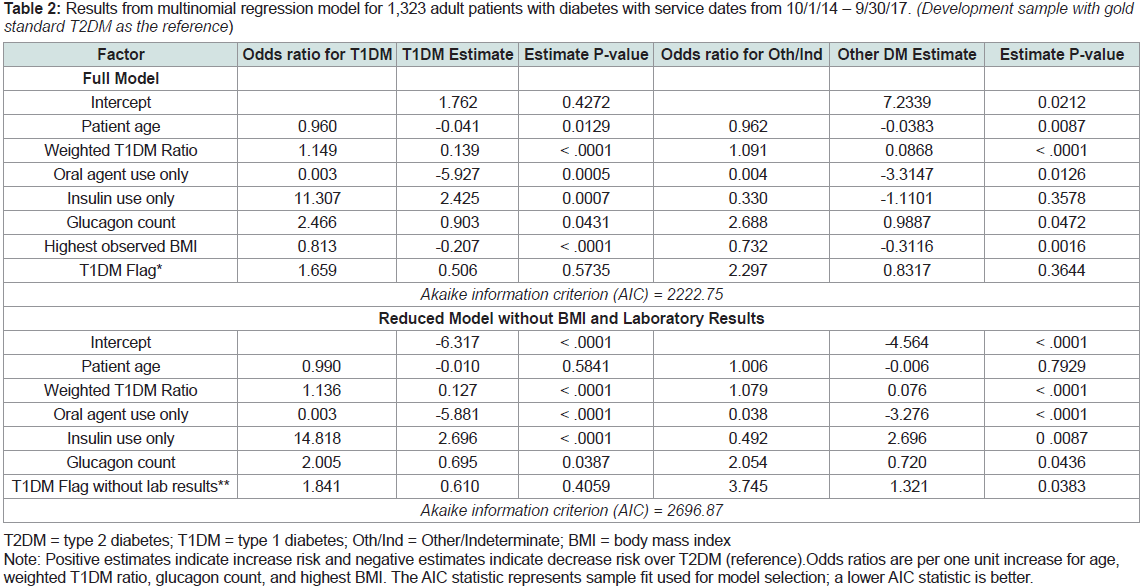 Table 2: Results from multinomial regression model for 1,323 adult patients with diabetes with service dates from 10/1/14 – 9/30/17. (Development sample with gold
standard T2DM as the reference)
Table 2: Results from multinomial regression model for 1,323 adult patients with diabetes with service dates from 10/1/14 – 9/30/17. (Development sample with gold
standard T2DM as the reference)
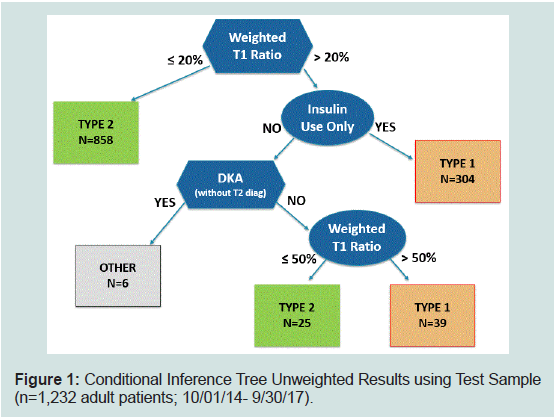 Figure 1: Conditional Inference Tree Unweighted Results using Test Sample
(n=1,232 adult patients; 10/01/14- 9/30/17).
Figure 1: Conditional Inference Tree Unweighted Results using Test Sample
(n=1,232 adult patients; 10/01/14- 9/30/17).
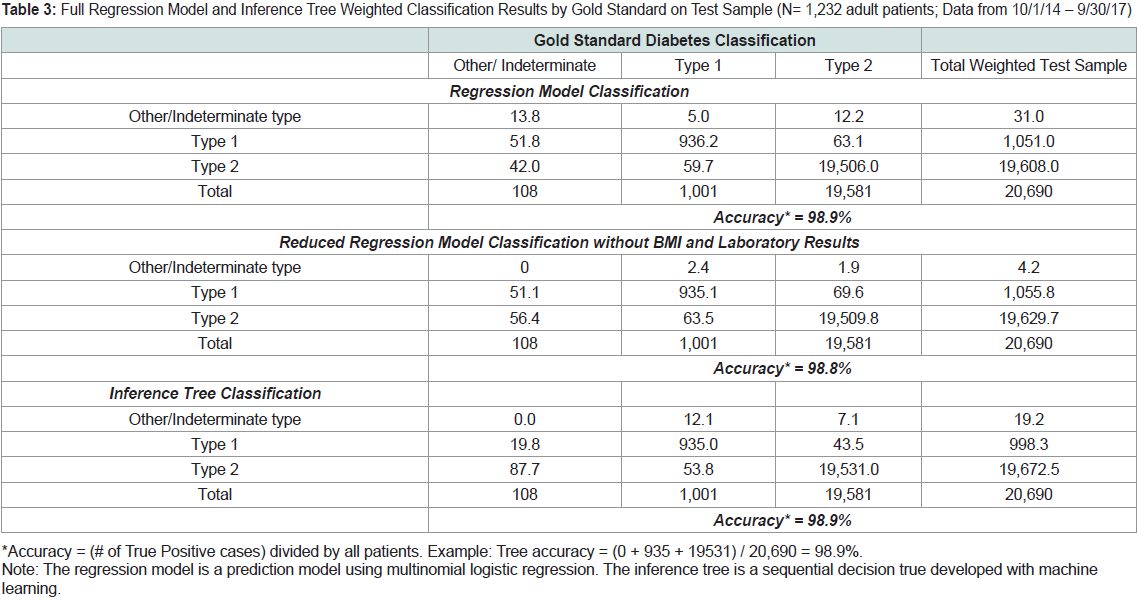 Table 3: Full Regression Model and Inference Tree Weighted Classification Results by Gold Standard on Test Sample (N= 1,232 adult patients; Data from 10/1/14 – 9/30/17)
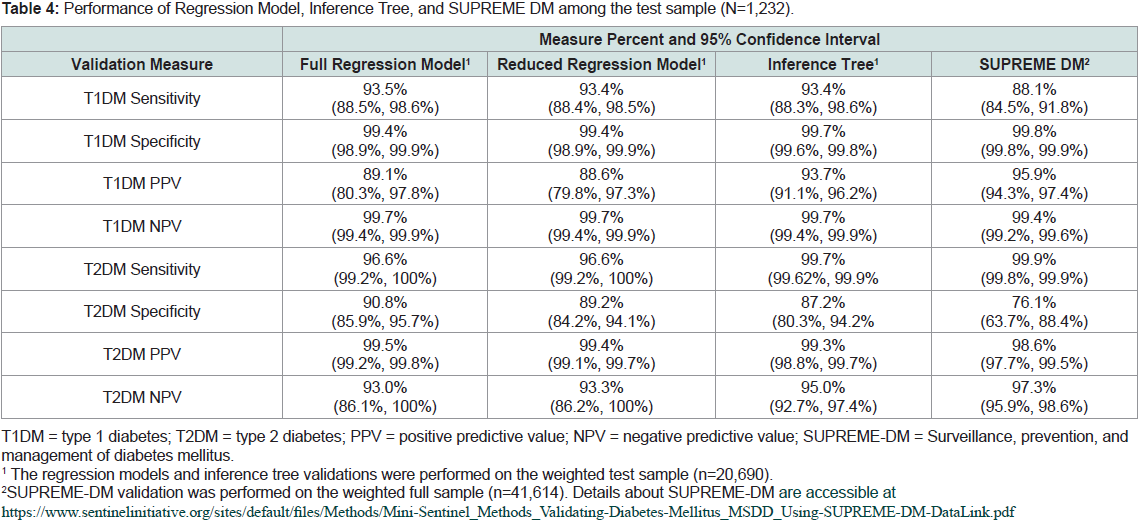 Table 4: Performance of Regression Model, Inference Tree, and SUPREME DM among the test sample (N=1,232).
Research Article
Validated Models Using EHRs or Claims Data to Distinguish Diabetes Type among Adults
Campione JR1*, Nooney JG2, Kirkman MS2, Pfaff E3, Mardon R1, Benoit SR4, McKeever-Bullard K4, Yang DH1, Rivero G1, Rolka D4 and Saydah S4
1Westat, Rockville, MD, USA
2Division of Endocrinology and Metabolism, Department of
Medicine, University of North Carolina, Chapel Hill, NC, USA
3NC TraCS Institute, University of North Carolina, Chapel Hill, NC,
USA
4Division of Diabetes Translation, Centers for Disease Control and
Prevention, Atlanta, GA, USA
*Address for Correspondence:
Campione JR, Westat, Rockville, MD, USA; Tel: 919-768-7325; E-mail:
joannecampione@westat.com
Submission: 21 December, 2022
Accepted: 23 January, 2023
Published: 26 January, 2023
Copyright: © 2023 Campione JR, et al. This is an open access article
distributed under the Creative Commons Attribution License, which
permits unrestricted use, distribution, and reproduction in any medium,
provided the original work is properly cited.
Abstract
Purpose:
Clinical data provides the opportunity for efficient and
timely disease surveillance. We developed and validated advanced
phenotyping models to classify adult patients with diabetes to type 1,
type 2, or other/indeterminate using structured fields from EHR data.
To simulate the use of claims data supplemented with medication
information, we compared model performance before and after the
removal of body mass index (BMI) and laboratory results.
Methods:
We used 3 years of EHR data from a sample of 2,465
adult patients with diabetes from a health care system’s clinical data
warehouse. A weighted ratio of type 1 diabetes codes to all diabetes
codes was created by down-weighting codes from care settings that
do not treat diabetes. We developed two multinomial regression
models and a machine learning conditional inference tree to classify
patients to type 1, type 2, or other/indeterminate. The models were
validated by calculating sensitivity, specificity, positive predictive
value (PPV), and negative predictive value (NPV) relative to a gold
standard.
Results:
For all models, the weighted ratio of type 1 diabetes was
the strongest predictive factor. The models had validation statistics ≥
93% for sensitivity; ≥ 87% for specificity; ≥ 88% for PPV, and ≥ 93% for NPV.
After removal of BMI and laboratory data from the regression model
the largest decline in performance from the full model was in type 2
diabetes specificity (90.8% to 89.2%).
Conclusion:
Prediction models and machine learning conditional
inference trees using either structured fields from EHR data or claims
data supplemented with medication data can be used to accurately
distinguish diabetes type among adults. The inclusion of BMI and
laboratory results improves model specificity for type 2 diabetes.
Keywords
Diabetes classification; EHR; Claims data; Model
validation
Introduction
The Centers for Disease Control and Prevention (CDC) estimates
that 13% of adults in the United States have undiagnosed or diagnosed
type 1 or type 2 diabetes mellitus (T1DM, T2DM) [1]. T1DM and
T2DM are distinct conditions with unique epidemiology, treatment,
and complications. As the prevalence of T2DM in adolescents and
young adults continues to increase [2], there is a growing need for
diabetes surveillance systems to distinguish between the types of
diabetes to help in planning and budgeting for public health diabetes
programs; to measure the cost and quality of care for the two types;
and to trend type-specific pathophysiology, prevalence, morbidity
and mortality especially for the more rare T1DM and youth onset
T2DM [3-6].
To measure national diabetes prevalence among adults, CDC
relies upon national surveys such as the National Health Interview
Survey and the National Health and Nutrition Examination Survey
(NHANES). However, it is difficult to use surveys for estimating
prevalence by type because, when surveyed, individuals with diabetes
may be uncertain about their diabetes type diagnosis and/or their
prescribed diabetes-related medications.
Aside from surveys, another approach to diabetes type
classification and surveillance is through the use of electronic
health record (EHR) data. As more health systems in the U.S.
have implemented EHR data ware houses and health information
exchanges, EHR clinical data provides the opportunity for efficient
and timely disease surveillance through modeling [7-9].
Within the youth population with diabetes, EHR-based methods
to distinguish between T1DM and T2DM have been well-developed
and validated [10-15]. However, among adults with diabetes, the
studies on EHR-based models have either a) had access to diabetes
onset information from a registry, b) not performed validation on
both Type 1 and Type 2 classification, or c) validated on a small
sample of cases [16-19].
One notable effort to develop an EHR-based algorithm for
classifying diabetes type among adults has been the work of Klompas
et al. and SUPREME DM. The SUPREME DM algorithm, includes
a combination of criteria from diagnoses codes, drug use, and
laboratory results for positive auto antibodies and c-peptide results
to identify adults with T1DM or T2DM [18,20]. Schroeder et al.
subsequently validated the SUPREME DM algorithm, however chart
review for the study was only performed for T1DM patients and,
therefore, the validation only reported T1DM positive predictive
value (96.4%) [21].
While the field develops phenotyping models using EHR-data, in
reality, there remains the interoperable challenge of combining EHR
data across multiple providers’ systems. For this reason, to perform
these models at the regional or state level, researchers are more likely
to use larger-scaled claims databases supplemented with medication
data. Therefore, as part of our study, we removed from our full EHR
model BMI and laboratory data (i.e., data often unavailable in claims
data) to simulate a claims + medication-based (“simulated claims”)
model and compared the models’ performance.
Material & Methods
Data source and population:
We used EHR data from the University of North Carolina’s
(UNC) affiliated health system, called UNC Health, which consists
of 12 hospitals and over 200 practices across the state of North
Carolina. During the study time period, UNC Health used the Epic
EHR system and stored the data in the Carolina Data Warehouse
for Health (CDW-H). The CDW-H is refreshed daily and contains
clinical, research, and administrative data sourced from UNC Health,
covering over 2.7 million unique patients since 2004. The population
for the study included adults ≥ 18 years of age who had at least one
diagnosis code for non-gestational diabetes and two or more office
visits at a UNC Health outpatient facility during the 18 months
4/1/2016 - 9/30/2017. This identified 100,743 recently active patients
with at least one diagnosis code for diabetes.
Diabetes case identification and sample selection:
Within this population, we aimed to identify a stratified random
sample highly likely to have diabetes since patients who do not actually
have diabetes are not useful for developing models to distinguish
diabetes type. Our first step was to use diabetes case-finding criteria
(see Appendix Table 1) based on diabetes diagnosis codes, diabetes related
laboratory results, and diabetes-related medications, similar
to prior “straw man” criteria [18,22].
We then narrowed the population to include only patients who
had at least one visit to the following clinic types that are likely to
address diabetes: endocrinology, family medicine, general internal
medicine, and obstetrics/gynecology. Women with a diagnosis code
for abnormal glucose in pregnancy or gestational diabetes were
excluded. These restrictions reduced the sample by 59%, resulting in a
sample frame of 41,614 adult patients with presumed non-gestational
diabetes.
We selected a stratified random sample of 2,500 adult patients
with diabetes. To facilitate detection of the rarer T1DM, we
oversampled probable T1DM by identifying patients with two or
more T1DM codes on separate occasions OR one T1DM code on
the patient’s problem list AND no outpatient prescription for noninsulin
hypoglycemic medications. The sample was further stratified
by three age categories, sex, and race/ethnicity to allow for equal
representation across these demographics. Once the sample was
finalized, each patient in the sample was assigned a sample weight
calculated as the inverse of the selection probability in their stratum
for the purpose of validating the model on the health system’s “real”
patient population of adult patients with type 1 or type 2 diabetes.
Thus, the sum of the sampling weights equaled 41,614.
From the CDW-H, relational data files of structured EHR data
were pulled for the 2,500 patients during October 1, 2014 - September
30, 2017. Structured EHR data include patient demographics, health
care service dates and settings, diagnoses codes, patient vital signs
such as blood pressure and body mass index (BMI), laboratory
results, and prescription medication information. Structured fields
do not include physician’s notes. The laboratory results file included
hemoglobin A1c, lipids, c-peptide, auto antibodies, and triglycerides.
Using EHR data for distinguishing diabetes can be challenging when
information is not contained in structured data elements.
Gold standard classification:
Currently, there can be considerable overlap in the diagnoses that
physicians list in the patient records of adults with unclear diabetes
type. Thus, there is no existing gold standard for diabetes type. For
this study, to develop a gold standard diabetes type (T1DM, T2DM,
and Other/Indeterminate type) we did chart review using REDCap
electronic data capture tools on patients with any inconsistency in
diagnosis codes [23]. For these patients, trained abstractors reviewed
the patient’s information to collect age at diagnosis, historical use
of insulin and oral antidiabetic medications, and other elements
not available in the EHR structured fields. We then applied two
quantitative models independently to each case - a decision tree
and a weighting equation. A decision tree used sequential rules to
classify patients based on clinical factors and a weighting equation
simultaneously considered twelve clinical factors using a scoring
system in which clinical characteristics weighed towards or against
Type 1 or Type 2. Both methods permitted a classification of
“indeterminate.” When the two methods did not agree, or when both
models assigned the individual to Other/Indeterminate type (n=282),
the study’s endocrinologist reviewed and classified those cases. The
other forty-one percent of the sample were straightforward cases that
were already distinguishable – these patients had two or more of only
one type-specific diabetes diagnosis code and consistent medication
associated with that type (i.e., T1DMs with evidence of insulin only
and T2DMs with no evidence of insulin not on insulin). The gold
standard classifications were also used for the validation of new
survey questions, in a separate study [24].
After chart review, we excluded thirty-five patients found to not
have any diabetes or recently deceased. Among the 2,465 remaining,
the sample consisted of 52% females. The race distribution was
33% Non-Hispanic white; 28% Non-Hispanic black; 23% Hispanic
and 16% Non-Hispanic other. The gold standard classification was
663 T1DM, 1,738 T2DM, and 64 Other/Indeterminate types. After
applying the sample weights, the gold standard prevalence was 4.8%
T1DM, 94.6% T2DM, and 0.5% Other/Indeterminate type; similar to
survey-based national estimates of T1DM and T2DM among adults
diagnosed with diabetes [25]. Hence, a measure of internal validity,
The Other/Indeterminate type includes secondary diabetes due to
genetic defects of beta-cell function or insulin action, diabetes after
a pancreatectomy or other surgery (i.e., post-procedural diabetes),
secondary diabetes not elsewhere classified, and case types that were
indeterminate.
Calculation
Development of Model Variables:
Patient information found in the EHR data between October 1,
2014 - September 30, 2017 was used to develop the model variables.
Prior algorithms to classify T1DM among patients with diabetes
included the use of the ratio of T1DM codes to the sum of T1DM and
T2DMdiagnosis codes [10,18,20]. Therefore, we created weighted
diagnosis-based ratios for T1DM, T2DM, and Other/Indeterminate
type. To do this, we categorized each diabetes code found into one
of four subgroups: 1) High Value (HV): when the code was linked
to a visit with one of UNC Health’s diabetes / endocrinology clinics,
primary care clinics, or when the visit type was “Return Diabetes”;
2) Problem List (PL): when the code was on the Patient Problem
List; 3) Primary Diagnosis (PD): when the code was not from a high
value setting, but listed as the primary diagnosis; and 4) All Other
(AO) diabetes diagnosis codes found. The AO subgroup was downweighted
to reduce the influence of diabetes diagnosis codes from
care settings that do not treat diabetes because these codes may be less
reliable than codes from health care settings that do treat diabetes. For
each subgroup, type-specific ratios were created by dividing the typespecific
count of codes (i.e., numerator) by the count of all diabetes
codes. The all diabetes count excluded diagnosis codes for gestational
diabetes, diabetes mellitus due to underlying condition (Version 10 of
International Classification of Diseases Clinical Modification (ICD-
10-CM) E08), and drug or chemical induced diabetes mellitus (ICD-
10-CM E09). The final weighted ratio for each type was the weighted
average of the subgroup ratios.
Using laboratory result data, we found patients’ highest value for
hemoglobin A1c and triglycerides and their lowest value for highdensity
lipoproteins (HDL). Indicator flags were created if a patient
had positive auto-antibodies or a c-peptidevalue < 0.1ng/mL.
Prescribed medications were put into one of six categories:
1) Metform alone, 2) insulin, 3) Sulfonylurea, 4) other oral agents,
5) non-insulin injectables (i.e., liraglutide and exenatide) or 6)
Glucagon. Insulin use is universal for patients with T1DM, with
the exception of those newly diagnosed with T1DM, and oral
hypoglycemic medications (alone or with insulin) are often used to
treat patients with T2DM. We aggregated the counts of metformin
alone, oral agent, and non-insulin injectables to create a patient’s
count of all oral agents. The count values of the six categories and
of all oral agents were used to develop two indicator variables: “Oral
Agent Use Only” and “Insulin Use Only”.
Development of Regression Model:
After variable development, we randomly cut the sample in half.
One half was used for model development (n=1,233) and the other half
for model validation. To choose the candidate variables for predicting
diabetes type among adults we reviewed the correlations of each
variable to each gold standard type, and considered the factors used
in previously published models to distinguish diabetes type in light of
our clinical knowledge [17,20]. This resulted in a list of 26 candidate
variables, not including patient race, age category, or gender as these
characteristics were used for stratification and weighting.
We then estimated and refined several multinomial regression
models on the development sample. For each patient, multinomial
model produced a probability of T1DM, T2DM, and Other/
Indeterminate type. The highest of these probabilities is that model’s
predicted type for that case. We refined the models using Least
Absolute Shrinkage and Selection Operator (LASSO) to assist in
finding the subset of variables that best predicted diabetes type [26].
We prioritized the use of continuous values when possible, however,
we also explored the use of cut points for continuous variables such
as age, highest observed BMI, highest hemoglobin A1c results, and
diagnosis ratios. We reviewed the area under the curve (i.e., c-statistic)
to choose the best performing model within the development sample
taking into account clarity, simplicity, and clinical plausibility, as well
as statistical performance. The data preparation and the regression
models were developed using SAS version 9.4 (SAS Institute Inc.,
Cary, NC).
Development of Inference Tree:
As an alternative to regression modeling, we applied a supervised
machine learning (ML) approach to develop a conditional inference
tree that classified each patient into one of the three gold standard
types. Supervised learning, in which the machine learning program
is provided a set of input variables (e.g. the 26 study variables) and
a known output variable (e.g., gold standard type), is a common
approach used for disease prediction and diagnosis [27]. The
conditional inference tree was built using the ctree function from
party package in R version 3.6.0 [28]. As part of the process, first the
ML program uses a significance test procedure in order to select key
variables, and then, when necessary, determines implicit binary splits
for continuous variables [29-30]. The overall criterion for the tree was
optimal balanced sensitivity, specificity, PPV and NPV.
Validation:
After model development, we validated both the multinomial
regression model and the conditional inference tree in the validation
sample (n=1,232). For each model, we calculated the weighted
sensitivity, specificity, PPV, and NPV for both T1DM and T2DM
relative to the gold standard. To assist with comparison of model
performance, we also looked at the combined accuracy score defined
as all correct predictions divided by total sample. Lastly, we tested
and validated the SUPREME DM algorithm (Appendix Table 2) for
classifying diabetes type [20].
Results
The frequencies or mean values of the twenty-six EHR candidate
variables used in model development are reported in Table 1 by the
full sample’s gold standard classification and in total. Interestingly,
among the patients classified with Other/Indeterminate type, 54.7%
took insulin only and 15.6% had one or more conditions qualifying
them for the T1DM flag.
Multinomial Regression Model Estimates:
The final multinomial regression model included seven variables. Table 2
shows the regression model’s odds ratios and maximum
likelihood estimates (i.e., model coefficients) for predicting T1DM
and Other/Indeterminate type, with T2DM as the reference outcome.
Three factors significantly increased the likelihood for T1DM in
comparison to T2DM: higher weighted T1DM ratio (p < .001),
insulin use only (p < .001), and higher glucagon count (p = .04).
Three variables significantly decreased the likelihood for T1DM in
comparison to T2DM: older patient age (p = .01), oral agent use only
(p < .001), and higher BMI (p < .001). For example, for each kg/m2
unit increase in highest observed BMI, the likelihood or probability
of an individual having T1DM in comparison to T2DM decreases
by 0.207. For the dichotomous variables, it is easier to interpret the
meaning of the odds ratio. For example, for patients that only used
insulin, the probability of having T1DM rather than T2DM is 11
times that for patients that did not use insulin only. In predicting
Other/Indeterminate type, the weighted T1DM ratio (p < .001) was
the only factor that increased the likelihood for Other/Indeterminate
type in comparison to T2DM. Two variables significantly decreased
the likelihood for Other/Indeterminate type in comparison to T2DM:
older patient age (p = .01) and highest observed BMI (p = .002).
Table 2 also shows the results of the multinomial regression
model after the removal of three risk factors not easily accessible in
claims data: the two laboratory results included in the T1DM Flag
(positive auto-antibodies and c-peptide results) and BMI. When the
two laboratory results and BMI were removed, the model fit decreased
only slightly in comparison to the full model.
Conditional Inference Tree Results:
The machine learning approach chose only three variables for the
conditional inference tree to classify diabetes type: weighted T1DM
ratio, insulin use only, and DKA without T2DM codes. The tree
made two binary splits of the weighted T1DM diagnosis ratio: 18.78%
full sample and 42.99% among insulin users. Because these precise
split values “over fit” the development sample, the split values were
smoothed and rounded up to 20% and 50%, respectively. Figure 1
display how the inference tree classifies patients from the test sample,
with each box at the end of a branch displaying the number of patients
classified to the type of diabetes.
Table 3 shows the weighted classification results from both the
regression model and the inference tree using the test sample, cross tabulated
with the gold standard classifications. The full regression
model and the inference tree each had an accuracy of 98.9%. The
reduced regression model without laboratory results and BMI had an
accuracy of 98.8%.
Validation Results:
As shown in Table 4, the regression models and the inference
tree had similar T1DM sensitivity (93.5% and 93.4%) and were
significantly higher than SUPREME DM’s T1DM sensitivity (88.1%).
The reduced regression model’s T2DM specificity (89.2%) decreased
by 1.6 percentage points in comparison to the full regression model
(90.8%), yet was still higher than both the inference tree (87.2%) and
SUPREME DM (76.1%).
The full regression model misclassified 58 cases (4.7%
unweighted), the reduced regression model misclassified 65 cases
(5.3% unweighted) and the inference tree misclassified 70 cases (5.7%
unweighted). Forty-nine of the inaccurate cases were classified to
the same type by the full regression model and the tree: 20 T1DM, 28 T2DM AND 1 Other/Indeterminate types. We investigated these
49 cases and found that 41 cases (84%) had required a review by the
study’s endocrinologist during the gold standard process. Twenty-six
of the 49 cases (53%) had a gold standard type of other/Indeterminate,
several with cystic fibrosis-related diabetes. All 49 patients took
insulin. There were 6 patients that used oral medications, as found by
the gold standard chart review, yet no evidence of oral medications
in the EHR structured fields. Furthermore, among cases incorrectly
classified as T1DM, the patients had valid T1DM factors such as a
high weighted T1DM ratio and/or a prescription for glucagon.
Discussion
We developed an EHR-based regression model, a simulated
claims-based regression model, and an EHR-based inference tree
to distinguish diabetes type among adults. All three models yielded
≥ 89% accuracy on a test set comprising 1,232 adult patients with
diabetes. The results offer enhanced models to classify diabetes
type among adults using EHR or claims data for the purposes of
surveillance, targeting interventions, evaluating treatment processes,
and measuring type-specific patient outcomes [8,31]. The full EHRbased
multinomial regression model had very strong performance,
especially T1DM sensitivity, and may be ideal for analysts with access
to diabetes-related medication data, BMI values, c-peptide results,
and auto antibodies. Interestingly, the machine learning inference
tree approach did not use BMI or laboratory results to distinguish
type. Therefore, our tree model may be ideal for researchers using
claims data supplemented with medication data.
The conditional inference tree displayed the ability of machine
learning to successfully find optimal cut-points of the weighted T1DM
ratio variable twice, resulting in high performance. For example, for a
person with ≥ 20% T1DM ratio and insulin use only the tree’s upper
branches assigns that person to T1DM type, whereas the SUPREME
DM algorithm would have not classified those patients as T1DM
(unless they had positive autoantibodies or c-peptide result < 0.1 ng/
mL) because the SUPREME DM algorithm uses a T1DM ratio cut
point of > 50% for T1DM classification.
The weighted T1DM ratio was the strongest factor in the models.
Because of the increased granularity of ICD-10-CM compared to
ICD-9-CM, we suspect the ratio variable would gain precision in
phenotyping models that are no longer using ICD-9-CM codes [32].
Clinicians now must choose among one of five categories when
coding a diabetes-related condition or complications under ICD-10-
CM: 1) E08: Diabetes mellitus (DM) due to underlying condition,
2) E09: Drug or chemical induced DM, 3) E10: Type 1 DM, 4) E11:
Type 2 DM, and 5) E13: Other specified diabetes mellitus. Yet,
having to make this choice can be difficult at diabetes onset, even for
endocrinologists. Therefore, future research is needed to measure
physician accuracy and consistency of their coding, especially among
specialty-type providers who do not usually diagnose diabetes.
Most often, adults with diabetes may be incorrectly identified as
having T2DM. Notably, among the models validated in this study,
we found that the full multinomial regression model, with use of
c-peptide results, positive auto antibodies, and BMI values, was better
than the reduced model and the inference tree at detecting T2DM
true negatives. More specifically, this clinical information enhances
the ability to distinguish when an adult should not be classified as TD2M and, thus, considered to have T1DM or other rare type of
diabetes. This is important to improve patient-centered care and the
public health monitoring of diabetes trends. Thus, more research is
needed to develop phenotyping models that include the processing
of free text notes and other factors that will assist in classifying adult
patients that have other types of diabetes.
We found that claims data with medication information is a
sufficient data source for classifying diabetes type. The removal of
BMI and laboratory data had little impact on the regression model’s
performance with the exception of a slight decline in detecting
T2DM true negatives. Nevertheless, in comparison to claims data, EHR data can provide more comprehensive, timely, and longitudinal
information for patients who change insurers [33]. Additionally, most
health care providers’ EHR databases are updated continually, and
thus, automatic programs against EHR data can analyze the data on
a routine basis to produce timely, granular, and detailed surveillance
summaries and/or patient-predicted type [34]. We have provided in
the Appendix the definition of the 7 variables in the model (Table 3),
the SAS Code® for the multinomial regression model (Table 4), and
the code using the SAS/STAT® Proc PLM SCORE statement to apply
the coefficients (Table 5) [35].
Lastly, the study has limitations. Because we developed and tested our algorithm among patients from one health system’s EHR
database, it is possible that a patient received health care outside of
UNC Health, and thus, have incomplete clinical data in our analysis
[8,36]. Forty-one of the patients did not have the REDCap chart review
performed offering the possibility of gold standard misclassification
and also inflating the validation results. We randomly sampled 30
of these “clean cases” for chart review (blindly) and found 100%
compliance to the classification. Although 41% of the patients did not
undergo chart review, only 8 of those patients were misclassified by
the full model and the tree model. This suggests that classification
of the non-chart reviewed patients was accurate, remaining the same
after adding in age, laboratory results, BMI, and the T1DM flag.
Conclusion
This study was the first to validate the classification of both type
1 and type 2 diabetes among adults from data fields commonly
available in EHR data and claims data supplemented with medication
information. Validation of the models against a gold standard
classification found that a regression-based prediction model and a
conditional inference tree using EHR data or claims plus medications
data could be used to accurately distinguish diabetes type.
Acknowledgements
This work was supported by Grant Number DP006327-01, funded
by the Centers for Disease Control and Prevention. Its contents
are solely the responsibility of the authors and do not necessarily
represent the official views of the Centers for Disease Control and
Prevention or the Department of Health and Human Services.
J.R.C. is the guarantor of this work and, as such, had full access to
all the data in the study and takes responsibility for the integrity of the
data and the accuracy of the data analysis.
Author contributions: J.R.C. conceptualized the development
of the models. J.R.C., J.N, M.S.K., E.P., D.Y., and G.R analyzed data,
contributed to discussion, and reviewed/edited the manuscript.
K.M.B., S.R.B, S.S, D.R., and R.M. contributed to discussion and
reviewed/edited the manuscript.
References
Citation
Campione JR, Nooney JG, Kirkman MS, Pfaff E, Mardon R, et al. Validated Models Using EHRs or Claims Data to Distinguish Diabetes Type
among Adults. Adv Diabetes Endocrinol 2023;7(1): 4.