
Research Article
*Address for Correspondence: Sukanta Mondal, Department of Biological Sciences, Birla Institute of Technology and Science–Pilani, K.K. Birla Goa Campus, Zuarinagar, Goa 403 726, India, Tel: +91-832-258-0149; Fax: +91-832-255-7031; E-mail: suku@goa.bits-pilani.ac.in
Citation: Singh G, Dhole K, Pai PP, Mondal S. SPRINGS: Prediction of Protein-Protein Interaction Sites Using Artificial Neural Networks. J Proteomics Computational Biol. 2014;1(1): 7.
Copyright © 2014 Singh G, et al. This is an open access article distributed under the Creative Commons Attribution License, which permits unrestricted use, distribution, and reproduction in any medium, provided the original work is properly cited.
Journal of Proteomics & Computational Biology | Volume: 1, Issue: 1
Submission: 24 March 2014 | Accepted: 05 April 2014 | Published: 10 April 2014
Reviewed & Approved by: Dr. Juraj Gregan, Department of Chromosome Biology, University of Vienna, Austria
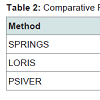
 After performance assessment on Dtestset72, SPRINGS was tested on PDBtestset164. SPRINGS achieved an MCC of 0.108 and F-measure 31.1% as shown in Table 2. PSIVER followed the results of SPRINGS with an MCC of 0.078 and F-measure 29.5%.
 Exploring factors influencing performance of springs
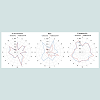
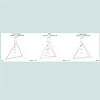
 Further, as reported in earlier research studies predicted structure information is known to enhance prediction of protein interaction sites [9]. Herein, we have explored if the content of experimentally observed secondary structures have an influence on the prediction rates. 2Struc [26] was used to extract secondary structure elements for analyses according to a reduced three-state representation: Helix (encompassing H, I, G), Strand (E) and Coil (all remaining elements), where H, I, G and E are from their DSSP definitions [27]. Figure 2 shows specific prediction performance for Helix, Strand and Coils.
 Comparison of SPRINGS with previously reported approaches
SPRINGS: Prediction of Protein-Protein Interaction Sites Using Artificial Neural Networks
Gurdeep Singh, Kaustubh Dhole, Priyadarshini P. Pai and Sukanta Mondal*
- Department of Biological Sciences, Birla Institute of Technology and Science–Pilani, K.K. Birla Goa Campus, Zuarinagar, Goa 403 726, India
*Address for Correspondence: Sukanta Mondal, Department of Biological Sciences, Birla Institute of Technology and Science–Pilani, K.K. Birla Goa Campus, Zuarinagar, Goa 403 726, India, Tel: +91-832-258-0149; Fax: +91-832-255-7031; E-mail: suku@goa.bits-pilani.ac.in
Citation: Singh G, Dhole K, Pai PP, Mondal S. SPRINGS: Prediction of Protein-Protein Interaction Sites Using Artificial Neural Networks. J Proteomics Computational Biol. 2014;1(1): 7.
Copyright © 2014 Singh G, et al. This is an open access article distributed under the Creative Commons Attribution License, which permits unrestricted use, distribution, and reproduction in any medium, provided the original work is properly cited.
Journal of Proteomics & Computational Biology | Volume: 1, Issue: 1
Submission: 24 March 2014 | Accepted: 05 April 2014 | Published: 10 April 2014
Reviewed & Approved by: Dr. Juraj Gregan, Department of Chromosome Biology, University of Vienna, Austria
Abstract
Knowledge of protein-protein interaction sites provides an important base for deciphering novel drug targets. But on account of biological complexity and transient forms, determination of these sites is a challenge in biology. Various computational approaches are being explored for relevant prediction based on available protein sequence-structure information. Here we propose a novel method SPRINGS (Sequence-based predictor of PRotein- protein InteractING Sites) for identification of interaction sites based on sequences. It uses protein evolutionary information, averaged cumulative hydropathy and predicted relative solvent accessibility from amino acid chains in artificial neural network architecture. The performance of SPRINGS is observed to be promising as a complementary approach for proteinprotein interaction sites prediction in protein engineering and drug development.Keywords
Leave one out cross validation; Neural networks; Positionspecific scoring matrix; Protein-protein interactions; Sequence-based predictorIntroduction
Proteins are key players in biological systems orchestrating various mechanisms of life sustenance and growth. They perform such vital functions by concerting interactions with each other forming a network of interplaying agents in regulating as well as facilitating various metabolic functions within and outside of the organisms [1]. Thus, knowledge of protein-protein interactions can provide us with insights into the innate metabolic machinery of living organisms. Further, with newer annotations of protein sequences and structures, mapping protein interaction network has become a coveted aspect of advancing towards its potential applications in proteomics and related fields also [2]. Since protein-protein interaction information allows the function of a protein to be defined by its position in a complex web of interacting proteins, access to such information is believed to have ample role in boosting biological research and drug discovery [3]. These insights can be utilized to develop novel agents for intervening and manipulating the flow of biological information in case of disorders and irregularities [4,5].The identification of these protein-protein interactions was previously approached majorly by means of the experimental techniques. But these methods, may not be generally applicable to all proteins in all organisms, and may also be susceptible to systematic error [2].
Thus, in addition to various conventional experimental methods, a number of complementary computational approaches have been developed for the large-scale prediction of protein–protein interactions based on protein sequence, structure and evolutionary relationships in complete genomes. Computational prediction of protein–protein interactions consists of two main areas (i) the mapping of protein–protein interactions, i.e., determining whether two proteins are likely to interact and (ii) the understanding of the mechanism of protein–protein interactions and the identification of residues in proteins which are involved in those interactions.
Computational prediction of protein–protein interactions has been attempted using sequence - structure information in the past [6]. The structural methods predicted protein–protein interactionbased on the structural context of proteins. Recent advances in complete genome sequencing have however provided a wealth of genomic information, opening possibilities for establishing the genomic context of a given gene in a complete genome [2]. A gene is no longer thought of as a single protein-coding entity but as part of a coordinated network of interacting proteins. The potential for twoproteins to interact is not only specified by the physical and structural properties of their structures, but is also encoded at a genomic level.
Machine learning approaches such as the Naïve Bayes Classifier [7], Neural Networks [8,9], Support Vector Machines [9], Randomforest classifier [10] and L1-regularized logistic regression [11] have been widely explored for prediction of protein-protein interaction sites. However, scope of improvement in the prediction process still exists, given the biological complexities of protein and its interactions.
In this study, we have incorporated protein sequence properties such as evolutionary conservation, hydropathy and predicted structural information in an artificial neural network to predict protein-protein interaction sites. Our findings may help boost crucial target-specific drug development and other potential applications of protein interaction biology.
Materials and Methods
DatasetsIn this study, we have incorporated datasets comprising of heterodimeric non-transmembrane protein chains in complex, listed in Protein Data Bank (PDB) [12], with structures solved using X-ray Crystallography (resolution ≤ 3.0 Å). The interacting residue in the protein chains was defined as a residue that lost absolute solvent accessibility of <1.0 Å2 on complex formation. For training the neural network architecture, training dataset Dset186 was used and for testing the performance of the trained neural network, independent test dataset Dtestset72 containing non-overlapping sequences with Dset186 (sequence identity <25%) was used. Dset186 and Dtestset72 have been previously created and used during the development of PSIVER [7].
Besides these two (training and independent test) datasets, we prepared an additional dataset – PDBtestset164 [11], using newly annotated proteins from June 2010 to November 2013. The filters used on PSIVER datasets as mentioned above, i.e., Dset186 and Dtestset72, were applied for creating PDBtestset164 as follows: Proteins with X-ray Crystallography (resolution ≤ 3.0 Å) heterodimeric structures were included using the advanced search option available at http://www.rcsb.org; and fragments (sequence length <50 amino acids) were excluded. Those protein chains listed in the REMARK 350 as dimers were considered. By means of UniProtKB [13] accession numbers only heterodimers among the considered proteins were selected and used. Protein complexes whose chains had the missing ratio (= the number of missing residues of a chain listed in REMARK465/the total number of residues of the chain × 100) ≥ 30% were removed. Also protein complexes with interface area of <500Å2 or ≥ 2500Å2 as mentioned in PDBsum [14] and transmembrane proteins listed in PDBTM [15] were removed. Some of the retained structures, determined as dimeric, that may be part of larger oligomeric complexes found in other PDB entries were also removed using PDBsum [14]. These structures would have additional interaction sites that could affect the prediction performance of the method. To ensure non-redundant sequences among the filtered chains, we performed their pair-wise clustering using BLASTClust [16]. Then all the sequences with ≥ 25% sequence identity over 90% overlap were removed from within the dataset. Non redundancy of these sequences with Dset186 and Dtestset72 was also ensured. Overall 164 protein chains were obtained in PDBtestset164. Software PSAIA [17] (Protein Structure and Interaction Analyzer) was used to identify protein-protein interaction sites in PDBtestset164. The following PDB IDs along with the mentioned interacting chains were included:
3PH0 (A,C), 3VIQ (A,B), 4DFC (A,B), 3P8B (A,B), 4EQA (A,C),3Q9N (A,C), 4JOI (A,D), 4CDG (A,C), 4HOP (A,B), 2YAJ (A,B), 2WUS (A,R), 3ZEU (D,E), 3AQB (A,B), 3OCD (A,B), 3S97 (A,C), 4HLU (A,D), 4FOU (A,C), 4KT6 (A,B), 3UVJ (A,B), 4FQ0 (B,C), 2YC2 (A,D), 4H3K (A,B), 2Y9W (A,C), 3MDB (A,C), 3O3M (A,B), 3ZHE (A,B), 4E6N (A,B), 3W0L (A,B), 4BH6 (D,L), 3TGX (A,B), 2XQR (A,B), 3OUR (A,B), 3MMY (A,B), 3VPJ (A,E), 3ZR4 (A,B), 3B08 (A,B), 3TU3 (A,B), 3W2W (A,B), 3MP7 (A,B), 3ZYI (A,B), 2YCL (A,B), 4EMJ (A,B), 4KBM (A,B), 4F6U (A,B), 4ETP (A,B), 3VRD (A,B), 3ZKQ (A,D), 3NYB (A,B), 4M69 (A,B), 3AXJ (A,B), 3R07 (A,C), 4E4W (A,B), 3MJ7 (A,B), 4GED (A,B), 4AWX (A,B), 3PV6 (A,B), 3VU9 (A,B), 4JE3 (A,B), 4IU2 (A,B), 4APX (A,B), 3NW0 (A,B), 2WD5 (A,B), 3OG6 (A,B), 3SHG (A,B), 3AYH (A,B), 3ANW (A,B), 3VDO (A,B), 4KT3 (A,B), 3M7F (A,B), 4HFF (A,B), 3Q87 (A,B), 3ONA (A,B), 4BI8 (A,B), 4A5U (A,B), 4EUK (A,B), 4G7X (A,B), 4GN4 (A,B), 4G6T (A,B), 4M70 (B,H), 4BJJ (A,B), 3VZ9 (B,D), 3MCB (A,B)
Artificial neural networks
In this study, for the identification of protein-protein interaction sites by machine learning we used artificial neural networks (ANN). Neural networks are adaptive class of machine learning techniques and have been used successfully in various biological problems [18,19]. Artificial neural network originally was inspired from biological neural network, the brain. The most important and attractive feature of ANN is its capability of learning (generalizing) from example (extracting knowledge from data). ANN can do this without any pre-specified rules that define intelligence or represent an expert’s knowledge. We have implemented the neural network architecture in our study using GNU Octave (available at http://www. gnu.org/software/octave/about.html) to identify protein-protein interaction sites based on distinct protein characteristics mentioned below.
Sequence feature vectors
Classification requires crucially informative protein properties as inputs for ANN learning. As per earlier reports in prediction of protein-protein interaction sites, characteristics of protein sequences such as evolutionary conservation, hydropathy and predicted structural properties offer important contributive influence on the prediction [1,20]. Therefore, we have used these three aspects of target residues to confer towards their identification as interacting or non-interacting residues.
Prediction also depends on the window size over which residues are chosen during feature extraction. In this study, for a residue in a specific protein, a window size of nine was chosen; since previous studies [7,8,10,11] emphasized that a nine-residue window size would be optimal for protein-protein interaction prediction problems. For this sub-sequence of nine residues, encoding was done with a multidimensional vector built on the three attributes:
Evolutionary information was included using position specific scoring matrix (PSSM) generated by PSI-BLAST [21] with an E-value threshold of 0.001, for three iterations against the NCBI nonredundant protein sequence database (using BLAST+ [22] options; −num_iterations 3 −db nr –inclusion_ethresh 0.001). These values were normalized between 0 to 1 using the sigmoid function. The attribute was extracted over a window with size nine and a total of 180 (= 20×9) scores were obtained. This was followed by calculation of averaged cumulative hydropathy (ACH) characteristics of proteins under consideration.
An average of the cumulative hydrophobicity indices over a window size varying between 1, 3, 5, 7 and 9 gave the ACH for this study. Hydrophobicity index proposed by Kyte and Doolitle [23] was implemented using Python codes for computation and a total of five scores were obtained. These values were normalized between 0 to 1 using the sigmoid function. Besides hydropathy, another aspect of the protein important for identification of functional sites is predicted relative solvent accessibility (PRSA).
Since the surface of a protein is non-trivial to define even when the structure is known, machine learning applications and statistical methods are applied to measure relative solvent accessibility which denotes how large a part of the van der Waal’s surface of each amino acid residue is exposed to the solvent surrounding the protein. In this study we have incorporated information on predicted relative solvent accessibility using Sann web server [24]. Sann stands for solvent accessibility predicted by nearest neighbor method from sequence profiles. The method is based on a k-nearest neighbor method combined with Z-value distance statistics in the feature vector space. It predicts the discrete states (two or three states) as well as continuous value of the solvent accessibility (absolute and relative) of a target residue and is available at http://lee.kias.re.kr/~newton/sann/. This attribute is independent of the window size, i.e. only one PRSA score is extracted.
A 186D (= 20×9 + 5 +1) feature vector was thus created, for each positive (interacting residues) and negative (non-interacting residues) example.
Prediction of protein-protein interaction sites and performance assessment
Training of the predictor was done via multi-layer feedforward Neural Network incorporating selected protein properties of PSSM, ACH and PRSA information. To find the optimal set of neural network parameters, unconstrained nonlinear optimization method was used along with the back-propagation algorithm. Training dataset consisting of 186 proteins was used for the predictor development and tested on two independent datasets: (i) Dtestset72 which included rigid body cases (27 protein complexes), medium cases (6 protein complexes) and difficult cases (3 protein complexes), depending upon the degree of conformational change; and (ii) PDBtestset164. The prediction performance was evaluated using the following mathematical formulae for recall or sensitivity, precision, specificity, accuracy, Matthew’s Correlation Coefficient (MCC) and F- measure as follows:
Recall or Sensitivity = TP/(TP + FN)
Precision = TP/(TP + FP)
Specificity = TN/(TN + FP)
Accuracy = (TP + TN)/ (TP + FN + TN + FP)
MCC = ((TP × TN) - (FP × FN)) / √((TP + FP) (TP + FN) × (TN + FP) × (TN + FN)
F – measure = 2 × (Precision × Recall) / (Precision + Recall)
where, TP (true positives): Residues correctly predicted as interacting, FP (false positives): Residues incorrectly predicted as interacting, TN (true negatives): Residues correctly predicted as non-interacting and FN (false negatives): Residues incorrectly predicted as non-interacting.
Results
Prediction using ANN with sequence features on Dset186Neural network was trained on Dset186 using PSSM, PRSA input files and ACH properties. Based on the learning process, that takes place within the hidden layers trained neural networks return a numerical value between 0 and 1 for each residue. This may be transformed to binary state and interpreted as interacting or non-interacting residue. In this study, the residues were subjected to machine learning with an input layer consisting of 186 units (one unit per feature) and onebinary output unit (interacting or non-interacting). After varying the number of hidden layers and the number of units in it, it was foundthat a network of one hidden layer with 15 units performed the best. Further, to analyze the learning process outcomes we performed Leave One Out Cross Validation (LOOCV), repeating 186 times, a process of considering one of the 186 protein sequences as test data while remaining being used for training. We obtained the following results upon performance evaluation using mathematical parameters.Prediction showed an overall MCC value and F-measure of 0.225 and 56.6% respectively.
Performance of SPRINGS on independent test datasets
The best performing neural network model on Dset186 obtained as above was named as SPRINGS (Sequence-based predictor of PRotein- protein InteractING Sites). To gain insights into the predictability of protein-protein interaction sites using SPRINGS on sequences not related to those used in training, we screened previously reported Independent test dataset proteins, Dtestset72 (72 sequences excluded from training) as a benchmark of performance across existing solutions in this context. SPRINGS achieved an MCC of 0.170 and F-measure 31.8% as shown in Table 1. MCC gives the correlation between the actual and predicted classes of residues, whereas F-measure enumerates the harmonic mean of precision and recall, both indicating the overall performance of SPRINGS though not highly promising to be encouraging.
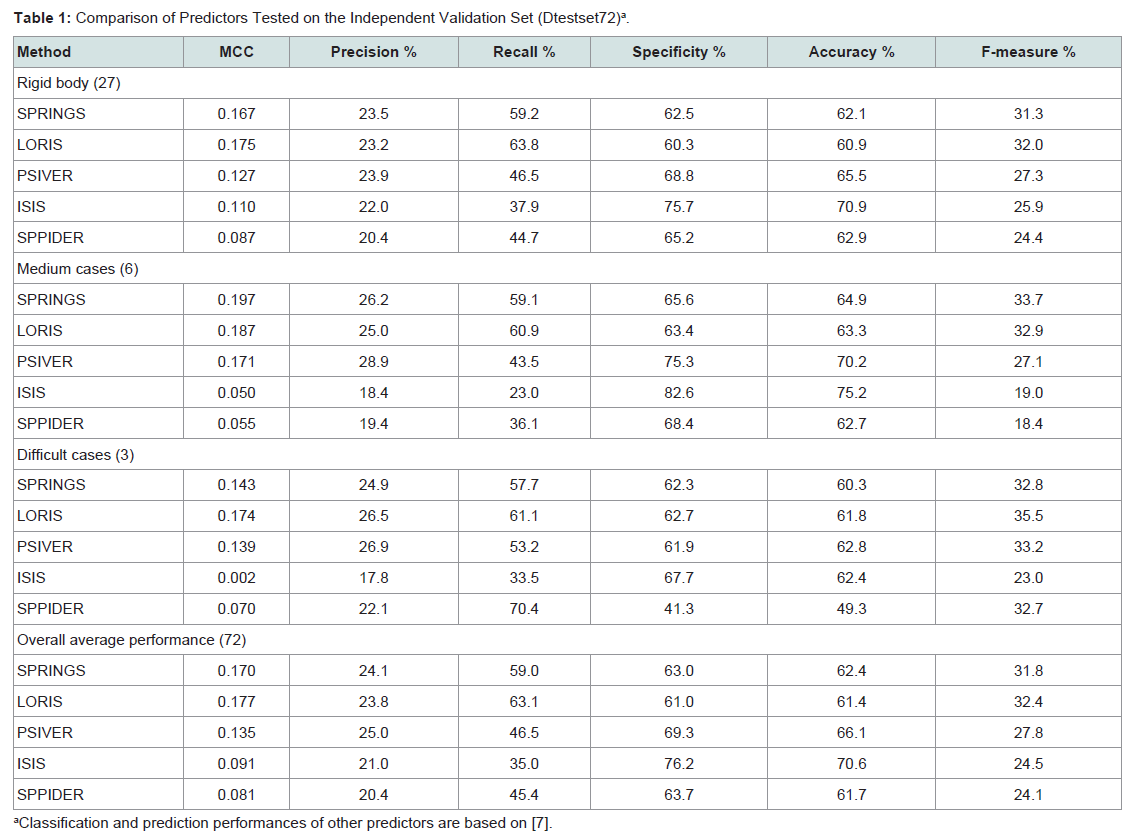
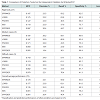
Table 1: Comparison of Predictors Tested on the Independent Validation Set (Dtestset72)a.
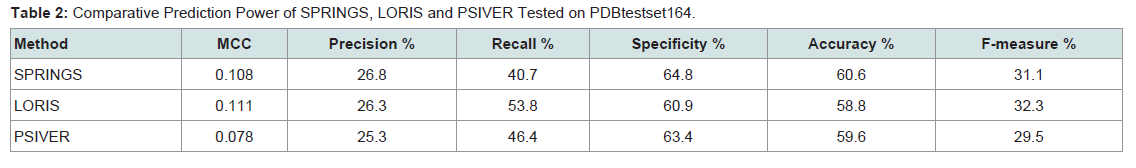
Table 2: Comparative Prediction Power of SPRINGS, LORIS and PSIVER Tested on PDBtestset164.
As reported in earlier research work in protein interaction biology and observed in this study, predicting interacting sites is indeed challenging. Here we have contemplated few underlying aspects of proteins such as sequence length, amino acid type and secondary structure which have not been included as sequence feature vectors in the study for their possible contribution in interacting site prediction. This influence was explored systematically and the following insights were obtained as summarized. Protein 1n2c(ABCD) of a total length = 2000 residues was eliminated from our study to avoid extremity bias during trend analysis.
Proteins in the independent test dataset mentioned above showed lengths varying from 44 to 873 residues. Prediction performance (MCC) and potential length dependency show an overall negative correlation (Pearson’s correlation coefficient r = -0.2) as per our study. To gain more insights into the specific contribution, we grouped the proteins into short length (< 200 amino acid residues; 59.2% in Dtestset72 and 59.8% in PDBtestset164) and long length (≥ 200 amino acid residues; 40.8% in Dtestset72 and 40.2% in PDBtestset164) and analyzed their prediction performance with respect to the percentage of interacting residues in a given protein. Our findings suggested that short length proteins showed a correlation (r) -0.2 and long length proteins showed a correlation (r) 0.4 respectively.
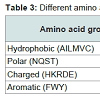
Other than the length, properties of proteins can largely be attributed to their innate amino acid residue composition. We analyzed the prediction performance of our approach in relation with the amino acid type as shown in Figure 1. In Dtestset72 the range of MCC was from 0.079 to 0.228 (F-measure 16.0% to 32.8%) and in PDBtestset164 the MCC values ranged from 0.012 to 0.174 (F-measure 18.2% to 35.5%). Then, to understand if certain groups of amino acids were preferred over others in these sites, we grouped these residues under Hydrophobic (Alanine, Isoleucine, Leucine, Methionine, Valine and Cysteine), Polar (Asparagine, Glutamine, Serine and Threonine), Charged (Histidine, Lysine, Arginine, Aspartate and Glutamate) and Aromatic (Phenylalanine, Tryptophan and Tyrosine); and explored their relative prediction performance which is shown in Table 3.
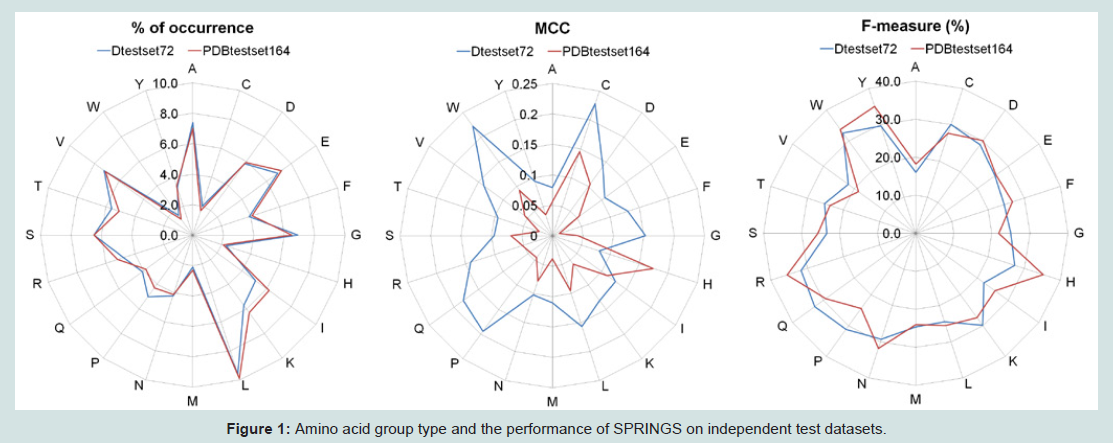
Figure 1: Different amino acid groups and prediction performance of SPRINGS on independent test datasets.
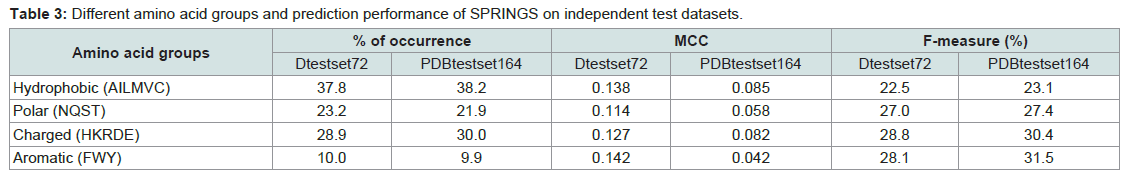
Table 3: Details for patients undergoing laparoscopic procedure.
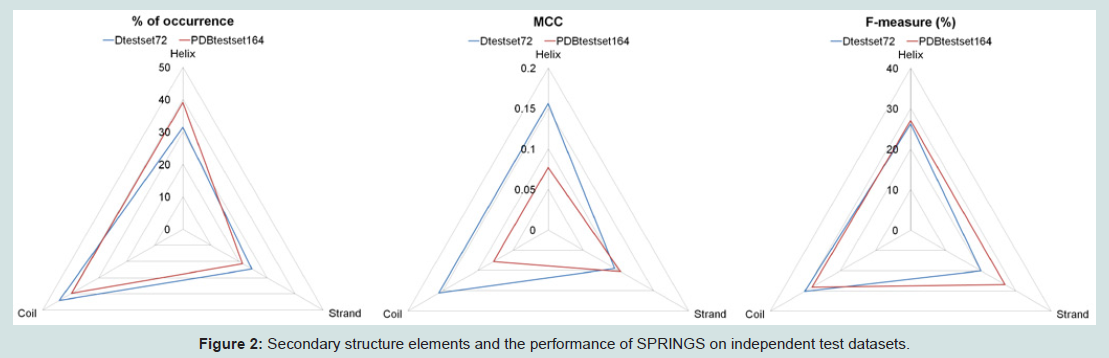
Figure 2: Secondary structure elements and the performance of SPRINGS on independent test datasets.
Development of an effective computational approach requires objective comparison of the newly proposed method with previously reported solutions. As already stated in these studies, on account of difference in datasets, definitions of problems and approaches, a direct comparison with the performance published in the literature is nearly impossible [7]. However, a purposeful performance analysis of various predictors for protein-protein interaction sites was done to gain insights into the prediction power of our developed method. Since, MCC is considered to be the best assessor for the overall performance in machine learning, representing how well predictions correlate with observed class labels [27] we assessed SPRINGS, LORIS, PSIVER, ISIS and SPPIDER based on MCC values.
The performance of SPRINGS was compared with the four above mentioned servers, i.e., LORIS, PSIVER, ISIS and SPPIDER on Dtestset72 which was divided into three categories namely the rigid body cases, the medium cases and the difficult cases [7]. SPRINGS achieved an MCC of 0.167 and an F-measure of 31.3% in case of the rigid body cases; an MCC of 0.197 and an F-measure of 33.7% in case of medium cases; and an MCC score of 0.142 and F-measure of 32.8% for the difficult cases. The assessment parameters obtained with LORIS, PSIVER, ISIS and SPPIDER are shown in Table 1 for comparative analysis.
Following Dtestset72, comparative analysis of SPRINGS was carried out on PDBtestset164 with LORIS and PSIVER which outperformed other methods ISIS and SPPIDER (Table 2). The MCC score and F-measure obtained by SPRINGS was 0.108 and 31.1% whereas for LORIS and PSIVER the values were (0.111 and 32.3%) and (0.078 and 29.5%) respectively.
Discussion
This article presents a novel computational approach (SPRINGS) using artificial neural networks for predicting protein-protein interaction sites based on evolutionary conservation, averaged cumulative hydropathy and predicted relative solvent accessibility of protein sequences. Training of the neural networks was done on Dset186 containing filtered protein chains from PDB. Performance assessment of the trained neural network was done using LOOCV and then testing was performed on independent test datasets Dtestset72 and PDBtestset164. Summary of prediction results indicated that the performance of SPRINGS was encouraging with an overall MCC of 0.170, comparable with LORIS, and outperforming existing approaches such as PSIVER, SPPIDER and ISIS. Further, among the categories of rigid body, medium cases and difficult cases, the overall performance of SPRINGS closely followed LORIS but was observed to be better than others. Since a few residues in proteinprotein interfaces are isolated, one can filter the raw predictions by simply omitting isolated predictions [7,8]. It must be noted here that Dtestset72 and PDBtestset164 were created on the assumption that any residue not observed in the given complexes is treated as negative. Therefore, it might be possible that the selected datasets may still have additional protein–protein interaction sites; affecting the performance of the methods, overall extending scope for advanced research in protein interaction biology.However, to understand the prediction performance of SPRINGS at a greater depth in the current scenario, we explored few possible factors which might have an influence on the identification of interacting residues, such as protein sequence length, amino acid type and secondary structure in the independent test datasets. Ourfindings suggested that the length of protein sequences had no clear influence on the prediction. For the short length proteins, there was no significant bias with respect to the percentage presence of protein-protein interaction sites. However, for long length proteins, the performance of SPRINGS was positively influenced (Pearson’s Correlation Coefficient = 0.4). Also, there was no specific or significant bias noticed in the prediction performance of SPRINGS whether it was regarding type of amino acids or secondary structure element.
As per the existing knowledge and approaches, SPRINGS, following LORIS and closely followed by PSIVER could also help in the recognition of protein-protein interacting sites. As of now, the proposed method may successfully provide experimental biologists an aid to correctly identify potential interacting residues in uncharacterized proteins. This sequence based approach with its unique learning process, is likely to utilize important protein properties such as evolutionary conservation, averaged cumulative hydropathy and predicted relative solvent accessibility over previously reported methods. Further, information on protein structures may be used to complement prediction of SPRINGS for reliable identification of protein-protein interaction sites. The findings of our study are likely to boost studies based on targeted mutation, drug development and enzymes for various profitable biotechnological applications. In future, the potential of introducing other biologically meaningful properties such as sequence order effect and additional physicochemical properties for prediction of proteinprotein interaction sites by SPRINGS would be an interesting area of research.
Standalone package availability
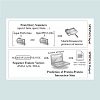
Given the significance of protein interactions with other proteins in biological processes and growing needs for their functional annotations, rapid and accurate standalone softwares are desirable for assisting experimental studies or research applications. Based on our current findings, we contribute a freely available user-friendly package of Python codes for generation of sequence feature vectors and identification of interacting residues along with an easy-tounderstand user manual. The outline of our prediction approach is shown in Figure 3. Input files of PSSM and PRSA from sequence(s) of interest, the query(s), are required to be provided by the user intothe prediction algorithm. These can be generated from softwares such as NCBI PSI-BLAST and Sann web server. Our execution programsfirst check for the availability of both the input files corresponding to a particular protein sequence of interest; followed by deriving of hydropathy properties from the sequence(s) using in-house Python codes. SPRINGS then processes these features using GNU Octave and offers prediction. Output files are generated in two formats: filename.vsprings (vertical) and filename.hsprings (horizontal), to facilitate easy as well as detailed results interpretation.
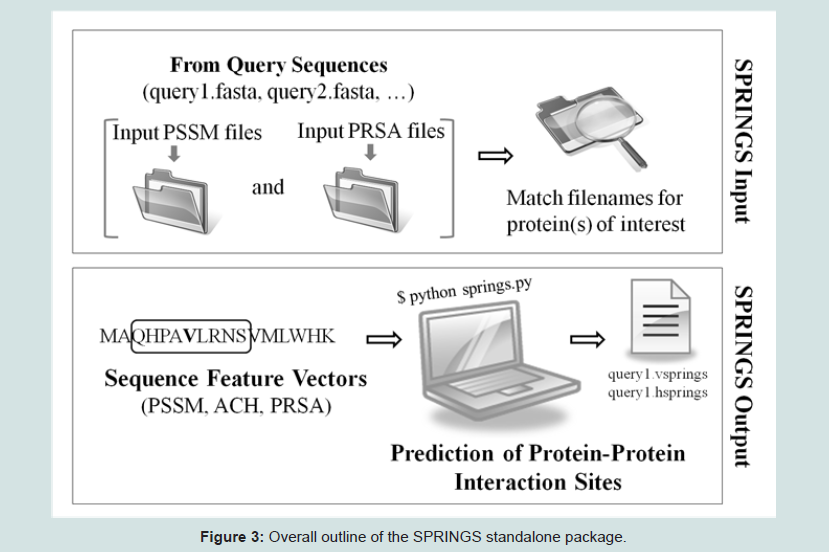
Figure 3: Overall outline of the SPRINGS standalone package.
Conclusion
The challenging problem of protein-protein interaction sites identification requires diverse all-encompassing approaches including significant properties of constituting amino acids. SPRINGS is a novel sequence-based method using Neural Networks, with a promising prediction performance in most cases of protein-protein interaction sites. With our findings, we hope to assist biologists in identifying potential interacting residues even in cases of complex protein-protein interactions. Our approach is available as a freely available user-friendly standalone package with relevant information at http://sites.google.com/site/predppis/. Overall, our contribution is targeted at offering directed solutions or at the least pointers, as a complementary approach for solving various fundamental challenges in protein interaction biology.Acknowledgements
Authors thank BITS-Pilani, K. K. Birla Goa Campus, for providing the necessary support towards conducting of this research.References
- Lewis AC, Saeed R, Deane CM (2010) Predicting protein-protein interactions in the context of protein evolution. Mol Biosyst 6: 55-64.
- Skrabanek L, Saini HK, Bader GD, Enright AJ (2008) Computational prediction of protein-protein interactions. Mol Biotechnol 38: 1-17.
- Fry DC (2006) Protein-protein interactions as targets for small molecule drug discovery. Biopolymers 84: 535-552.
- Moreira IS, Fernandes PA, Ramos MJ (2006) Unraveling the importance of protein-protein interaction: application of a computational alanine-scanning mutagenesis to the study of the IgG1 streptococcal protein G (C2 fragment) complex. J Phys Chem B 110: 10962-10969.
- Dosztanyi Z, Meszaros B, Simon I (2009) ANCHOR: web server for predicting protein binding regions in disordered proteins. Bioinformatics 25: 2745-2746.
- Valencia A, Pazos F (2005) In: Structural Bioinformatics. (Ed: Bourne PE and Weissig H) John Wiley and Sons: New Jersey
- Murakami Y, Mizuguchi K (2010) Applying the Naïve Bayes classifier with kernel density estimation to the prediction of protein-protein interaction sites. Bioinformatics 26: 1841-1848.
- Ofran Y, Rost B (2007) ISIS: interaction sites identified from sequence. Bioinformatics 23: e13-16.
- Porollo A, Meller J (2007) Prediction-based fingerprints of protein-protein interactions. Proteins 66: 630-645.
- Sikić M, Tomić S, Vlahovicek K (2009) Prediction of protein-protein interaction sites in sequences and 3D structures by random forests. PLoS Comput Biol 5: e1000278.
- Dhole K, Singh G, Pai PP, Mondal S (2014) Sequence-based prediction of protein-protein interaction sites with L1-logreg classifier. J Theor Biol 348: 47-54.
- Berman HM, Westbrook J, Feng Z, Gilliland G, Bhat TN, et al. (2000) The Protein Data Bank. Nucleic Acids Res 28: 235-242.
- UniProt Consortium (2013) Update on activities at the Universal Protein Resource (UniProt) in 2013. Nucleic Acids Res 41: D43-D47.
- Laskowski RA (2009) PDBsum new things. Nucleic Acids Res 37: D355-D359.
- Kozma D, Simon I, Tusnády, GE (2013) PDBTM: Protein Data Bank of transmembrane proteins after 8 years. Nucleic Acids Res 41: D524-D529.
- Altschul SF, Gish W, Miller W, Myers EW, Lipman DJ (1990) Basic local alignment search tool. J Mol Biol 215: 403-410.
- Mihel J, Šikić M, Tomić S, Jeren B, Vlahoviček K (2008) PSAIA – protein structure and interaction analyzer. BMC Struct Biol 8: 21.
- Viklund H, Bernsel A, Skwark M, Elofsson A (2008) SPOCTOPUS: a combined predictor of signal peptides and membrane protein topology. Bioinformatics 24: 2928-2929.
- Basu S, Plewczynski D (2010) AMS 3.0: prediction of post-translational modifications. BMC Bioinformatics 11: 210.
- Dou Y, Wang J, Yang J, Zhang C (2012) L1pred: a sequence-based prediction tool for catalytic residues in enzymes with the L1-logreg classifier. PLoS One 7: e35666.
- Altschul SF, Madden TL, Schäffer AA, Zhang J, Zhang Z, et al. (1997) Gapped BLAST and PSI-BLAST: a new generation of protein database search programs. Nucleic Acids Res 25: 3389-3402.
- Camacho C, Coulouris G, Avagyan V, Ma N, Papadopoulos J, et al. (2009) BLAST+: architecture and applications. BMC Bioinformatics 10: 421.
- Kyte J, Doolittle RF (1982) A simple method for displaying the hydropathic character of a protein. J Mol Biol 157: 105-132.
- Joo K, Lee SJ, Lee J (2012) Sann: solvent accessibility prediction of proteins by nearest neighbor method. Proteins 80: 1791-1797.
- Klose DP, Wallace BA, Janes RW (2010) 2Struc: the secondary structure server. Bioinformatics 26: 2624-2625.
- Kabsch W, Sander C (1983) Dictionary of protein secondary structure: pattern recognition of hydrogen-bonded and geometrical features. Biopolymers 22: 2577-2637.
- Baldi P, Brunak S, Chauvin Y, Andersen CA, Nielsen H (2000) Assessing the accuracy of prediction algorithms for classification: an overview. Bioinformatics 16: 412-424.