
Research Article
*Address for Correspondence: S. Sivajothi, College of Veterinary Science, Proddatur, Sri Venkateswara Veterinary University, Andhra Pradesh, India, E-mail: sivajothi579@gmail.com
Citation: Reddy BS, Sivajothi S. Electrocardiographic Parameters of Normal Dairy Cows during Different Ages. J Veter Sci Med. 2016;4(1): 5.
Copyright © 2016 Sivajothi S, et al. This is an open access article distributed under the Creative Commons Attribution License, which permits unrestricted use, distribution, and reproduction in any medium, provided the original work is properly cited.
Reviewed & Approved by: Dr. Julie Gard, Department of Clinical Sciences, Auburn University College of Veterinary Medicine, USA
Journal of Veterinary Science & Medicine | ISSN: 2325-4645 | Volume: 4, Issue: 1
Submission: 25 April, 2016 | Accepted: 20 June, 2016 | Published: 25 June, 2016
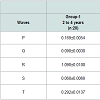
The amplitude of ‘P’ wave was positive in all the groups and itwas 0.169, 0.171 and 0.180 millivolts in group-1, group-2 and group-3 of cattle respectively. The amplitude of ‘Q’ wave was positive in all the groups and it was 0.090, 0.100 and 0.095 millivolts in group-1, group-2 and group-3 of cattle respectively. The amplitude of ‘R’ wavewas negative in all the groups and it was 1.09, 1.15 and 1.18 millivolts in group-1, group-2 and group-3 of cattle respectively. The amplitude of ‘S’ wave was positive in all the groups and it was 0.06, 0.07 and 0.07 millivolts in group-1, group-2 and group-3 of cattle respectively.The amplitude of ‘T’ wave was positive in most of the animals and few were biphasic and it was 0.292, 0.320 and 0.345 millivolts in group-1, group-2 and group-3 of cattle respectively. The mean values of ventricular depolarization, represented by the QRS complex amplitude, were higher than the goats in this region. In the present study, the low-amplitude ‘R’ waves observed were probably due to well synchronized ventricular depolarization [3].
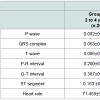
The duration of mean ‘P’ wave was 0.082, 0.082 and 0.083 sec in group-1, group-2 and group-3 of cattle, respectively. The mean duration of ‘QRS’ complex was 0.063, 0.064 and 0.066 sec in group-1, group-2 and group-3 of cattle, respectively. The mean duration of ‘T’ wave was 0.086, 0.086 and 0.088 sec in group-1, group-2 and group-3 of cattle, respectively. The duration of ‘P’ wave, ‘QRS’ complex and ‘T’ wave in the cattle were similar to the reports in other studies in the world [8].
Electrocardiographic Parameters of Normal Dairy Cows during Different Ages
B. Sudhakara Reddy1, S. Sivajothi2*
- 1Teaching Veterinary Clinical Complex (Veterinary Medicine), College of Veterinary Science, Proddatur 516360, Sri Venkateswara Veterinary University, Andhra Pradesh , India
- 2Department of Veterinary Parasitology, College of Veterinary Science, Proddatur 516360, Sri Venkateswara Veterinary University, Andhra Pradesh , India.
*Address for Correspondence: S. Sivajothi, College of Veterinary Science, Proddatur, Sri Venkateswara Veterinary University, Andhra Pradesh, India, E-mail: sivajothi579@gmail.com
Citation: Reddy BS, Sivajothi S. Electrocardiographic Parameters of Normal Dairy Cows during Different Ages. J Veter Sci Med. 2016;4(1): 5.
Copyright © 2016 Sivajothi S, et al. This is an open access article distributed under the Creative Commons Attribution License, which permits unrestricted use, distribution, and reproduction in any medium, provided the original work is properly cited.
Reviewed & Approved by: Dr. Julie Gard, Department of Clinical Sciences, Auburn University College of Veterinary Medicine, USA
Journal of Veterinary Science & Medicine | ISSN: 2325-4645 | Volume: 4, Issue: 1
Submission: 25 April, 2016 | Accepted: 20 June, 2016 | Published: 25 June, 2016
Abstract
Electrocardiograms were recorded from 60 clinically apparently healthy cross bred cattle in Andhra Pradesh of India. Cattle were divided into 3 groups based on their age i.e. cattle between 2 to 4 years age, 4 to 6 years age and 6 to 8 years age. The electrocardiograms were recorded on a bipolar base apex lead, using limb lead I. The duration and amplitude of the ‘P’ wave, ‘QRS’ complexes, ‘T’ wave and the P-R, Q-T intervals and ST segment were measured in traced electrocardiograms. The value of ST segment in adults was significantly higher than young cattle, but the amount of ‘R’ wave and ‘T’ wave amplitudes in younger animals were significantly lower than older animals (P<0.05).Keywords
Andhra Pradesh; Base apex lead; Cattle; ECG; IndiaIntroduction
Electrocardiography is an inexpensive, non invasive technique that entails useful information in classification of arrhythmias, diagnosing conduction abnormalities and also acts as a valuable aid in prognostic and therapeutic considerations. The base apex lead has been used and it is shown to be an appropriate lead in large animal [1]. Some cardiac abnormalities and arrhythmias are detectable by recording an electrocardiogram (ECG) and measuring the amplitudes, durationsand intervals in the traced ECG. Recordings of the ECG are also help full to assess the extent of cardiac muscle damage or any systemic involvements [2]. Compared with the numerous data available in the equine and the canine species, electrocardiography has been scarcelyutilized and little information is available in ruminants in India [3]. Recently, studies have been performed to investigate the normal ECG values in sheep, goats and in turkeys [4-6]. Therefore, this study was undertaken to record the ECG in apparently clinically healthy cross breed cattle at different age groups utilizing the ‘Base-Apex’ ECG lead system in Andhra Pradesh of India.Materials and Methods
The present study was conducted at Proddatur of Andhra Pradesh, India. All apparently healthy cross breed cattle over two years of age were used for ECG recording, irrespective of pregnancy and lactation status. Age of the cattle was determined by the owner’s history and dentition of the individual cattle. None of the cattle used in this study had any clinical signs of respiratory, heart diseases and other systemic problems. The ECG was recorded in the morning between 9 am to 12 pm without any disturbance to the cattle. Each animal was placed in stocks and given at least 5 to 10 minutes to acclimate and the base apex bipolar lead was used for the recording. Alligator clips of electrodes were attached to the skin after cleaning the area with alcohol and applying ECG jelly. The positive electrodewas attached to the skin over the left fifth intercostal space just posterior to the olecranon and the negative electrode was place over the jugular furrow about the level of the lower 1/3 of the neck. The earth electrode (ground) was attached to the skin away from the other electrodes. The ECG was recorded for 3 to 5 minutes with the animal in a relaxed state [1,7]. All ECGs were recorded on a three channel electrocardiographic machine (Marks electronics, Chennai) with thepaper speed of 25 mm/sec and calibration of 10 mm equal to 1 mV. Heart rate was calculated according to the RR interval in lead-1 and expressed in beats per minute (bpm). Amplitude of ‘P’, ‘Q’, ‘R, ‘S’ and ‘T’ waves was recorded for Lead 1 and expressed in millivolts (mV). Duration of ‘P’ wave, ‘QRS’ complex, P-R interval, ST segment and ‘T’ wave was calculated and expressed in seconds. The data was analyzed by using SPSS software. All values were expressed as mean ± standard error of mean. Cattle were divided into three groups based on the age of animals. The animals between 2 to 4 years were included in group-1, age between 4 to 6 years was included in group-2 and animals between 6 to 8 years were included in group-3. A one way ANOVA was carried out between the three groups to determine the significance at 95% confidence level.Results and Discussion
The normal electrocardiograms of healthy cattle were presented in Tables 1 and 2. ECG recordings in different age group of cattle were presented in (Figures 1-3). Mean heart rate of the cattle in group-1, group-2 and group-3 was 71.45, 65.25 and 61.99 bpm.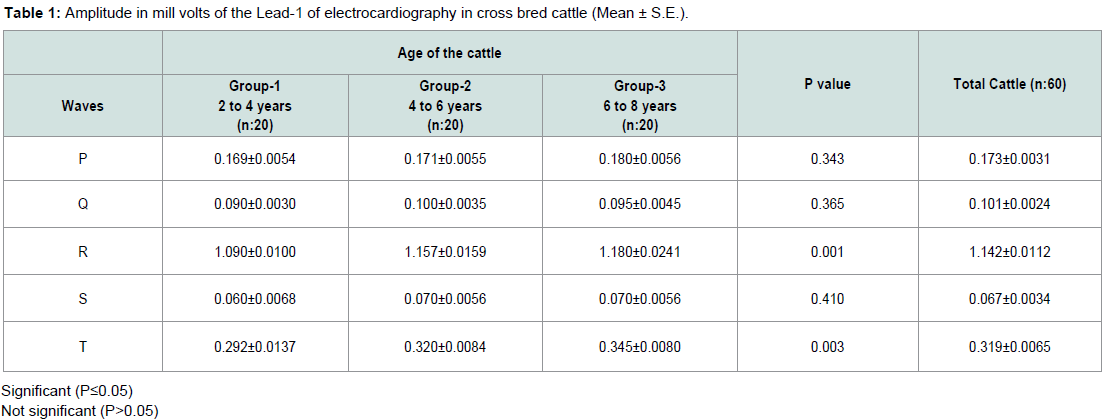
Table 1: Amplitude in mill volts of the Lead-1 of electrocardiography in cross bred cattle (Mean ± S.E.).
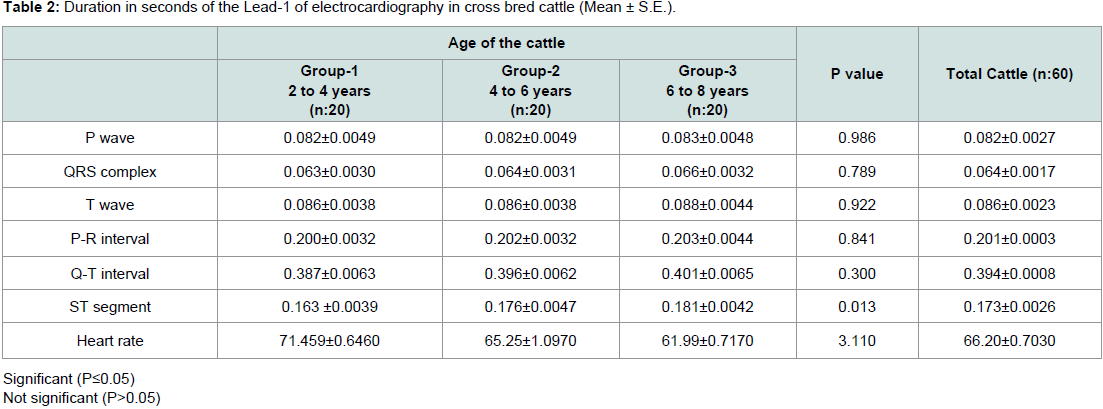
Table 2: Duration in seconds of the Lead-1 of electrocardiography in cross bred cattle (Mean ± S.E.).
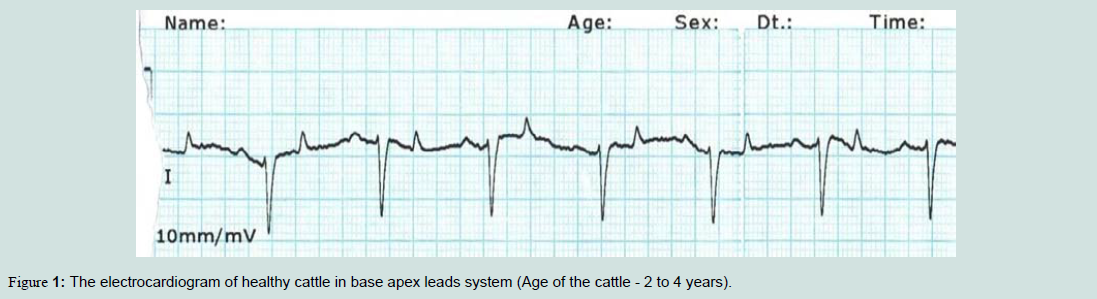
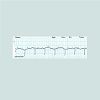
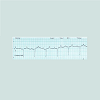
Figure 1: The electrocardiogram of healthy cattle in base apex leads system (Age of the cattle - 2 to 4 years).
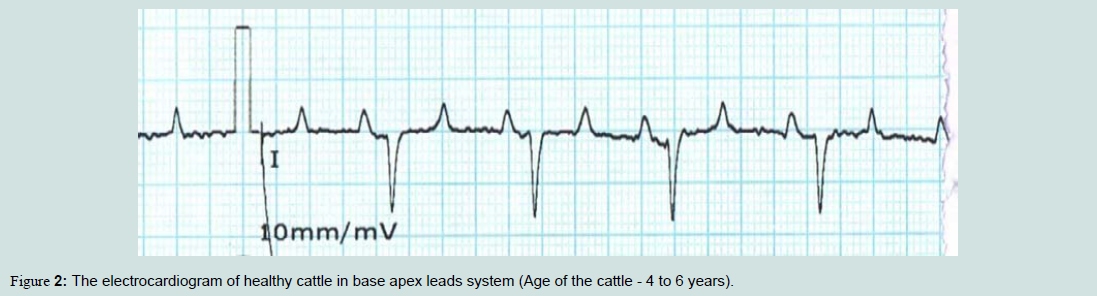
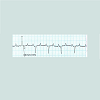
Figure 2: The electrocardiogram of healthy cattle in base apex leads system (Age of the cattle - 4 to 6 years).
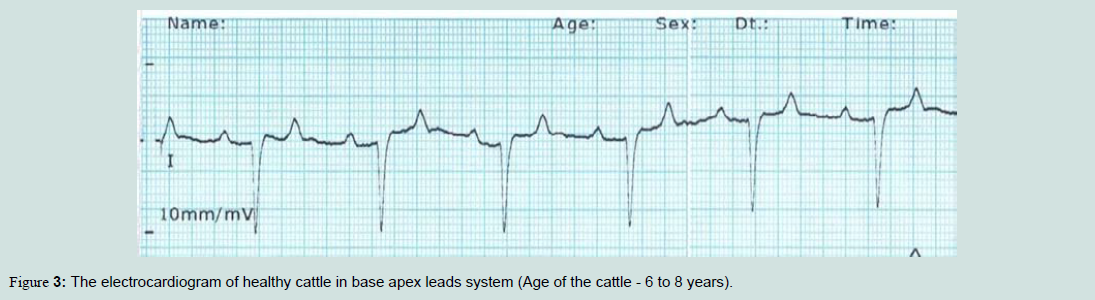
Figure 3: The electrocardiogram of healthy cattle in base apex leads system (Age of the cattle - 6 to 8 years).
The P-R interval is, representative of the time interval between atrial and ventricular depolarization. The Q-T interval is which begins with the onset of ventricular depolarization and ends with the completion of ventricular repolarization. The mean P-R interval was .200, 0.202 and 0.203 sec in group-1, group-2 and group-3 of cattle, respectively. Q-T interval was 0.387, 0.396 and 0.401 sec in group-1, group-2 and group-3 of cattle, respectively. These findings of the P-R interval and Q-T interval are very similar to the findings of Rezakhani et al. [9]. Much information was not available on the S-T segment in cattle with the base apex lead system. In this research we recorded ST segment was 0.163, 0.176 and 0.181 sec in group-1, group-2 and group-3 of cattle, respectively.
Mean values of the ECG findings recorded in all the cattle (N=60) are as follows. Mean amplitude of the ‘P’ wave, ‘Q’ wave, ‘R’ wave, ‘S’ wave and ‘T’ wave was 0.173, 0.101, 1.142, 0.067 and 0.319 millivolts, respectively. Mean duration of the P, QRS, T, P-Rinterval, Q-T interval, ST segment and heart rate was 0.082, 0.064, 0.086, 0.201, 0.394, 0.173 and 66.20 respectively. These findings were in collaboration with the previous workers. In this present study, the T wave, S-T segment and heart rate were lower than the adult goats in this region [3].
The present findings were compared with previous study of Rezakhani et al. [10]. The P wave, QRS wave, T wave, P-R interval, Q-T interval duration was in accordance with the previous findings. The results of the present study evaluating Holstein cattle showed that some parameters changed during aging. Some parameters increasedand some of them decreased. With advancing age, degenerative changes occur in heart muscle and its conduction system. Some of the pathways of the pacemaker system may develop fibrous tissue and fat deposits [11].
In the present study, amplitudes in younger animals were higher than in adults (Figure 1). It may be suggested that the thinner chest wall in young animals allows the fast transmission of cardiac electrical waves to electrocardiographic equipment. The conductive properties of the body mass of ruminants, attributable to the volume of the gastrointestinal tract, also influence the distribution of body surface potentials comprising the ECG [12].
During aging heart became larger in size and transmission of cardiac electrical activity increases. Due to presence of the deep penetrating Purkinje system, depolarisation from ventricular endocardium to epicardium occurs suddenly at once in manydirections in ruminants [13]. Present study indicated that the values of ‘R’ wave and ‘T’ wave amplitude and ST segment were significantly higher in older animals than younger ones, which may probably be due to the larger size of the heart in older cows.
Different histological changes in conduction system can be seen with advancing of age. These changes include several features of ECG, which includes duration of the P-R and Q-T intervals and morphologyof the atrial and ventricular complexes. The gradual increase in the vagal tone due to aging results unchanged in the P-R interval which can be recorded. During ECG acquisition young animals are anxious and can cause artifactual decrease in the R-R interval [11]. Atrioventricular conduction is accessed via the P-R interval. Physiological prolongation of the P-R interval suggests conduction delay within the atrioventricular node. The large mass of cardiac musculature in adult cattle causes delay in the heart conductionsystem [1]. The QRS duration in young animals is shorter than that of adults, once again, because of smaller cardiac muscle mass. The Q-T interval, measured from the beginning of the QRS complex to the termination of the T wave, represents ventricular activity. Macfarlane et al. reported that the Q-T interval increased during aging in human beings, which is also seen in aging cattle according to the present results [14]. Present results according with the previous studies on healthy lactating cows [10].
In the study of Pourjafar et al. the values of the ST segment duration of the base apex lead in different ages are similar to the findings of our study [8]. The correlation coefficient between the QTinterval and the heart rate was negative in this study, which indicates the negative correlation between the individual animals at different age levels (CC=0.089). Significant variations between the different age groups was observed in the ‘R’ wave, ‘T’ wave amplitude and duration of ST segment (P<0.05). In the Other ECG parameters some variation was recorded but, it was not determined to be statistically significant.
Conclusions
In the present study, electrocardiographic parameters during the different age groups of cattle were carried out on the cross bred cattle in Andhra Pradesh of India. These findings will be continued to be utilized for comparison of normal and diseased cattle during clinical examinations.Acknowledgements
Corresponding author would like to express his thanks and gratitude to Dr. K. Nalini Kumari, Professor and University Head, Dept. of Veterinary Medicine, S.V.V.U. for clarification of doubts during the study period. All the authors are thankful to Sri Venkateswara Veterinary University for providing facilities to carry out this work.References
- Radostits OM, Gay CC, Hinchcliff KW, Constable PD (2009) Veterinary medicine: a text book of the diseases of cattle, horses, sheep, pigs and goats, (10thedn), WB Saunders Co, USA.
- Jackson PG, Cockroft PD (2002) Clinical examination of farm animals. Blackwell Science Ltd, UK.
- Reddy BS, Reddy LS, Raju KG, Sivajothi S (2014) Electrocardiographic studies in adult Osmanabadi goats. J Vet Sci Photon 115: 333-337.
- Mendes LC, Camacho AA, Alves AL, Borges AS, Souza RC, et al. (2001) Standard electrocardiographic values in Holstein calves. Arq Bras Med Vet Zootec 53: 641-644.
- Reddy BS, Venkatasivakumar R, Sivajothi S, Reddy YV (2014) Electrocardiographic abnormalities in young healthy sheep and goats. Int J Biol Res 2: 21.
- Reddy BS, Reddy PA, Venkatasivakumar R, Reddy BS, Reddy ET (2016) A study on electrocardiographic patterns in Turkeys (Meleagris gallopavo). Int J Vet Sci 5: 79-82.
- Reddy BS, Venkatasivakumar R, Reddy LS, Vani S, Sivajothi S (2015) Analysis of base apex lead electrocardiograms of adult buffaloes. J Dairy Vet Anim Res 2: 00058.
- Pourjafar M, Badie K, Chalmeh A (2012) Evaluation of ST-segment duration and morphology of standard base apex lead electrocardiograms in different age groups of apparently healthy Holstein cattle. J Fac Vet Med Istanbul Univ 38: 51-57.
- Rezakhani A, Paphan AA, Shekarfroush S (2004) Analysis of base apex lead electrocardiogram of normal dairy cows. Veterinarski Arhiv 74: 351-358.
- Rezakhani A, Papahn AA, Gheisari HR (2004) Cardiac dysrhythmias in clinically healthy heifers and cows. Revue Méd Vét 155: 159-162.
- O'Connor M, McDaniel N, Brady WJ (2008) The pediatric electrocardiogram. Part I: Age-related interpretation. Am J Emerg Med 26: 221-228.
- Santamarina G, Espino L, Suarez ML (2001) Electrocardiographic parameters of free-ranging roe deer (Capreolus capreolus). J Zoo Wildl Med 32: 441-446.
- Pennisi DJ, Rentschler S, Gourdie RG, Fishman GI, Mikawa T (2002) Induction and patterning of the cardiac conduction system. Int J Dev Biol 46: 765-775.
- Macfarlane PW, McLaughlin SC, Devine B, Yang TF (1994) Effects of age, sex, and race on ECG interval measurements. J Electrocardiol 27 Suppl: 14-19.