
Research Article
*Address for Correspondence: Dewi YA, MD, FICS, Department of Otorhinolaryngology Head and Neck Surgery, Padjadjaran University/Hasan Sadikin General Hospital, Jl. Pasirkaliki No. 90, Bandung, West Java, Indonesia, Tel: +628112272773; E-mail: yussyad@yahoo.com
Citation: Dewi YA, Shahib MN, Boesoirie T, Achmad D. Studied of CD14 and CD15 Gene Expressions for Myeloid Derived Suppressor Cell Profile at the RNA Level as a Predictor for Progressivity in Nasopharyngeal Carcinoma. J Surgery. 2016;4(1): 6.
Copyright © 2016 Dewi YA, et al. This is an open access article distributed under the Creative Commons Attribution License, which permits unrestricted use, distribution, and reproduction in any medium, provided the original work is properly cited.
Journal of Surgery | ISSN: 2332-4139 | Volume: 4, Issue: 1
Submission: 20 November 2015 | Accepted: 27 January 2016 | Published: 01 February 2016
 CD14 and CD15 mRNA levels were evaluated in blood and tissue from 16 nasopharyngeal carcinoma patients using 2-ΔΔCt methods. All gene expression was –ΔCt varying from -0.93 to -2.01 in blood from early stage of NPC (Table 2). Whole sample for advanced stage were -ΔCt varying from -6.22 to -7.75. The gene expressions from early stage of nasopharyngeal carcinoma tissue were –ΔCt varying from -1.76 to -3.71. Otherwise for advanced stage of nasopharyngeal carcinoma tissues were –ΔCt varying from -4.06 to -4.75.
 MDSC then defined as average value of CD14 and CD15, analyzed by using Rank Spearman (r=0.858; p=0.0001).This indicated a statistically significantly and there was a strong correlation. It can be conclude that CD14 and CD15 were MDSC sub variable.
 MDSC appears to be due to immunosuppression of anti tumor effectors. Though the production or arginase-1 and iNOS among other factors, MDSC suppress the anti tumor functions of T and NK cell and secretion of MMP9 also increased the bioavailability of VEGF within the tumor [8,13,22]. Some MDSC are close proximity to tumor blood vessels and may either be in transit from a nearby vessel to hypoxic areas or actively retained in this area by unknown mechanism. Some MDSC change their shape into cells that resembled endothelial cells and also expressed such endothelial markers as CD31 and VEGFR2, suggesting that some MDSC have the potential to differentiate and incorporate into the tumor endothelium. MDSC contribute to tumor angiogenesis by secreting MMP and differentiating into endotheliallike cells [22].
Studied of CD14 and CD15 Gene Expressions for Myeloid Derived Suppressor Cell Profile at the RNA Level as a Predictor for Progressivity in Nasopharyngeal Carcinoma
Dewi YA1*, Elie Shahib MN2,Boesoirie T1 and AchmadD3
- 1Department of Otorhinolaryngology Head and Neck Surgery, Universitas Padjadjaran/Hasan Sadikin General Hospital, Indonesia
- 2Department of Biochemistry and Molecular Biology, Universitas Padjadjaran/Hasan Sadikin General Hospital, Indonesia
- 3Department of Surgery, Oncology Division, Faculty of Medicine Universitas Padjadjaran/Hasan Sadikin General Hospital, Indonesia
*Address for Correspondence: Dewi YA, MD, FICS, Department of Otorhinolaryngology Head and Neck Surgery, Padjadjaran University/Hasan Sadikin General Hospital, Jl. Pasirkaliki No. 90, Bandung, West Java, Indonesia, Tel: +628112272773; E-mail: yussyad@yahoo.com
Citation: Dewi YA, Shahib MN, Boesoirie T, Achmad D. Studied of CD14 and CD15 Gene Expressions for Myeloid Derived Suppressor Cell Profile at the RNA Level as a Predictor for Progressivity in Nasopharyngeal Carcinoma. J Surgery. 2016;4(1): 6.
Copyright © 2016 Dewi YA, et al. This is an open access article distributed under the Creative Commons Attribution License, which permits unrestricted use, distribution, and reproduction in any medium, provided the original work is properly cited.
Journal of Surgery | ISSN: 2332-4139 | Volume: 4, Issue: 1
Submission: 20 November 2015 | Accepted: 27 January 2016 | Published: 01 February 2016
Abstract
Background: Nasopharyngeal carcinoma (NPC) is a disease in which malignant cells formed in the tissue of the nasopharynx, which is a frequent cancer in Indonesia. Estimated of NPC in Indonesia at 6.2/100.000 or about 12.000 new cases per year. Developments of tumors are influenced by many factors, generally an interaction between genetic, environmental and immune system. There is a role of myeloid derived suppressor cells in the process of immune suppression.Objective: The aim of this study is to clarify the profile of MDSC encoded by CD14 and CD15 genes expression to find the predictor for progressivity of nasopharyngeal carcinoma. Peripheral blood specimen and biopsy from primary tumor were collected from 16 nasopharyngeal carcinoma patients. The samples collected underwent qRT-PCR. Data were analyzed by 2-ΔΔCt methods and statistical analysis.
Results: There were up regulation of CD14 and CD15 m-RNA level in blood at advanced stage (52.42 and 38.03) using 2-ΔΔCt methods. The expression of CD14 and CD15 genes was strongly correlated with clinical stage.
Conclusion: MDSC can be used as a predictor of progression in NPC.
Keywords
Myeloid derived suppressor cell; CD14; CD15; Nasopharyngeal carcinoma; 2-ΔΔCt Methods; qRT-PCR; Predictor of progressionIntroduction
Nasopharyngeal carcinoma (NPC) is a disease in which malignant cells formed in the tissue of the nasopharynx [1-4]. NPC is the most common malignancy in the head and neck and frequent cancer in Indonesia, rating as a fourth most common tumor of all malignancies. Overall incidence estimated of NPC in Indonesia at 6.2/100.000 or about 12.000 new cases per year [5].Frequent cases are progressive NPC at the time of diagnosis; NPC patients generally come with an advanced disease that gives unsatisfactory therapeutic result. Difficulties arising in the NPC after getting the full treatment are when there are residual or recurrent and distant metastases, consequently survivals of NPC will decrease. We’re looking for other tools for diagnosis, therapeutic efficacy, and predictor of progression based on the molecular pathogenesis.
Developments of tumors are influenced by many factors, generally an interaction between genetic, environmental, and immune system. There is a role of myeloid derived suppressor cells (MDSC) in the process of immune suppression.
Myeloid derived suppressor cells are a heterogeneous population of immature myeloid cells that are increased in states of cancer, inflammation, and infection with induced by tumor secreted growth factors in malignancy and play an important role in suppression of immune responses through several mechanisms such as production of arginase-1, release of reactive oxygen species (ROS) and nitric oxide (NO) and secretion of immune-suppressive cytokines [6]. This leads to a permissive immune environment necessary for the growth of malignant cells. MDSC may also contribute to angiogenesis and tumor invasion [6]. In the normal people, MDSC can be found in the bone marrow, whereas in pathologically states can be found in the spleen, blood circulation as much as 20-40%, tumor tissue, and lymph nodes [7-12].Morphologically, MDSC can be divided into two types, namely monocytic (MO)-MDSC and granulocytic/polymorph nuclear (PMN)-MDSC [7-9,12,13]. In Humans, CD15+ population in the peripheral blood circulation can identify MDSC [9]. In a healthy individual, immature myeloid cell (IMC) can be seen around 0.5% in peripheral blood mononuclear cells. Markers that typical for PMNMDSC is CD15 in blood circulation, while for MO-MDSC are CD14 [9,11,12,14,15].
Tumor progression due to tumor-derived factors (TDF) can be associated with severe progressive accumulation of IMC in the blood, lymph nodes, spleen, and primary tumor site. This aberrant balance between immature and mature myeloid cells is a hallmark of cancer and may be one of the central mechanisms of tumor evasion from the immune system and subsequent tumor progression [7]. Immature myeloid cells activations leads to up regulation of immune suppressive factors such as arginase (which is encoded by ARG1), induced nitric oxide synthase (iNOS, also known as NOS2), increases the production of NO and ROS. Then accumulations of MDSC migrate to secondary lymphoid organs and tissues (such as the region of tumor) [8,11,12,14].
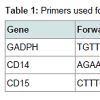
The aim of this study is to clarify the profile of MDSC encoded by CD14 and CD15 genes expression to find the predictor for progressivity of nasopharyngeal carcinoma. Here, we examined the circulating of MDSC in newly diagnosed in nasopharyngeal carcinoma correlated with clinical stage. We report a CD14 and CD15 gene expression at mRNA level isolated from blood and tumor of the nasopharyngeal carcinoma patients. All these gene expression were compared to the housekeeping gene, GADPH (Table 1). The GADPH was selected as an internal control gene because it’s relatively stable to microenvironment changes.
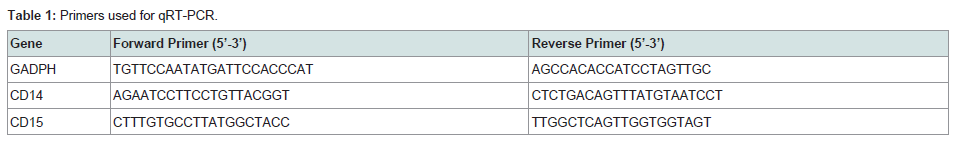
Table 1: Primers used for qRT-PCR.
Material and Methods
Clinical samplesPeripheral blood specimen and biopsy from primary tumor, collected from 16 nasopharyngeal carcinoma patients in oncology head and neck clinic, Department of Otorhinolaryngology Hasan Sadikin General Hospital Bandung, Indonesia with total numbers of samples were 32 (mean age 49.12; median 53; range 16-69; standard deviation + 14.98) with newly diagnosed and histopathology result were undifferentiated nasopharyngeal carcinoma. Early stage are stages I/II (n=8) and advanced stage are III/IV (n=8) in accordance with American Joint Committee on Cancer (AJCC) Cancer Staging Manual, 7th edition 2010. The numbers of male are 11 and women 5. All samples were collected after obtaining informed consent from the patient. Three cc of venous blood was collected in EDTA tube and tissue from biopsy were collected and transferred into sterile tubes containing RNA later solution (Ambion, USA). This study was approved by the Research Ethics Board of the Faculty of Medicine, Universitas Padjadjaran, Bandung Indonesia.
Samples were divided into four groups; group I were blood samples from early stage NPC patients; group II were tissue samples from early stage; group III were blood samples from advanced stage; and group IV were tissue from advanced stages NPC patients.
According to TNM classification with AJCC Cancer Staging Manual in nasopharyngeal carcinoma are for primary tumor (T); T1 (Tumor confined to the nasopharynx; T2 (Tumor extends to soft tissue), T2a (Tumor extends to the oropharynx and/or nasal cavity without parapharyngeal extension, T2b (any tumor with parapharyngeal extension); T3 (tumor involves bony structures and or/paranasal sinuses); T4 (tumor with intracranial extension and/ or involvement of cranial nerves, infratemporal fossa, hypopharynx, orbit, or masticator space). For regional lymph node (N); N0 (no regional lymph node metastasis); N1 (unilateral metastasis in lymph node, 6cm or less in greatest dimension, above the supraclavicular fossa; N2 (bilateral metastasis in lymph node, 6 cm or less in greatest dimension, above the supraclavicular fossa; N3 (metastasis in a lymph node >6cm and/or to supraclavicular fossa, N3a (greater than 6cm in dimension), N3b (extension to the supraclavicular fossa). For distant metastasis (M); M0 (no distant metastasis); M1 (distant metastasis) [16].
RNA isolation
RNA was extracted from the tumor tissue and blood samples by the method of Trizol reagent (Invitrogen, USA). The homogenized solution was centrifuged at 12.000-14.000 g using column tube according to manufacturer’s instructions. RNA pellets were recovered and purified by phenol-chloroform extraction and ethanol precipitation and underwent conventional RT-PCR (Promega, USA).
Quantitative real time polymerase chain reaction (qRTPCR)
qRT-PCR was performed using the Universal one-step qRT-PCR kit according to the manufacturer’s instructions (Kapa Biosystems, USA), using forward and reverse primer for human flyceraldehyde- 3-phosphate dehydrogenase (GADPH), CD14, and CD15 (Table 1). The qRT-PCR reaction was subjected to reverse transcription (RT) for 5 minutes at 42 °C, followed by enzyme inactivation at 95 °C for 3 minutes, and the cycle of PCR for 40 cycles at 95 °C for 3 second (denaturation), 60 °C >20 second for (annealing) and 72 °C for 20 second (extension data acquisition). All reactions were run in duplicate. The result can be seen in the form of threshold cycle (Ct curves), by applying the relative changes in targeting genes expression [17-19]. Ct (Cycle of threshold) is reported as the PCR cycle number that crosses an arbitrarily placed signal threshold. The average Ct was calculated for both targets gene and internal control (GADPH) and the ΔCt were equal to the difference in the threshold cycles for target and GADPH (Ct target-Ct GADPH). Categorized the Ct values varying from 15 to 40 (score 1 to 5); 15-20 was very high expression (score 5); >20-25 (score 4) was high expression; >25-30 was moderate expression (score 3); >30-35 was low expression (score 2); >35-40 was very low expression (score1) [18].
Data analysis
qRT-PCR was analyzed by calculating the fold difference individually for each gene. Cycle threshold (Ct) is defined as the number of PCR cycles at which the fluorescence signal rises above the threshold value and is inversely propositional to the amount of template present in the reaction.
The 2-ΔΔCtt methods used to calculate relative changes in gene expression determined from qRT-PCR. The data were analyzed using ΔΔCt = (Ct.target-CtGADPH)time x – (Ct.target-CtGADPH)time 0. Time x is any time point any time0 represents the 1x expression of the target gene normalized to GADPH. The mean Ct values for both the target and control genes were determined at time zero and were used in Eq. The mean and SD are then determined from the samples at each time point [18,19].
Statistical analysis
Statistical data were converted to the linear form by the ΔCt calculations. Rank Spearman was used to evaluate the association between two variables CD14 and CD15 with MDSC. This analysis used to find the correlations between CD14 and CD15 genes expressions with age, gender, and clinical stage of nasopharyngeal carcinoma. Comparison between MDSC to early and advanced stage from blood and tumor were performed using the Mann-Whitney U test. A p-value <0.05 was considered significant. Statistical test were performed using the software SPSS version 21 (SPSS Inc., Chicago, Illinois).
Results and Discussion
ResultsIn order to obtain an accurate determination of MDSC in nasopharyngeal carcinoma patients, whole blood and tissue from biopsy examined with quantitative qRT-PCR. Freshly drawn whole blood and tissue from patients was therefore labeled with CD14 and CD15 for myeloid marker and GADPH by analysis the mRNA transcripts. The mRNA transcripts were determined by Real-Time PCR, which identified 32-gene expression. The mean Ct values for four group I, II, III, and IV were determined and the amount of the transcripts = 2-ΔΔCt.
For AJCC clinical stage I, there was one patient. While for stage II were seven patients, stages III were two patients, and stages IV were six patients. For N classification, there were two patients for NO, eight patients for N1, two patients for N2, and four patients for N3. For T classifications T1 there were two patients, while for T2 classifications were eight patients, one patient for T3 and five patients for T4 classification.
The order of two targeting genes was placed in the order from lower to highest base on their Ct values compared to GADPH. The ΔCt value that was lower than GADPH was placed in a group of negative ΔCt (-ΔCt). –ΔCt suggested a higher expression than GADPH. Calculation of data was adapted from Shahibet all (2015). ΔΔCt =ΔCt (target gene) – ΔCt (GADPH). The mean Ct values for both peripheral blood and tissue from early and advanced stage of NPC were determined and the amount of the transcripts = 2-ΔΔCt.
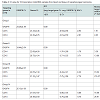
The mRNA expression in nasopharyngeal carcinoma patients was determined by Real-time PCR, which identified 2 genes expressions CD 14 and CD15 from early and advanced stage NPC patients and data evaluation results in Ct values. In Table 2, the variation of gene expression was divided into 5 scores of Ct value. These Ct values were then further categorized (Table 2). The higher score value, the higher gene expression level. Our results showed that the expression levels of CD14 and 15 in blood and tissue from early and advanced stage were high with the score of expression were four.
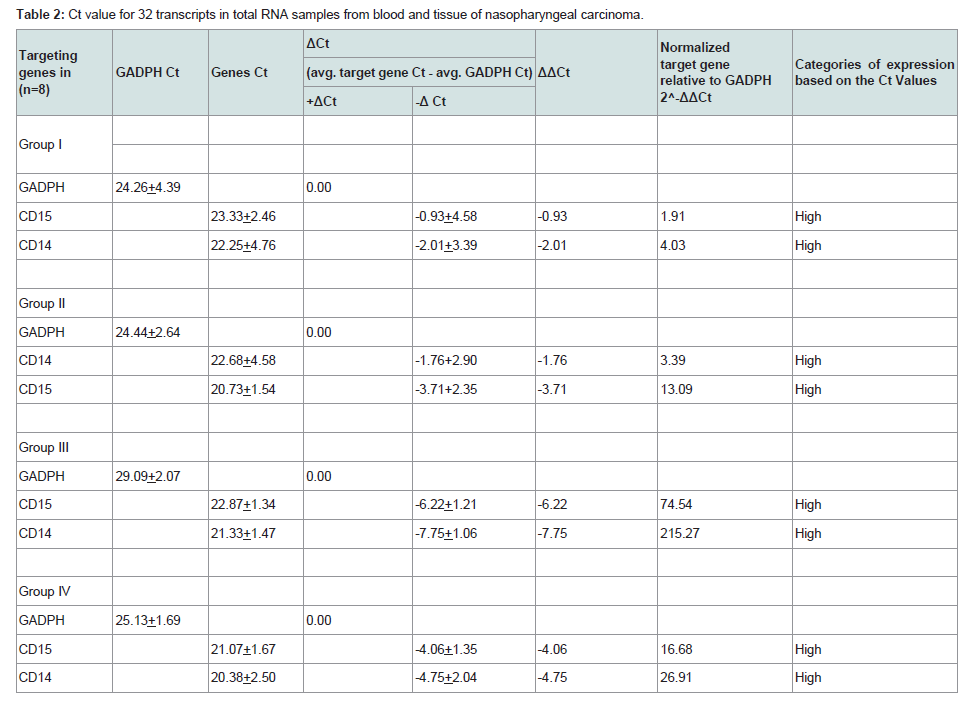
Table 2: Ct value for 32 transcripts in total RNA samples from blood and tissue of nasopharyngeal carcinoma.
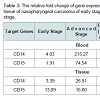
The profile of CD14 and CD15 gene expressions were increased 52.42 and 38.03 in blood of advanced stage of nasopharyngeal carcinoma. The fold increased of CD14 and CD15 in tissue of advanced stage were 6.94 and 0.28. There were increased values of mRNA level in advanced stage of all genes. All gene were up regulated, the remaining CD14 and CD15 in blood were significant different (Table 3).
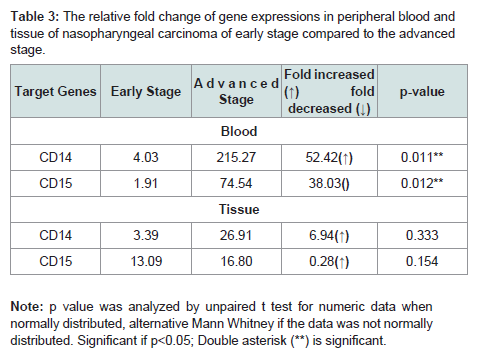
Table 3: The relative fold change of gene expressions in peripheral blood and tissue of nasopharyngeal carcinoma of early stage compared to the advanced stage.
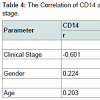
No significantly correlation was detected between CD14 and age (r=0.203; p=0.320). CD14 were significantly related to gender (r=-0.224; p=0.022) and clinical stage (r=-0.601; p=0.001) with Rank- Spearman correlation analysis. No significantly correlation was detected between CD15 and gender (r=0.234; p=0.215). CD15 were significantly related to age (r=-0.418; p=0.034) and clinical stage (r=-0.206; p=0.031) with Rank-Spearman correlation analysis (Table 4).
The median of MDSC level for early stage blood was -2.85, and advanced stage was -6.63. The difference between MDSC level in blood from early and advanced stage was significantly (p=0.0000). The difference of MDSC level in tissue in early and advanced stage were not significantly (p=0.090); median = -2.71 (early stage) and -5.00 (advanced stage).
The results of a statistical test between MDSC of early and advanced stage (n=16) regardless of samples source could be found that the median for early stage was -2.85, while the median for advanced stages is -5.78. It can be concluded that there are significantly differences between MDSC for early and advanced stage with p value 0.000. Within our own data we observed that patients with advanced stage tended to have the highest level of MDSC.
The correlations between MDSC in blood with clinical stage was strong (r= -0.879, P value=0.000). In tissue, MDSC expression correlated weak but positive with clinical stage (r= -0.388, p value=0.138). Based on statistical analysis, it can be concluded that MDSC expression in blood had strong correlation with clinical stage than in the tissue tumour.From logistic regression of multivariate analysis, MDSC could be used as predictors of progression of NPC.
Discussion
Analysis of early and advanced stage from 16 NPC patients was determined based on the 2-ΔΔCt methods varied from the lowest to highest expression. CD14 and CD15 gene expression were found higher in peripheral blood and tissue of NPC patients (Table 2). These results suggest that CD14 and CD15 genes are expressed in peripheral blood and primary NPC. Additional experiments showed that NPC tissue expressing CD14 and CD15 genes especially peripheral blood containing high level of mRNA as determined by RT-PCR suggesting that this gene is more widely expressed in peripheral blood NPC than tissue.
We found that patients with advanced stage had elevated number of circulating CD14 and CD15 (Table 3). Close correlation between advanced stage and circulating MDSC may play role in tumor invasion and metastasis. It means that MDSC in blood of nasopharyngeal carcinoma as one of critical players in mediating cancer immune evasion that suppressed T cell proliferation and cytokine production [11]. Similar to peripheral blood, we also found the markedly elevated level of MDSC in tumor tissues of advanced stage compared to early stage of NPC but did not reach the significantly level.
The CD14 and CD15 genes expression was significantly correlated with clinical stage in NPC patients (Table 4). Several studies have revealed a relationship between MDSC in carcinoma. Montero et al. demonstrated that circulating Lin-/Lo HLA DRCD33+ CD11b+MDSC correlated with clinical tumor stage, increased metastatic tumor burden [7]. Gabrilovich et al. had a conclusion that the myeloid lineage is globally altered in cancer as a single, closely integrated system involving all terminally differentiated myeloid cells and their pathologically activated immature progenitors [13]. Bunt et al. presented in his study suggest that the induction of MDSC by proinflammatory cytokines directly contributes to tumor progression by inhibiting tumor immunity [20]. Sherger et al. evaluated in the human literature, the predominance of tumors shown to up regulate MDSCs are carcinoma including those arising from pancreas, colon, and lung [21]. Additionally, specific tumor types many uniquely up regulate specific MDSC subset such as seen with the predominance of CD15. Zhi et al. found the evidence from the literature that MDSC are associated with tumor progression [21]. Adoptive transfer of MDSC in murine tumor models has been found to significantly promote tumor growth.
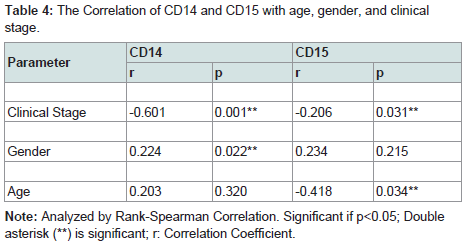
Table 4: The Correlation of CD14 and CD15 with age, gender, and clinical stage.
Tumors progression caused by activation of abnormal myelopoiesis and recruitment of IMC into tissues. This process is governed by diverse soluble factors and is dependent upon upregulation of STAT3 and other key transcription factors [8,13]. Cancer myelopoiesis is associated with defective myeloid cell differentiation, which results in accumulation and persistence of IMC. In tumor sites these cells further differentiate into TAMs and possibly into suppressive DCs. In patients with cancer, cells with an MDSC phenotype are almost universally immune suppressive, which may reflect their isolation from patients with advanced disease [7,8,13,20]. If immunosuppressive activity is not a property of the first wave of IMC recruited to tumors, continuous stimulation of myelopoiesis and activation of IMC by tumor-derived soluble factors may drive the subsequent accumulation of immunosuppressive MDSCs that support tumor promotion and form the metastatic [13].
Prolonged persistence of neutrophil MDSC in the peripheral blood reduced apoptosis, migration/extravasation that makes these cells attractive candidates for peripheral immunosuppression in cancer patient [23]. The expansion, activation, and accumulation of MDSC in peripheral tissue can be driven by multiple factors produced by tumor cells, tumor stromal cell, or by activated T cells. These mediators include chemokine CXCL12. These agents either promote MDSC expansion through the JAK2/STAT3 signaling pathway or induce the activation of MDSC via STAT1, STAT6, or through NF- κB-dependent mechanism [6,12].
MDSCs have been also demonstrated to support neoangiogenesis, tumor growth, and metastasis. These cells are known to produce VEGF, basic fibroblast growth factor (bFGF), hypoxia-induced factor [24]. (HIF)-1, TGF-β, and MMP9 that promote neoangiogenesis and create a pre-metastatic environment [10]. Moreover, produced by MDSCs S100A8/A9 inflammatory proteins not only to attract MDSCs into the tumor site and enhance their immunosuppressive activity but also to promote the activation of MAPK and NF-κB signaling pathways in tumor cells, stimulating thereby the tumor growth and metastasis. MDSCs are able to strongly promote tumor progression by inhibiting anti-tumor immune responses by multiple mechanisms [24].
NPC cell induced the expansion of tumor-induced MDSC; in turn MDSC enhanced NPC cell migration and metastasis [25]. Li et al. mentions that up regulation of tumor cyclooxygenase-2 (COX-2) expression positively correlated with the expansion of MDSC in NPC patients and both of COX-2 and MDSC were poor predictors for disease free survival [25].
In this study, elevated numbers of MDSC in NPC patients with advanced stage were found especially in the peripheral blood. Differences between MDSC levels in blood and tissue were seen when comparing early stage and advanced stage. Limitation of this study was inclusion of relatively small numbers of patients and no assessment of gene expression after therapy.
Conclusions
There is close relationship between MDSC and clinical stage. MDSC are higher in blood and were statistically significant predictor. Therefore, MDSC play an important role that causes progression in nasopharyngeal carcinoma.Further investigations of biochemical pathway and cell signaling of the NPC are required to understand carcinogenesis.
Acknowledgements
The authors would like to thank Chippy Ahwil, MD for their technical assistance and Ms. Nurvita Trianasari for statistical analysis. We are grateful to all patients and clinical colleagues who donated or collected clinical samples.References
- Cho WC (2007) Nasopharyngeal carcinoma: molecular biomarker discovery and progress. Mol Cancer 6: 1.
- Anghel I, Anghel AG, Dumitru M, Soreanu CC (2012) Nasopharyngeal carcinoma -- analysis of risk factors and immunological markers. Chirurgia (Buc ur) 107: 640-645.
- Brennan B (2006) Nasopharyngeal carcinoma. Orphanet J Rare Dis 1: 23.
- Chang ET, Adami HO (2006) The enigmatic epidemiology of nasopharyngeal carcinoma. Cancer Epidemiol Biomarkers Prev 15: 1765-1777.
- Adham M, Kurniawan AN, Muhtadi AI, Roezin A, Hermani B, et al. (2012) Nasopharyngeal carcinoma in Indonesia: epidemiology, incidence, signs, and symptoms at presentation. Chin J Cancer 31: 185-196.
- Wesolowski R, Markowitz J, Carson W 3rd (2013) Myeloid derived suppressor cells – a new therapeutic target in the treatment of cancer. J Immunother Cancer 1: 1-10.
- Diaz-Montero CM, Salem ML, Nishimura MI, Garrett-Mayer E, Cole DJ, et al. (2009) Increased circulating myeloid-derived suppressor cells correlate with clinical cancer stage, metastatic tumor burden, and doxorubicin-cyclophosphamide chemotherapy. Cancer Immunol Immunother 58: 49-59.
- Gabrilovich DI, Nagaraj S (2009) Myeloid-derived suppressor cells as regulators of the immune system. Nat Rev Immunol 9: 162-174.
- Greten TF, Manns MP, Korangy F (2011) Myeloid derived suppressor cells in human diseases. Int immunopharmacol 11: 802-807.
- Li H, Han Y, Guo Q, Zhang M, Cao X (2009) Cancer-expanded myeloid-derived suppressor cells induce anergy of NK cells through membrane-bound TGF-beta 1. J Immunol 182: 240-249.
- Zhang B, Wang Z, Wu L, Zhang M, Li W et al. (2013) Circulating and tumor-infiltrating myeloid-derived suppressor cells in patients with colorectal carcinoma. PloS One 8: e57114.
- Zhi L, Toh B, Abasto JP (2012) Myeloid derived suppressor cells: subsets, expansion, and role in cancer progression. In: Biswas Sk (2012) Tumor microenvironment and myelomonocytic cells, pp. 63-88.
- Gabrilovich DI, Ostrand-Rosenberg S Bronte V (2012) Coordinated regulation of myeloid cells by tumours. Nat Rev Immunol 12: 253-268.
- Sawanobori Y, Ueha S, Kurachi M, Shimaoka T, Talmadge JE, et al. (2008) Chemokine-mediated rapid turnover of myeloid-derived suppressor cells in tumor-bearing mice. Blood 111: 5457-5466.
- Teicher BA, Fricker SP (2010) CXCL12 (SDF-1)/CXCR4 pathway in cancer. Clin Cancer Res 16: 2927-2931.
- Edge S, Byrd DR, Compton C, Fritz AG, Greene FL, et al. (2010) AJCC Cancer Staging Handbook, 7th Edn, Springer New York, pp. 718.
- Budiman, Feranthy ZA, Shahib NM (2015) The Existence of mRNAs and miRNAs Expressions for Maintaining Cell Survival Networks Associated with the Human Transparent and Cataractous Lens. J Ocular Biol 3: 8.