
Research Article
Risk assessment tools can be used to identify and rank parameters (e.g., process, equipment, input materials) with potential to have an impact on product quality, based on prior knowledge and initial experimental data. Once the significant parameters are identified, they can be further studied to achieve a higher level of processunderstanding.
QbD Based Approach to Design Controlled Strategy for Wet Granulation Method Using Plackett Burman Design-Case Study
Sachin Marihal*, Himankar Baishya and Wang Shengmin
- Beijing Sciecure Pharmaceutical Co., Ltd., Industrial Park, Shunyi District, Beijing, China
*Address for Correspondence: Beijing Sciecure Pharmaceutical Co., Ltd., Industrial Park, Shunyi District, Beijing, China, E-mail: sachin@sciecure.com
Citation: Marihal S, Baishya H, Shengmin W. Qbd Based Approach to Design Controlled Strategy for Wet Granulation Method Using Plackett Burman Design-Case Study. J Pharmaceu Pharmacol. 2016;4(1): 7
Copyright © 2016 Marihal S et al. This is an open access article distributed under the Creative Commons Attribution License, which permits unrestricted use, distribution, and reproduction in any medium, provided the original work is properly cited.
Journal of Pharmaceutics & Pharmacology | Volume: 4, Issue: 1
Submission: 19 August, 2016 | Accepted: 29 August, 2016 | Published: 05 September, 2016
Abstract
Objective: The objective of present work describes developing controlled strategy for wet granulation process by identifying critical process parameters and study was done using DoE in support of Quality by Design (QbD).
Material and method: The manufacturing process involves wet granulation process, fluid bed drying, milling, blending, Lubrication, compression and coating. For wet granulation process identified critical process parameters were studies using, the Plackett-Burman factorial design to study four factors at two levels. The DOE was generated and analyzed using Design expert 8 software.
Results and discussion: Total 12 trails and were conducted from RUN 1-12. All trials physical properties (bulk and tapped densities), tablet parameters and dissolution profile of the tablets were evaluated. Based on the results, it can be concluded that none of the CPP’s have very significant effect on dissolution but impeller speed and wet massing time showed significant effect on disintegration time. At lower level of impeller speed and binder addition rate, higher level of wet massing time model demonstrated higher release profile.
Conclusion: Understanding of manufacturing process is of key importance to successful implementation of QbD approach. Using a Design of Experiments approach (Plackett Burman design), the range of operation for the critical process parameters, including the impeller RPM, the rate of water addition, mixing time and the kneading time range were proposed and established control strategy. Operational ranges of critical parameters should be optimized in order to produce quality product in a repeatable manner. Process outcomes within the spec limits indicate a lack of CPPs. Further these categorical variables were identified for use in registration and validation batch manufacture.
Keywords:
CPP; Plackett-Burman; DoE, High shear granulation; CQA; DoE; QbD; Control strategy
Introduction
The aim of pharmaceutical development is to design a quality product and its manufacturing process to consistently deliver the intended performance of the product. The information and knowledge gained from pharmaceutical development studies and manufacturing experience provide scientific understanding to support the establishment of the design space, specifications, and manufacturing controls. In addition, we can choose to conduct pharmaceutical development studies that can lead to an enhanced knowledge of product performance over a wider range of material attributes, processing options and process parameters [1].
Risk assessment tools can be used to identify and rank parameters (e.g., process, equipment, input materials) with potential to have an impact on product quality, based on prior knowledge and initial experimental data. Once the significant parameters are identified, they can be further studied to achieve a higher level of processunderstanding.
Drug product Critical Quality Attributes (CQA) should out and quantitatively described by target values and acceptance criteria. Excipients and packaging systems should be carefully selected taking into consideration drug product destination, patient’s compliance, API stability and pharmacokinetics as well asmanufacturing process suitability [2].
The manufacturing process is well understood when target product profile is defined, product composition and production route are established, critical process parameters (CPP) are selected, control methods developed, proven acceptable ranges (PARs) and design space are established [1].
Level of the process understanding seems to be in an inverse relationship with risk of producing poor quality products. Therefore, scientific understanding of processes would substantially facilitate implementation of changes.
Design of experiments (DOE) is a systematic method to determine the relationship between factors affecting a process and the output of that process. In other words, it is used to find cause-and-effect relationships. This information is needed to manage process inputs in order to optimize the output [3].
The most commonly used terms in the DOE methodology include: controllable and uncontrollable input factors, responses, hypothesis testing, blocking, replication and interaction.
The controllable input factors can be modified to optimize the output. The relationship between the factors and responses is shown in Figure 1.
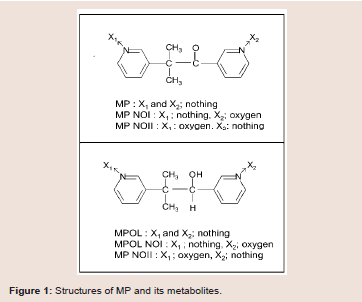
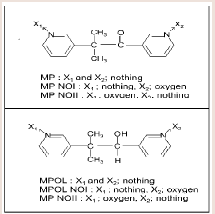
Figure 1: Structures of MP and its metabolites.
Generally, for test of k factors each at 2 levels, the factorial design requires 2k runs of experimentation. As the number of factors or levels increases, the number of runs increases rapidly: 4 factors at two levels need to be tested within 16 runs but 6 factors at two levels require 64 runs [2].
Plackett-Burman (PB) designs are a class of fractional factorial designs first developed by two mathematicians/statisticians: R.L.Plackett and J.P. Burman, at the University of Newcastle in Northeast England in 1946 [3,6]. Plackett-Burman design is helpful or in the case of screening with a higher number of factors or if complete knowledge about the system is unavailable [7]. The design attributed to Plackett and Burman is a two level fractional factorial design. It enables to study k = N-1 variables in N runs, when N is a multiple of 4. In this way 7 factors can be tested within 8 runs, so number of trials may be reduced down to absolute minimum. The plan is dedicated for screening out numerous factors in order to choose the ones that mostly impact the process outcomes [2]. It is also reasonable to use PB designs when one wants to demonstrate ruggedness or robustness of equipment or processes [3].
In present system, product quality is ensured by fixing the process to produce the active ingredient, raw material testing, performing the drug product manufacturing process as described in a fixed batch record, in-process material testing, and end product testing [8].
Thus in present study Process risk analysis was performed to identify CPP effecting CQA’s and develop a design space using placket Burman design and propose a controlled strategy for manufacturing process.
Experimental
Material and Methods
Materials: Active pharmaceutical agent coded as PM1, Pre-gelatinized Starch (STARCH 1500, colorcon), Sodium Lauryl Sulfate BASF), Povidone K29/32(ISP TECHNOLOGIES), Colloidal Silicon Dioxide (Evonik), Sodium Starch glycolate (JRS), Stearic Acid (BASF), Magnesium Stearate (Perter-Geven). Purified water (USP) was used as granulating fluid. All material used were tested and released as per USP.
Equipment used: HMG 6 L granulator, GPCG fluid bed processor, CO-mill (Glatt) and halogen Moisture analyzer, KORSCH Tablet Compression Machine.
Instrument used: Disintegration Tester, Hardness tester, Friability tester.
Methods
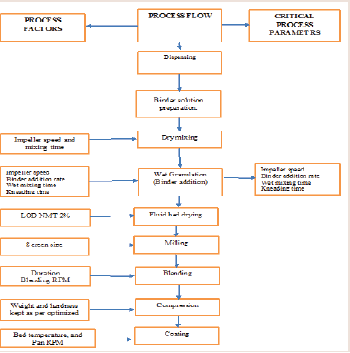
API and Pregelatinized Starch is dry mixed in HMG followed by addition of binder solution containing Povidone and SLS to the dry mix blend. During granulation stage impeller RPM, the binder addition, wet massing time, kneading time were changed as per the Design trials. After granulation drying material was transferred tofluid bed processer and set the inlet air to achieve the satisfied material fluidization, set the inlet air temperature at 60 ºC ± 10 ºC. Granules dried till target LOD NLT 2% is achieved. The dry granules were milled through comil. Setup the bin blender. Put quantity of Sodium starch glycolate into Silica Colloidal anhydrous and mix manually and then put mixture into the bin Blender and mix the materials for 10 min and followed by lubrication using stearic acid and magnesium stearate for 5 minutes. The compression was performed in KORSCH machine. The coating was carried in Glatt coating machine with a tablet percentage buildup of 2% using Opadry coating suspension 750 mg. The details process flow is given in Figure 2.
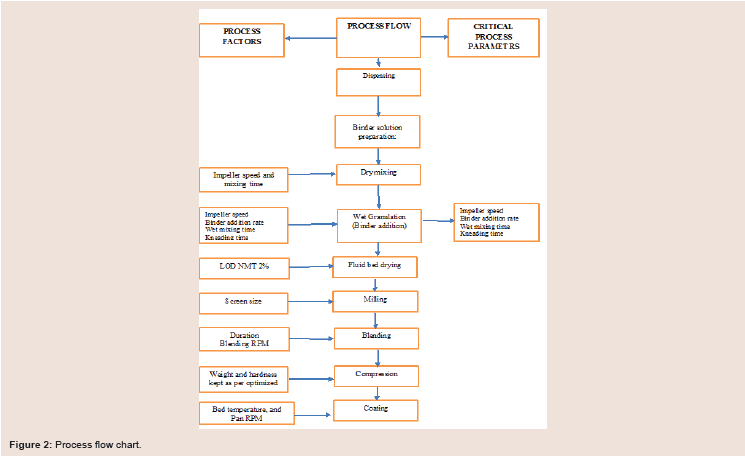
Figure 2: Process flow chart.
In-process control
Bulk and tapped density: The bulk and tapped density were measured in accordance with USP.
Particle size distribution (PSD): The PSD of granulate was measured by sieve analysis performed in ERWEKA GTB. Test sample of 50 g was treated for 10 min under vibrations of 1.5 cm amplitude. Mass of granulate retained at each sieve was determined and presented as m/m percent.
Loss on drying: Loss on drying was analyzed in Mettler Toledo apparatus. Granulate in quantity of 5 g was dried at 70 oC to constant mass. The loss of mass was presented as percent m/m.
Thickness and Hardness: Thickness and Hardness of the tablets were measured. All the parameters were tested using Erweka apparatus.
Friability: The friability of tablets was checked using CS-2 tester. The analysis was done in accordance with USP method.
Disintegration time: Disintegration of tablets was measured by using Erweka ZT322 tester in line with USP method.
Dissolution: Tablets were tested as per USP monograph recommendation for the API PM01. Media used water, 900 ml using USP-II (paddle) at 50 RPM. Time point selected were 10 min, 15 min, 20 min, 30 min, 45 min and 60 min. Samples were Analysed at each time point using Agilent HPLC and detection wavelength at 274 nm.
Critical assessment
Qualitative and quantitative composition of tablets has been defined. Each tablet contained 750mg of PM 01drug substance and the total coated tablet mass was 840 mg. Process flowchart is shown in Figure 2).
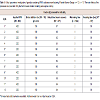
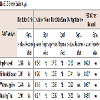
A parameter is critical when a realistic change in that parameter can cause the product to fail to meet the TPQP. Thus the first step in classifying parameters is to define the range of interest which we call the potential operating space (POS). The POS is the region between the maximum and minimum value of interest to the sponsor for each process parameter [8]. Refer Table 1.
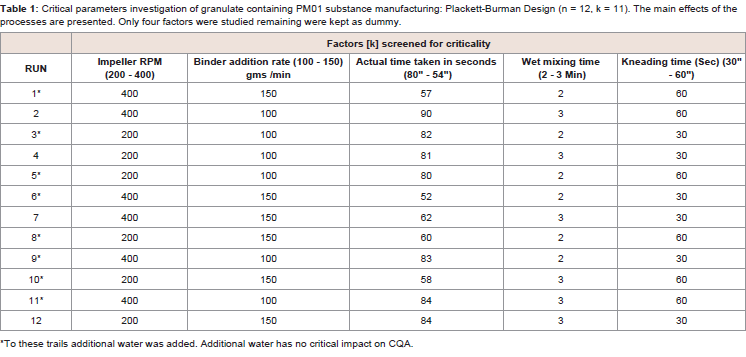
Table 1: Critical parameters investigation of granulate containing PM01 substance manufacturing: Plackett-Burman Design (n = 12, k = 11). The main effects of the processes are presented. Only four factors were studied remaining were kept as dummy.
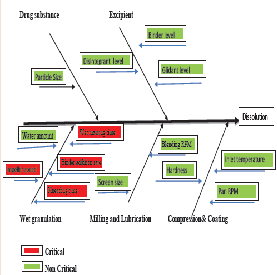
The Effect of material and process parameter attribute is described in Figure 2. As mentioned in figure the impeller speed, Binder addition time, wet massing time and kneading time were examined as CPP’s. The drug product CQAs Mainly dissolution was studied along with this other CQA like particle size distribution and DT was studied. Acceptance criteria were established for each the CQA, as follows:
Results and Discussion
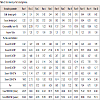
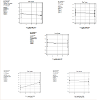
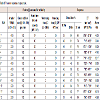
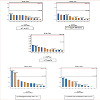
Feasibility trail were conducted as per the Placket Burman experimental design. Total 12 trails and were conducted from RUN 1-12. During the study RUN 1, 3, 5, 6, 8, 9, 10, 11 used additional water. All trials parameters were tested at core and coated stage. Data are represented in (Table 2and Table 3). Three response were selected i.e.; dissolution (10 min, 15 min and 20mim), Particle size distribution of granules and Disintegration time (Table 4 and Figure 3). The effect of factors on response is represented in one factor graph, counter plot and Pareto graph respectively.
Table 2: Granulometry of lubricated granules.
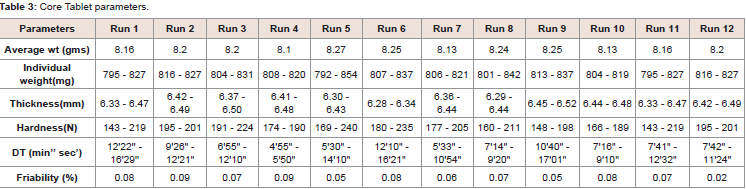
Table 3: Core Tablet parameters.
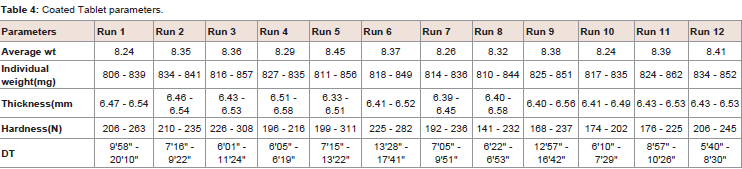
Table 4: Core Tablet parameters.
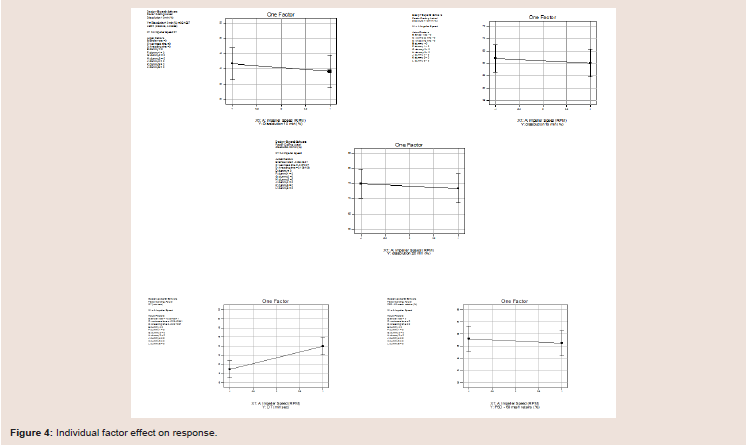
Figure 4: Individual factor effect on response.
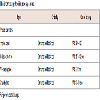
Among the selected CPP’s, It is demonstrated that active substance dissolution depends on factors like impeller speed and wet massing time (Table 5). The p-value for each CPP’s is listed in Table 6 shows the absolute effect values indicate magnitude of each factor impact on active substance dissolution. For one factor response in Figure 4, shows at lower impeller RPM release is more compared at higher RPM and granules formulation had no significant effect by impeller speed.
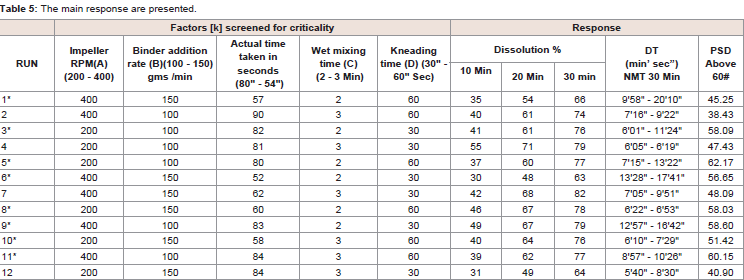
Table 5: The main response are presented.
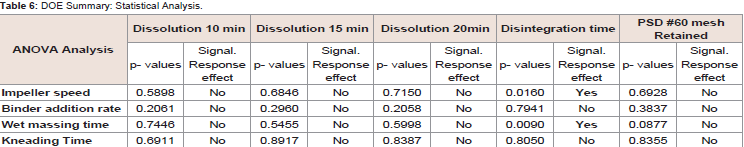
Table 6: DOE Summary: Statistical Analysis.
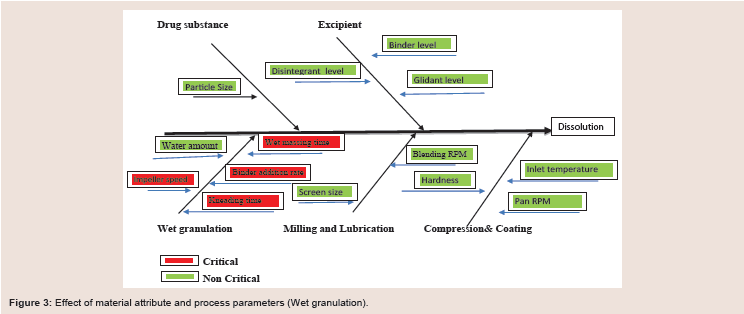
Figure 3: Effect of material attribute and process parameters (Wet granulation).
The One Factor Effects graph shows the linear effect of changing the level of a single factor. It is constructed by predicting the responses for the low (-1) and high (+1) levels of a factor. One factor at a time experimentation - it does not show you the effects of interactions.
It was observed that the low dissolution was determined when high levels impeller speed and lower wet massing time (run 6) contributed together, i.e., granulates were made at high impeller speed and short massing, the Plackett-Burman design due to its messy alias structure does not allow to estimate interactions among screened parameters [2]. Therefore, it was decided to assess criticality of each of the parameters Table 7.
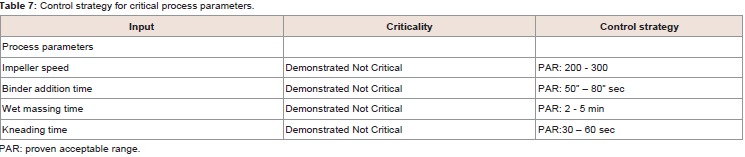
Table 7: Control strategy for critical process parameters.
Based on the results, it can be concluded that none of the CPP’s have very significant effect on dissolution but impeller speed and wet massing time showed significant effect on disintegration time. Speed of impeller blade affects collisions between granules. High impeller speed additionally increases temperature of agitated mass which may impact viscosity of binder solution and plasticity of particles. Duration of wet massing time influence on granule growth and showed increase of dissolution at higher level and reduced granular quantity. Binder addition rate at higher level showed reduced dissolution, decreased granular quantity and also increase in disintegration time. Kneading time at higher level showed slightly increase in release, more granular quantity and reduced disintegration time.
The blend PSD, therefore, likely governs the initial onset of the dissolution rate. DOE analysis using the Design Expert® indicates that the CPPs (wet massing time and binder addition rate) their combinations had significant impacts on blend PSD as seen in the Pareto chart in Figure 5. Also disintegration time is direct measure of dissolution; CPP’s (wet massing time and impeller speed) had significant effect. But model represents the CPP’s effects are below the Bonferroni Limit suggesting almost certainly no significant effect.
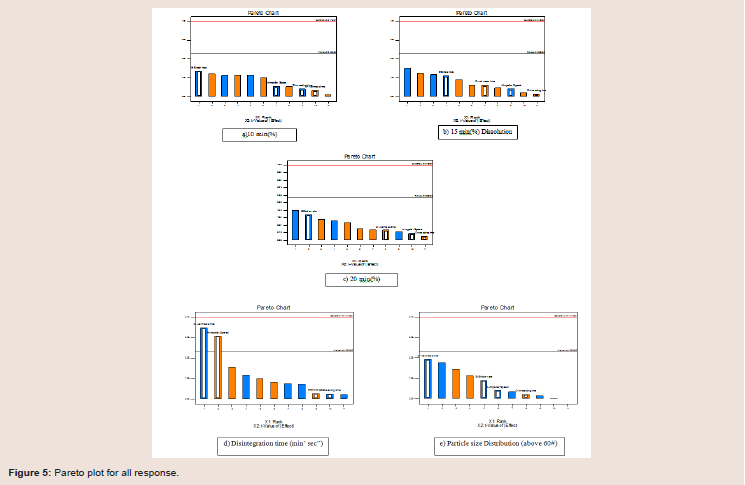
Figure 5: Pareto plot for all response.
The contour plots Figure 6) describe the relationship between the impeller speed and binder addition rate at lower level the interaction effect showed increased release profile and reduced disintegration.

Figure 6: Counter plot for all response.
Conclusion
Understanding of manufacturing process is of key importance to successful implementation of QbD approach. Using a Design of Experiments approach (Plackett Burman design), the range of operation for the critical process parameters, including the impeller RPM, the rate of water addition, mixing time and the kneading time range were proposed and established control strategy. Operational ranges of critical parameters should be optimized in order to produce quality product in a repeatable manner. Process outcomes within the spec limits indicate a lack of CPPs. Further these categorical variables were identified for use in registration and validation batch manufacture. Thus, a control strategy is established to ensure consistent quality as they scale up their process from the exhibit batch presented in the ANDA to commercial production.
Acknowledgements
We are extremely gratified to Formulation development Department and fellow colleagues, for helping us in the technical aspect of the project and also for useful scientific discussions, which produced methodical results and also for sharing their passion for drug product development and thus helping us in better understandingof critical process and quality attributes for drug development.References
- FDA CDER (2006) Guidance for industry: Q8(R2) Pharmaceutical development. U.S. Department of Health and Human Services, Food and Drug Administration, Center for Drug Evaluation and Research.
- Woyna-Orlewicz K, Jachowicz R (2011) Analysis of wet granulation process with Plackett Burman design--case study. Acta Pol Pharm 68: 725-733.
- Plackett RL, Burman JP (1946) The design of optimum multifactorial experiments. Biometrika 33: 305-325.
- Sundararajan K. Design of experiments - A primer.
- Torbeck LD (1996) Pharmaceutical and Medical Device Validation by Experimental Design. Technol 21.
- Montgomery DC (2007) Design and analysis of experiments (6th edn). John Wiley & Sons Limited.
- Jayakumar M. When and how to use Plackett-Burman experimental design.
- Lionberger RA, Lee SL, Lee LM, Raw A, Yu LX (2008) Quality by design:Concept for ANDA. AAPS J 10: 268-276.