
Research Article
*Address for Correspondence: Gunjan Pahuja, Department of Computer Science & Engineering, Dr. A.P.J. Abdul Kalam University, Lucknow, Uttar Pradesh, India, E-mail: gunjanpahuja.04@gmail.com
Citation: Pahuja G, Nagabhushan TN. Statistical Approach towards Parkinson’s Disease Progression. J Parkinsons Dis Alzheimer Dis. 2016;3(2): 6.
Copyright © 2016 Pahuja G, et al. This is an open access article distributed under the Creative Commons Attribution License, which permits unrestricted use, distribution, and reproduction in any medium, provided the original work is properly cited.
Journal of Parkinson's disease & Alzheimer's disease| ISSN: 2376-922X | Volume: 3, Issue:2
Submission: 08 August, 2016 | Accepted: 06 October, 2016 | Published: 31 October, 2016
 Data analysis
 A null hypothesis states that there exists no statistical significance between the variables in the hypothesis. Null hypothesis formulated in this paper is: There is no statistically significant relationship between Parkinson’s disease and clinical biomarkers like Plasma, Serum, CSFand RNA.
 In this paper our hypothesis is to prove whether RNA, CSF and serum are related with Plasma or not. To prove this statement relationship between several features need to be evaluated. We collected data on the number of patients, value of each of the feature for different cases ranging the age from 38 to 72. As it is clear from theFigure 5 that it is a Y vs X type of plot i.e. for each possible Y-X pair, when the value of Y is specified, we get the relationship with X axis variables. Thus it is clear from the Figures 5a-5c that at the same time values of CSF, Serum, RNA can be found for every value of Plasma and in the range of plasma values around 1 to 4.2, these values are more concentrated.
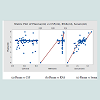
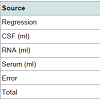 Table 3 below shows the model summary generated for the assumed dataset for PD. R-squared is used to measure the closeness of data to the fitted regression line. The value of R-squared is always between 0 and 100%. Higher the value means, better the model fits thedata. The low predicted value indicates that the model could generate results with less accuracy in some observations. The p-value for each feature or term like CSF, RNA, and Serum is used to test the null hypothesis, so there are 3 cases we can consider:
 (1) If the p-value of the coefficient is equal to zero this means it has no effect.
 Regression equation
Statistical Approach towards Parkinson’s Disease Progression
Gunjan Pahuja1* and TN Nagabhushan2
- 1Department of Computer Science & Engineering, Dr. A.P.J. Abdul Kalam University, Lucknow, Uttar Pradesh, India
- 2Professor, Information Science & Engineering, Sri Jayachamarajendra College of Engineering, Mysore, India
*Address for Correspondence: Gunjan Pahuja, Department of Computer Science & Engineering, Dr. A.P.J. Abdul Kalam University, Lucknow, Uttar Pradesh, India, E-mail: gunjanpahuja.04@gmail.com
Citation: Pahuja G, Nagabhushan TN. Statistical Approach towards Parkinson’s Disease Progression. J Parkinsons Dis Alzheimer Dis. 2016;3(2): 6.
Copyright © 2016 Pahuja G, et al. This is an open access article distributed under the Creative Commons Attribution License, which permits unrestricted use, distribution, and reproduction in any medium, provided the original work is properly cited.
Journal of Parkinson's disease & Alzheimer's disease| ISSN: 2376-922X | Volume: 3, Issue:2
Submission: 08 August, 2016 | Accepted: 06 October, 2016 | Published: 31 October, 2016
Abstract
Background: Parkinson’s disease (PD) is a neurodegenerative disorder of the central nervous system and is the second most commonly found movement disorder in elders. It is mainly caused by progressive loss of dopaminergic neurons in the substantia nigra (SN) region of the midbrain. PD has affected millions of people worldwide. Since the exact understanding of brain functioning seems to be mammoth task, scores of research has been carried out to identify the biomarkersresponsible for Parkinson’s disease. Now a day’s several models are being used to understand the behaviour of the complex systems like brain. In this regard, one of the most important tools is “modelling”. Mathematical modelling not only helps in better understanding of the disease, but also in early diagnosis thus minimizing the trialand error attempts. This type of quantitative analysis can enhance understanding of the disorders, behaviour and symptoms. Further, it is cost-effective and efficient as it correlates different biomarkers that help neurologists in taking better decisions. However, we must note that its practical implementation requires human intelligence to authenticate the predicted results.Objective: The objective of this study is to develop a mathematical model describing the correlation between Plasma and other biomarkers responsible for Parkinson’s disease.
Methods: For this study the subject’s data (Patients as well as Controls) has been collected from PPMI dataset. The aim of PPMI is to identify one or more biomarkers of PD progression. The study is being sponsored by The Michael J. Fox Foundation for Parkinson’s Research. The comprehensive PPMI database and biorepository includes
(a) Clinical and behavioral assessments
(b) Imaging data
(c) Biospecimens: Cerebral Spinal fluid, DNA, RNA, Plasma, serum and urine. The biospecimens that have been used in this study are taken from PPMI database and biorepository.
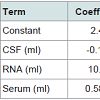
Results: After the analysis it is observed that PD is positively correlated with RNA and Serum and negatively correlated with CSF. Extraction of blood sample is easier to obtain and is affordable, however the concentration of most of the biomarkers are much lower in blood than in CSF and there exists contamination by plasma proteins which is not related to neuropathological processes. The correlation between different biospecimens is represented by
Plasma (ml) = 2.49-0.142CSF (ml) + 10.42RNA (ml) + 0.5873 Serum (ml)
Finally, it was observed that the accuracy of the model varied with different values of biomarkers and clinical characteristics and could be further improved by taking into account large dataset. Also, the results arrived are to be used along with human intelligence for practical implementation.
Conclusions: A mathematical model has been developed for PD progression. The model utilizes widely available, cost-effective, noninvasive biomarkers that can be used to improve patient selection in clinical trials and identify PD patients for early treatment. This would help the neurologist in taking better decisions. We need to understand that these predicted results are to be complemented with human intelligence for clinical implementation.
Introduction
The causes of Parkinson’s disease (2nd most common neurodegenerative disorder) are still unknown. It is believed that in most of the cases the non genetic factors causes a main portion of all PD cases rather than the major gene mutation which causes only a small portion of PD cases. The identification between variousneurodegenerative diseases like AD and PD becomes very difficult because many of them share common features. AD is primarily a memory disorder whereas Parkinson’s is a movement disorder but in both the cases brain cells get damaged, they are progressive in nature and get worse over time [1]. Thus there is a need of mathematical models that can help neurologists in taking better decisions. With the advancement in mathematics and computing researchers are striving to develop the models [2]. Dr. Ahmed Moustafa (UWS MARCS Institute) is testing new mathematical models to help neurologists for diagnosing PD. According to him for better diagnosis and treatment the neurologists have to rely on both human as well as machine intelligence. In this paper, we present a mathematical model for PD relating the patient’s specific biomarkers like Plasma, RNA, and CSF. After the information is processed, the model developed will provide the correlation between the biomarkers. By doing the result nalysis the doctors can take the decisions about the planned course of treatment.Biomarkers are the indicators of some biological condition or state that can be measured and evaluated as indicators of normal biological processes, pathogenic processes or pharmacological responses totherapeutic interventions. Biomarker indicates the severity of a disease in particular and thus associated with clinical relevance [3,4]. Hence for the differential diagnosis, prognosis and treatment of PD, we need early, sensitive, specific, and economical peripheral and central biomarker(s). These can be classified as clinical, biochemical, genetic, proteomic, and neuroimaging biomarkers. Research efforts show the changes in various biomarkers like Plasma, RNA, CSF and Serum exists in case of PD. For the modelling purpose we have collected the details of biomarkers of Parkinson’s disease patients from Parkinson’s Progression Markers Initiative (PPMI) organization. The aim of PPMI is to identify the biomarkers of PD progression and provide it to various researchers, so that efficient methods would be developed for detection of this disease. Alternatively, this would be helping the clinicians in making better decisions.
Review of Literature
Parkinson’s disease can be categorized as Idiopathic/Sporadic Parkinsonism and Genetic Parkinsonism. According to a new research published in JAMA Neurology, people suffering from PD because of mutations in a gene called parkin have different signs and symptoms from those people with non-inherited PD. Idiopathic/ Sporadic means that it has no known cause. It is believed that the majority of PD cases are classified as Sporadic/Idiopathic, and occur in people with no family history of the disorder. Sporadic cases are likely to be the result of a complex interaction of environmental factors like head injury, gender, occupation, pesticide exposure etc. [5]. Clinicians have a hope that “Biomarkers” can help the doctors to some extent. Thus the main aim of using Biomarkers is to help the neurologist in diagnosing the disease, keep track of the progression of the disease and help in identifying therapeutic targets.Although various potential markers for PD are available, they can be categorized in three main categories as Imaging, Clinical Testing Procedures and Biochemical and genetic biomarkers [3]. Imaging includes many techniques like MRI, SPECT, PET, fMRI to analyze the loss of neurons in different parts of brain [6,7]. Every Imaging technique has its pros and cons like PET scans possess the advantage of having high spatial resolution, SPECT scans are cheaper etc. But the disadvantage of PET and SPECT is that intervention of radioactive nucleotides within the body. Out of various Imaging Biomarkers, MRI is preferred because of its non invasiveness, cost (less costly), harmlessness and high spatial resolution [8,9]. Literature shows that the use of MRI for reliable and accurate diagnosis of Parkinson’s disease has become very vibrant [10]. In this regard the automatic approach based on Machine learning is playing a vital role for PD detection. Machine learning approach deals with various issues in medical datasets like incompleteness, incorrectness, inexactness, sparseness etc., thus would be helpful in early diagnosis of the disease. Much work has been done in this field by various researchers [11-14].
Second category of biomarkers is the clinical test biomarkers. These are important for analyzing the variations in symptoms response with respect to treatment given, which is critical for the clinicians. Preclinical tests will help the neurologists in differentiating PD fromother causes of Parkinsonism. Thus it may help the neurologists in diagnosing this disease before the patients’ stage become critical. PD is characterized by motor and nonmotor symptoms. Primary motor symptoms of PD include tremor of the hands, arms, legs, jaw and face, slowness of movement, rigidity of the limbs and postural shakiness [15]. In addition to the above mentioned symptoms, there are some non-motor symptoms like depression, loss of memory which may occur and affect the quality of life. The state of PD patients that occurs before the motor symptoms is called the Preclinical PD [16]. Thus sometimes non motor symptoms like depression, anxiety etc. appears prior to motor symptoms. Thus a test must be developed for PD specific patients for validating the non motor symptoms. Sometimes rating methods like Hoehn and Yahr scale (1967), Unified Parkinson’s Disease Rating scale (UPDRS) etc. are used for diagnosing purpose. However, these types of rating methods need skilled people. Also time and cooperation is required from the patients for a longer time [17]. Foltynie et al. discussed the concept of heterogeneity in Idiopathic Parkinson’s disease [18]. The authors also explored how these markers are likely to help in classifying the diseased population by patterns of presentation and progression. In some of the cases, vision may also get affected because there is a change in intraretinal dopaminergic transmission in amarcrine. Thus through the test of retinal function, pathological changes in the basal ganglia can be correlated in patients. Some of the neuroImaging biomarkers of preclinical PD are DAT SPECT for SPECT, F-fluorodopa and DAT PET for PET [19]. It wasobserved that there is reduction in F18 activity or in DAT binding in patients with PD as compared to normal people [20]. For diagnosis and differential diagnosis of movement disorders of PD patient’s transactional B-mode sonography is also used over the last 15 years. Sonographic features like hyperechogenicity in substantia nigra [21], Iron in substantia nigra for fMRI etc. might help the diagnosis of PD & other movement disorder [17,22]. The mentioned techniques have their advantages as well as disadvantages like PET are helpful in preclinical PD diagnosis but PET is costly and may be exaggerated by levodopa [23].
3rd category of biomarkers of PD is Genetic and Neurochemical biomarkers. As mentioned in the literature, that the cause of PD is loss of neurons in dopamine region of the patients. It may be caused as a result of environmental, genetic and some other factors like side effect of some other medicines. Thus by assessing the concentrations of α- synuclein levels in cerebrospinal fluid (CSF), PD patients can bediscriminated from the healthy persons. It was observed that levels of α-synuclein get decreased in patients with PD as compared to healthy controls [24]. The biomarkers for CSF are α-synuclein, leucine -rich repeat kinase (LRRK2) that would be helpful in diagnosing PD. The biomarkers for blood are α-synuclein, urate etc. Other biomarkers include observing the uric acid levels, urate levels in blood and CSF, plasma concentration etc. Uric acid levels gets reduced in patients with PD [25], decreasing urate levels increase the risk of Parkinson [26], high plasma concentration increased the risk of developing PD[27].Although various biomarkers are available for diagnosing purpose, but no single biomarker is able to do it comprehensively for PD because of the heterogeneous nature of this disease. Thus it is essential that integration of some of the techniques must be used for PD detection like the clinical assessment (using specificquestionnaire) can be integrated with Imaging Modalities. Some of the laboratory biomarkers like blood, CSF, RNA, Serum etc. can be employed in addition with the above test for effective diagnosing of this disease.
Objective
Biomarkers are helpful in measuring the progression of a disease, and progression of PD is measured by the change in total score obtained by subtracting the baseline visit values from a finalstudy endpoint. It may vary with time and not necessary be same for all the patients. Thus the objective of this study is to develop a mathematical model describing the correlation between Plasma and various features. As already mentioned [27] that Plasma is positively correlated with PD. Hence, the correlation of Plasma with other features gives an additional insight towards PD detection. For this purpose we have collected the data from PPMI organization. Thedescription of the collected data is as follows.Data acquisition
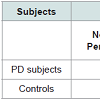
For PD detection the data of Patients as well as Controls were obtained from PPMI (http://www.ppmi-info.org). The aim of PPMI is to identify the biomarkers of PD progression. PPMI dataset study is sponsored by The Michael J. Fox Foundation, so that efficient methods would be developed for detection of this disease. Table 1 shows the demographic details of the subjects, used for this study.
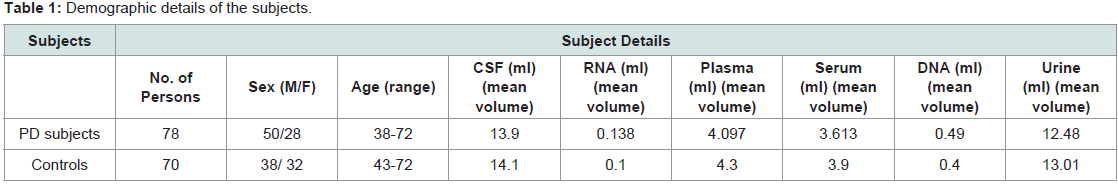
Table 1: Demographic details of the subjects.
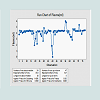
Data analysis means to clean, transform and model the data aiming the extraction of useful information that would be helpful in making efficient decision making. After collecting the data from PPMI organization, analysis of the data for Parkinson’s disease has been carried out to find out which of the above mentioned features are dependant and correlated with Plasma. As the plasma correlation with PD has been studied [27]. Figure 1-4 graphs show the run timeanalysis of plasma, serum, CSF, RNA. For the analysis purpose it is necessary to make the hypothesis that can be rejected or accepted according to p-values [28].
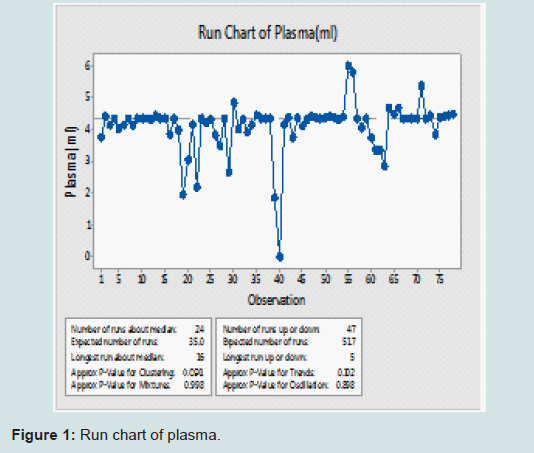
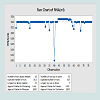
Figure 1: Run chart of plasma.
Alternative hypothesis: An alternative hypothesis is opposite of the null hypothesis. So the alternative hypothesis would be that there exists a statistical significant relationship between Plasma and clinical iomarkers like Serum, CSF and RNA.
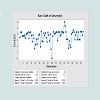
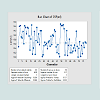
Figure 1-4 shows the “Run Chart” of the above mentioned features. Run chart or run-sequence plot [29] is used to represent the observed data in time sequence manner i.e. in run chart, the observations shown on the y axis, are graphed against a time periodon the x axis. For example, run chart in Figure 1 represents the value of plasma for PD patient against the no. of observations. A run chart also used to identify four types of non random patterns like mixture patterns (p-value for mixtures is less than 0.05), cluster patterns (p-value for clustering is less than 0.05,), oscillating patterns (p-value for oscillation is less than 0.05) and trend patterns (p-value for trends is less than 0.05).
The statistics for run chart are Mean, Maximum, Minimum, Sample Size, Range, Standard deviation. The approximate p-values for the above mentioned patterns are greater than significant level (0.05). This means that randomness is not present in our dataset. An average line in run chart represents the movement of the data away from the mean [30]. Matrix plot is another type of graph used to assess the relationship between a variety of variables same time.Basically it’s a combination of individual scatter plots. A matrix plot is useful when the no. of variables is large and relationship between all pairs of variables is required. Figure 5 shows the matrix plot of Plasma vs RNA, Plasma vs CSF and Plasma vs Serum.
Figure 2: Run chart of serum.
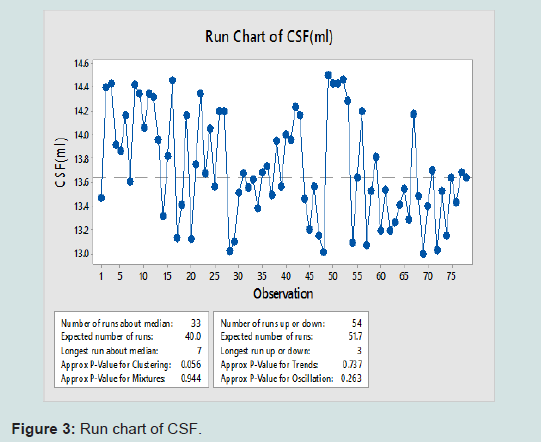
Figure 3: Run chart of CSF.
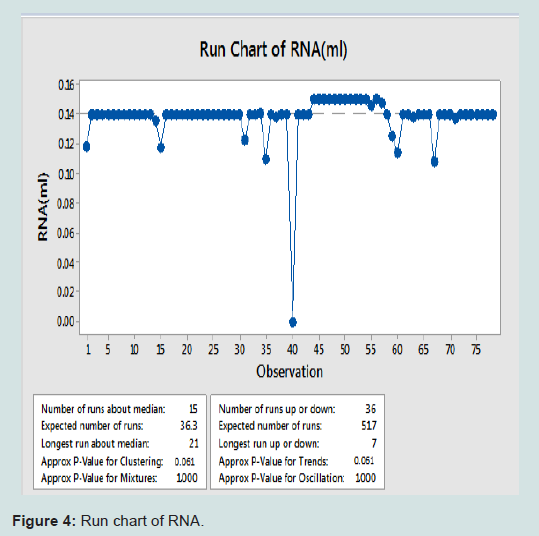
Figure 4: Run chart of RNA.
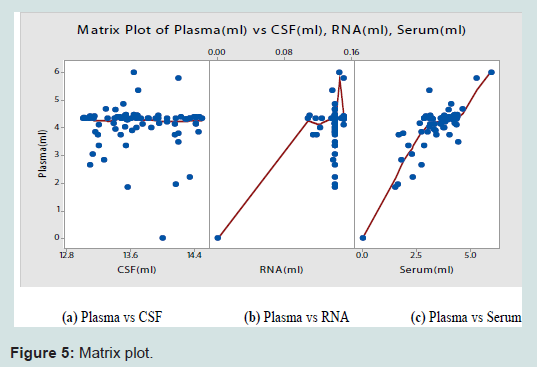
Figure 5: Matrix plot.
Results and Discussions
Analysis of Variance or ANOVA tests are useful for testing whether three or more means of variables are statistically significant or not. Conceptually it is similar to multiple two-sample t-tests. Fisher,a great English Statistician (1890-1962), first developed ANOVA, for agriculture data. Two assumptions undertaken by Hogg and Ledolter for ANOVA test were [31]:(1) The values for each level follow a Gaussian distribution curve i.e. must be normally distributive.
(2) Homogeneity of Variance must exist i.e. the variances are the same for each level.
Analysis of Variance summary for the dataset used for Parkinson’s disease in this paper is shown in Table 2.
It is clear from the Table 2 that the p-values for the RNA and Serum are less than 0.05. This shows that RNA and Serum are statistically significant, thus are positively correlated with the disease. Statisticallysignificant means the effect of RNA and Serum on Plasma is positive. CSF is not significant because p value is greater than 0.05. This shows that CSF is negatively correlated with the disease. This result has been validated with the previous work available in the form of research papers [25,26]. Due to this statistically significant interaction, we need to report the effects; that is, the effect of an independent variable at each level of the other independent variable.
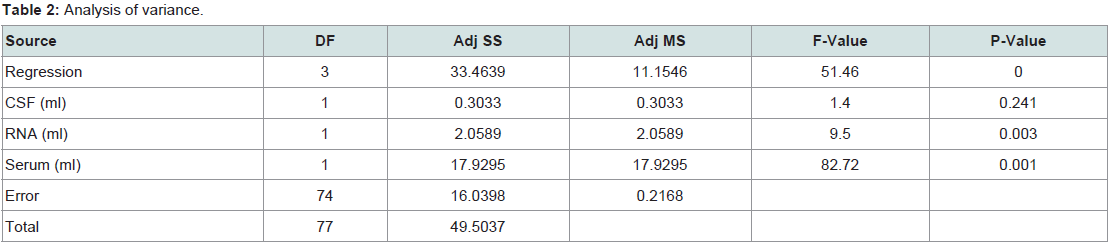
Table 2: Analysis of variance.
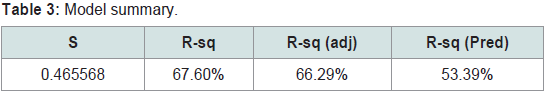
Table 3: Model summary.
(2) A low p-value (< 0.05) indicates that the null hypothesis can be rejected. In other words, a predictor that has a low p-value is likely to be a meaningful addition to the model because changes in the predictor’s value are related to changes in the response variable.
(3) A larger p-value indicates that changes in the predictor are not associated with changes in the response, thus it can be rejected or it is insignificant or negatively correlated.
It is clear from the Table 4 below, that the predictor variables of RNA and Serum are significant because of their p-values i.e. 0.003 and 0.001 respectively. However, the p-value for CSF (0.241) is greater than the common alpha level of 0.05, which indicates that it isstatistically insignificant or negatively correlated. Regression equation has been generated for the variables. As the variables RNA and Serum are significant or positively correlated with Plasma, thus represented with positive sign. CSF is shown with negative sign means that it is negatively correlated with Plasma.
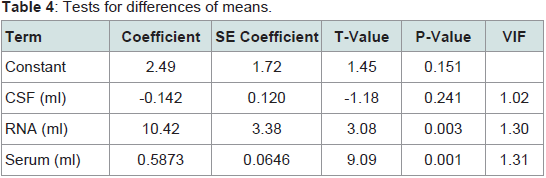
Table 4: Tests for differences of means.
There are significant evidences from the literature that tremor’s severity is directly correlated with plasma [24]. Thus, plasma could be a useful biomarker for PD diagnosis. Further, analysis on plasmaindicates its dependency on various other biomarkers like RNA and Serum. Equation 1 represents the plasma relation with other biomarkers.
Plasma (ml) = 2.49-0.142 CSF (ml) + 10.42 RNA (ml) + 0.5873 Serum (ml) (1)
When different values of CSF, RNA and Serum are being evaluated, the obtained plasma values are lying in the range of 2 - 4.1. To illustrate this, for values of CSF (13.472), RNA (0.1185) and Serum (3.44) the value of plasma = 3.83206 is obtained which is an indication of Parkinson’s patient [Patient id 3021: PD patient] = 2.49-0.142*13.472) + (10.42*0.1185) + (0.5873*3.44).The derived model is also validated on a few other samples from PPMI data set like for CSF(14.725), RNA (0.14) and Serum (4.285) the value of plasma was found to be approximately 4.5 which indicates thepossibility of a healthy subject [Patient id 3390-healthy control]. Even though we have been diligent while working on the plasma model, the results thus obtained should be interpreted with caution. This is due to the small sample size available with us for arriving at the above described model. When different values of CSF, RNA and Serum are being evaluated, the obtained plasma values are lying in the range of2-4.1. To illustrate this, for values of CSF (13.472), RNA (0.1185) and Serum (3.44) the value of plasma = 3.83206 is obtained which is an indication of Parkinson’s patient [Patient id 3021: PD patient] = 2.49- (0.142*13.472) + (10.42*0.1185) + (0.5873*3.44).
Conclusions
PD is currently recognized as the second most common neurodegenerative diseases that has affected millions of people worldwide. Even if a perfect biomarker is not currently available we can advance in the definition of biomarkers profile that characterizesany neurodegenerative disease. Although by using imaging modalities like PET, MRI, fMRI and machine learning techniques, it is possible to find the differences between grey matter, white matter and CSF in patients as well as healthy control. But many times these methods are not affordable by the patients. Thus, there is a strong need to identify an alternative method which is economical as well as accurate. Extraction of blood sample is easier to obtain and is affordable, however the concentration of most of the biomarkers are much lower in blood than in CSF and there exists contamination by plasma proteins which is not related to neuropathological processes
.In the literature it has been studied that PD is positively correlated with Plasma. In this paper we have tried to find the correlation between plasma and other biomarkers like RNA, CSF and Serum. Ithas been concluded that PD is correlated with RNA and Serum and negatively correlated with CSF. However, our work is limited due to small sample size of the data available. The research in this area is hindered by a number of challenges, including the difficulties in collecting the adequate samples for validation studies. The purpose is to study and identify a reliable biomarker of neurodegenerative diseases in peripheral blood, the CSF, or other readily accessible tissue which is much affordable for the masses. In future we will try to integrate more number of biomarkers so that PD detection can be done more accurately and efficiently. The results arrived are to be used along with human intelligence for practical implementation.
Acknowledgement
The authors would like to thank Parkinson’s Progression Markers Initiative organization for making T1 weighted MRI data available for research. For latest information on different medical modalities, visit http://www.ppmi-info.org/.References
- Samii A, Nutt JG, Ransom BR (2004) Parkinson's disease 363: 1783-1793.
- Sarbaz Y, Pourakbari H (2016) A review of presented mathematical models in Parkinson’s disease: black-and gray-box models. Med biol Eng Comput 54: 855-868.
- Michell AW, Lewis SJ, Foltynie T, Barker RA (2004) Biomarkers and Parkinson's disease. Brain 127(Pt 8): 1693-1705.
- Farías G, Pérez P, Slachevsky A, Maccioni RB (2012) Platelet tau pattern correlates with cognitive status in Alzheimer's disease. J Alzheimer's Dis 31: 65-69.
- De Lau LM, Breteler MM (2006) Epidemiology of Parkinson's disease. Lancet Neurol 5: 525-535.
- Piccini P, Whone A (2004) Functional brain imaging in the differential diagnosis of Parkinson's disease. Lancet Neurol 3: 284-290.
- Filler AG (2009) The history, development and impact of computed imaging in neurological diagnosis and neurosurgery: CT, MRI, and DTI. Nature Precedings 7.
- Thiel C (2009) Neuropharmakologisches fMRT. Klinische Neurophysiologie 40: 233-238.
- Rasmussen I (2010) Psychopharmacological MRI. Acta Neuropsychiatr 22: 38-39.
- Chaplot S, Patnaik LM, Jagannathan NR (2006) Classification of magnetic resonance brain images using wavelets as input to support vector machine and neural network. Biomed Signal Process Control 1: 86-92.
- Kassubek J, Juengling FD, Hellwig B, Spreer J, Lücking CH (2002) Thalamic gray matter changes in unilateral Parkinsonian resting tremor: a voxel-based morphometric analysis of 3-dimensional magnetic resonance imaging. Neurosci Lett 323: 29-32.
- Summerfield C, Junqué C, Tolosa E, Salgado-Pineda P, Gómez-Ansón B, et al. (2005) Structural brain changes in Parkinson disease with dementia: a voxel-based morphometry study. Arch Neurol 62: 281-285.
- Mahanand BS, Suresh S, Sundararajan N, Kumar MA (2011) Alzheimer's disease detection using a self-adaptive resource allocation network classifier. International Joint Conference on Neutral Networks.
- Babu GS, Suresh S, Mahanand BS (2014) A novel PBL-McRBFN-RFE approach for identification of critical brain regions responsible for Parkinson’s disease. Expert Syst Appl 41: 478-488.
- Schrag A, Good CD, Miszkiel K, Morris HR, Mathias CJ, et al. (2000) Differentiation of atypical parkinsonian syndromes with routine MRI. Neurology 54: 697-702.
- Schwingenschuh P, Ruge D, Edwards MJ, Terranova C, Katschnig P, et al. (2010) Distinguishing SWEDDs patients with asymmetric resting tremor from Parkinson's disease: a clinical and electrophysiological study. Mov Disord 25: 560-569.
- Martin WR, Wieler M, Gee M (2008) Midbrain iron content in early Parkinson disease: a potential biomarker of disease status. Neurology 70(16 Pt 2): 1411-1417.
- Foltynie T, Brayne C, Barker RA (2002) The heterogeneity of idiopathic Parkinson's disease. J Neurol 249: 138-145.
- Panzacchi A, Moresco RA, Garibotto V, Antonini A, Gobbo C, et al. (2008) A voxel-based PET study of dopamine transporters in Parkinson's disease: relevance of age at onset. Neurobiol Dis 31: 102-109.
- Wu Y, Le W, Jankovic J (2011) Preclinical biomarkers of Parkinson disease. Arch Neurol 68: 22-30.
- Berg D, Godau J, Walter U (2008) Transcranial sonography in movement disorders. Lancet Neurol 7: 1044-1055.
- Zecca L, Berg D, Arzberger T, Ruprecht P, Rausch WD, et al. (2005) In vivo detection of iron and neuromelanin by transcranial sonography: a new approach for early detection of substantia nigra damage. Mov Disord 20: 1278-1285.
- Olanow CW, Gauger LL, Cedarbaum JM (1991) Temporal relationships between plasma and cerebrospinal fluid pharmacokinetics of levodopa and clinical effect in Parkinson's disease. Ann Neurol 29: 556-559.
- Yuan Y, Tong Q, Zhang L, Jiang S, Zhou H, et al. (2016) Plasma antioxidant status and motor features in de novo Chinese Parkinson's disease patients. Int J Neurosci 126: 641-646.
- Bogdanov M, Matson WR, Wang L, Matson T, Saunders-Pullman R, et al. (2008) Metabolomic profiling to develop blood biomarkers for Parkinson's disease. Brain 131(Pt 2): 389-396.
- Weisskopf MG, O'Reilly E, Chen H, Schwarzschild MA, Ascherio A (2007) Plasma urate and risk of Parkinson's disease. Am J Epidemiol 166: 561-567.
- Chen H, O'Reilly EJ, Schwarzschild MA, Ascherio A (2008) Peripheral inflammatory biomarkers and risk of Parkinson's disease Am J Epidemiol 167: 90-95.
- Chambers JM (1983) Graphical methods for data analysis. Wadsworth International Group.
- Wheeler DJ, Chambers DS (1992) Understanding statistical process control. SPC press.
- Fisher RA (1925) Statistical methods for research workers. Genesis Publishing Pvt Ltd.
- Hogg RV, Ledolter J (1992) Applied statistics for engineers and physical scientists. Macmillan.