
Research Article
*Address for Correspondence: José Eduardo Corrente, Department of Biostatistics, Bioscience Institute, University of São Paulo State, Botucatu, São Paulo, Brazil, E-mail: jecorren@ibb.unesp.br
Citation: Corrente JE, Fumes G, Fontanelli M, Fisberg RM, Lobo Marchioni DM. Use of Asymmetric Models to Estimate the Distribution of Usual Nutrient Intakes. J Nutri Health. 2016;2(2): 6.
Copyright © 2016 Corrente et al. This is an open access article distributed under the Creative Commons Attribution License, which permits unrestricted use, distribution, and reproduction in any medium, provided the original work is properly cited.
Journal of Nutrition and Health | ISSN: 2469-4185 | Volume: 2, Issue: 2
Submission: 14 June, 2016 | Accepted: 13 July, 2016 | Published: 16 July, 2016
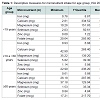
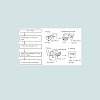 The fitted box-plots presented in Figure 1 highlighted the right asymmetry in the distribution of the micronutrient intake as well as the presence of discrepant points as, for example, calcium intake for teenagers (< 19 years), which the greater value intake was 3380.40 mg while the median was 545.25 mg. In Table 1, it can be observed high values of standard deviation (SD) for the majority of micronutrients. In this way, the descriptive measures suggested a statistical modelling using asymmetry and robust estimation.
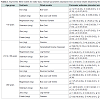 It can be observed in Table 2 the obtained estimate by the NCI method for the mean of distribution intake and the obtained estimate for the Box-Cox t and Box-Cox Cole-Green related to the median of it (denoted by μ) are very close to the values observed in the descriptive analysis (Table 1). The asymmetric models that refer to the mean of the intake distribution, in a general way, also presented plausible estimates. As an example, for the calcium intake, reverse Gumbel distribution for the age group less than 19 years old, the estimated mean was 231.96 mg, very close to that described by the raw data (233.60 mg). In relation to the Box-Cox t and Box-Cox Cole-Green models, it can be observed that the parameter estimate related to the data variability (σ), in which are very close to the observed values of the raw distribution (VC*), presented a lower estimate than the observed in data. This is expected as the model variability has been explained by the variance of the random effect (Table 1). It is also important to observe that the value of the standard deviation associated to the random effect was too low, exception for the magnesium at the first age group. With this fact, one can infer that between-person variability was not relevant, as observed by the individual profile.
About asymmetric models with energy adjustment, an interesting fact was that the variability of the random effect was close to zero, indicating that, probably, there is no need to consider this effect in the modelling, once no interference of it was observed.
Use of Asymmetric Models to Estimate the Distribution of Usual Nutrient Intakes
José Eduardo Corrente1,2, Giovana Fumes2, Mariane de Mello Fontanelli3, Regina Mara Fisberg3 and Dirce Maria Lobo Marchioni3
- 1Department of Biostatistics, Bioscience Institute, University of São Paulo State, Botucatu, São Paulo, Brazil
- 2Department of Exact Science, “Luiz de Queiroz” Agricultural College, University of São Paulo, Piracicaba, São Paulo, Brazil
- 3Department of Nutrition, Faculty of Public Health, University of São Paulo, São Paulo, Brazil
*Address for Correspondence: José Eduardo Corrente, Department of Biostatistics, Bioscience Institute, University of São Paulo State, Botucatu, São Paulo, Brazil, E-mail: jecorren@ibb.unesp.br
Citation: Corrente JE, Fumes G, Fontanelli M, Fisberg RM, Lobo Marchioni DM. Use of Asymmetric Models to Estimate the Distribution of Usual Nutrient Intakes. J Nutri Health. 2016;2(2): 6.
Copyright © 2016 Corrente et al. This is an open access article distributed under the Creative Commons Attribution License, which permits unrestricted use, distribution, and reproduction in any medium, provided the original work is properly cited.
Journal of Nutrition and Health | ISSN: 2469-4185 | Volume: 2, Issue: 2
Submission: 14 June, 2016 | Accepted: 13 July, 2016 | Published: 16 July, 2016
Abstract
The issue of estimating usual nutrient intake distribution is a challenge for dietitian and statistics. The 24-hour recall is usually one method to collect data and the distributions of usual nutrient intakes are, in general, asymmetric. Thus, this study aims to use asymmetric models in order to estimate the distribution of usual nutrient intakes. Data were drawn from a Health Inquires Survey from São Paulo city, Brazil. It was a cross-sectional population-based study with 1662 individuals. Two 24-hours recalls were collected and it was used in the Nutrition Data System for Research (NDSR) to obtain micronutrient intake data. A random intercept model was used to fit the distribution of micronutrient intake data, which characterizes different measures at the same subject. Asymmetric distributions were proposed for response variable and, for the random effect, a normal distribution was used. The results based on asymmetric models were compared with the National Cancer Institute (NCI) method for amount. No important differences among methods were observed, but this new approach shows advantages: it does not require data transformation and results can be directly interpreted from the estimated parameter of the considered distribution.Keywords
Micronutrient intake; NCI method; Asymmetric modelsIntroduction
A common purpose of the dietary assessment is to evaluate the dietary intake of a group or population in relation to one standard, also respecting both the nutrient adequacy and the prevention of chronic disease [1].There are several methods to measure the intake of nutrients and foods. The most commonly used method is the 24-hour dietary recall. Recall at a single point in time cannot accurately estimate the usual intake because the central characteristic of the diet is the daily variability [2]. Factors such as the day of the week, seasonality, among others contribute for this variability. Therefore, it is necessary to use statistical methods to estimate usual dietary intake in order to remove the within-person variability [3]. Likewise, some statistical methods have been developed to fit a measurement error model and also the prevalence of inadequacy intake is calculated based on a given standard of several nutrients according to the Estimate Average Recommendation (EAR) or the Adequate Intake (AI). Such methods are: National Research (NR), Iowa State University (ISU) and Iowa State University for Foods (ISUF), Best Power (BP) and National Cancer Institute (NCI). The frame of these methods is the same and the differences between them arise from different assumptions about the measurement characteristics of the 24-hour dietary recall [1]. The main point is that the NCI method leads to a substantial improvement over the other existing methods to estimate the distribution of usual intake. Extensions of this model also have been proposed including the episodically consume of foods [4].
When the distribution of the nutrient is very asymmetric, sometimes, the NCI method does not fit properly. An alternative method was used to fit the distribution of nutrient intake directly without considering the within-person variability [5]. The authors showed that the estimate inadequate prevalence of the considered nutrients was similar when using an empirical method. Based on this result, an asymmetric distribution can carry out for better results. Another point could be the use of models without the need of data transformation.
Hence, the aim of this paper is to use some asymmetric models to estimate the density of the usual intake and to make some comparisons with the NCI method for amount.
Methodology
Data were drawn from the Health Inquires survey of São Paulo (ISA-Capital 2008). This is a cross-sectional population-based study in a probabilistic sample of individuals living in permanent homes located within the urban area of São Paulo city, Brazil. The studied sample comprised 1662 individuals, from which 508 are adolescents (12-18 years), 637 adults (19-59 years) and 517 elderly (60 years or older) of both sexes. More details about the sampling design can be seen in [6].Demographic, socioeconomic and lifestyle data were collected from households using a structured questionnaire administered by trained interviewers and two 24-hour recalls were obtained for dietary intake.
Gender was analyzed as a dichotomous qualitative variable (male or female). Age was measured in years, and it was calculated as the difference between the date of data collection and the date of birth of the respondent. Family income per capital was calculated by summing the monetary income reported by all family members and divided by the number of family members, and classified as ≤ 1 minimum wage or > 1 minimum wage (minimum wage in 2008=US$ 260,00). Educational level of the head of the household was measured in years of schooling and categorized as ≤ 9 or ≥ 10 years of study.
The first 24-hour recall was collected in the home visit and conducted through the Multiple-Pass Method, in which the respondent is guided through five steps (quick list, forgotten foods list, time and occasion, detail and review, final probe) in a standardized process, which helps to maintain the individual interested and engaged in the interview, and helps them remember all the items consumed [7]. The second 24-hour recall was conducted by telephone using the interview system of the Nutrition Data System for Research (NDS-R) version 2007, developed by the Nutrition Coordinating Center at the University of Minnesota, Minneapolis, MN, USA, which resembles the Automated Multiple-Pass Method, as it enables the same structure to collect dietary data in five steps [8].
The Nutrition Data System for Research (NDSR) software uses the American food composition database developed by the United States Department of Agriculture (USDA) to transform the information from the 24-hour recall into nutrient intake. The adequacy of nutritional values of foods included in the software was checked using the Brazilian Table of Food Composition. Values of folate and iron were corrected considering the mandatory fortification of prevailing wheat and corn flours in Brazil since 2004. A consistency analysis of dietary data was performed in order to identify possible errors in data collection and processing.
Iron, calcium, magnesium, selenium, zinc, and folate intake were stratified by age range and were described in central tendency measures (mean, median, minimum, maximum) and variability measures (standard deviation, quartiles and variation coefficient - based on the median of the data distribution [9]), once the consumption is different considering this age range. Additionally, adjusted box-plots were presented to evidence the presence of outliers and the asymmetric data distribution [10].
A random intercept model was used to fit the micronutrient intake data which characterizes different measures at the same subject. The idea of modeling used is that the between-person variability is absorbed through the considered random effect and the within-person variability is absorbed for the own nature of the distribution of the chosen response variable which is similar to the model for amount-only model [11].
Asymmetric distributions were proposed for the response variable and for the random effect, a normal distribution with zero mean and variance κ2 was used. In order to select such asymmetric distributions, fitdist and histdist functions (from GAMLSS - Generalized Additive Models for Location, Scale and Shape, routine at R software, v.3.0.1) were used [12]. Next, the asymmetric models were adjusted for energy to verify the influence of the co-variable in the analysis. The penalized maximum likelihood method was used to estimate the parameters of the asymmetric models and the estimate processes were made by RS and CG interactive algorithm [13]. The variance of the random effect was estimate by gamlss.mx using EM algorithm. The fitted asymmetric models were made using R software, v.3.0.1 [14].
The National Cancer Institute (NCI) method for amount-only model which is presented in SAS version 9.3 software, it is implemented by MIXTRAN macro and it was used for comparison to the proposed models since it has a similar structure with the asymmetric models in this study. The average of usual intake estimated by the NCI method via DISTRIB macro is also shown for the purpose of comparison with the parameters estimated by asymmetric models.
Results
The participants presented mean age of 40.80 (±23,87) years old, mean familial income of 159.39 (±206.52) dollars; 56.80% (n=944) female and 43.20% (n=718) male; 51.38% (n=854) with up to one minimum wage (US$ 260,00 in 2008) and 48.62% (n=808) with more than one minimum wage; 63.88% (n=1045) head of family with up to 10 years of schooling and 36.12% (n=591) with more than 10 years of schooling.Table 1 presents minimum value, first quartile (25%), median, third quartile (75%) variance coefficient, mean and standard deviation of six micronutrient intakes (iron, calcium, magnesium, selenium, zinc and potassium) for individuals in age groups: < 19 years (n=508), ≥19 and < 60 years (n=637) and ≥ 60 years (n=517). Figure 1 presents the adjusted box-plots for each nutrient and each age group.
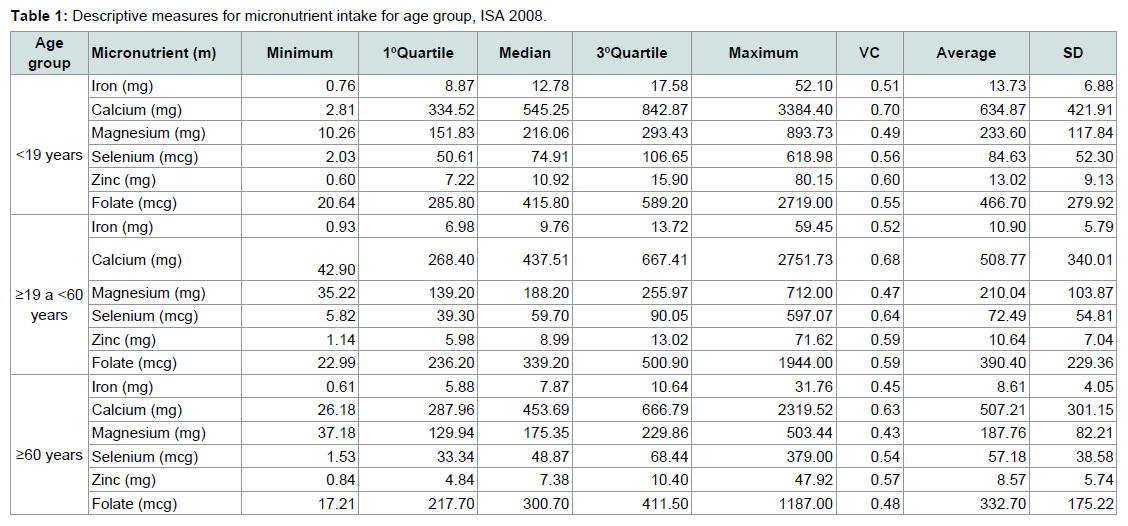
Table 1: Descriptive measures for micronutrient intake for age group, ISA 2008.
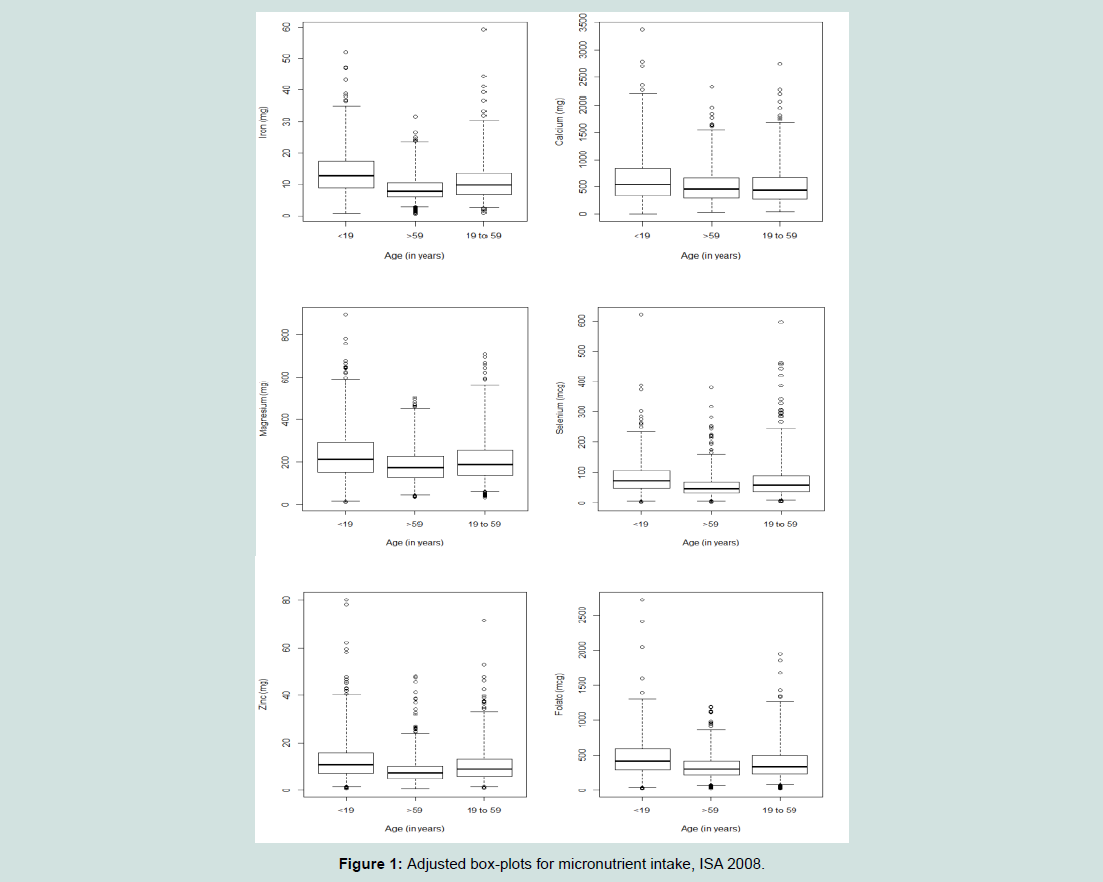
Figure 1: Adjusted box-plots for micronutrient intake, ISA 2008.
As the distribution of the data can be asymmetric and leptokurtic, fitdist and histdist functions were used in order to select the best distribution for each nutrient. The selected distribution were: gamma, reverse Gumbel, generalized inverse Gaussian, Log normal, Box-Cox t and Box-Cox Cole-Green.
Gamma is an asymmetric distribution for positive variables and depends on a shape parameter α and a scale parameter β. These two parameters are associated with the mean and the variance of the distribution. The reverse Gumbel distribution is a particular case of the extreme value distribution that arises in a logarithm form of a Weibull distribution. The parameters μ and σ of the reverse Gumbel, generalized inverse Gaussian and log normal distributions are associated with the mean and the variance, respectively. In the Box- Cox-t distribution, the parameters μ, σ, ν and τ can be interpreted as a scale (related to median), relative dispersion (associated to the variation coefficient, based on the median of the distribution), asymmetry (power transformation to symmetry) and kurtosis (degrees of freedom), respectively. In this case, the process of estimating the parameters is more robust. The Box-Cox Cole-Green is a special case of the Box-Cox t distribution when the parameter referred to the degrees of freedom number tends to infinity (similar to the existing relationship between t-Student and normal distribution, when the number of degrees of freedom is high). Besides, it is important to remember that the log normal distribution is a special case of Box-Cox Cole-Green distribution when the asymmetry parameter is zero. In this way, their parameters can be interpreted as related to the median and variation coefficient based on the median of the data distribution [14]. For random effect, a normal distribution with zero mean and variance κ2 was proposed.
Table 2 presents the fitted models and the estimate parameters as well as the mean intake obtained by NCI method for amount.
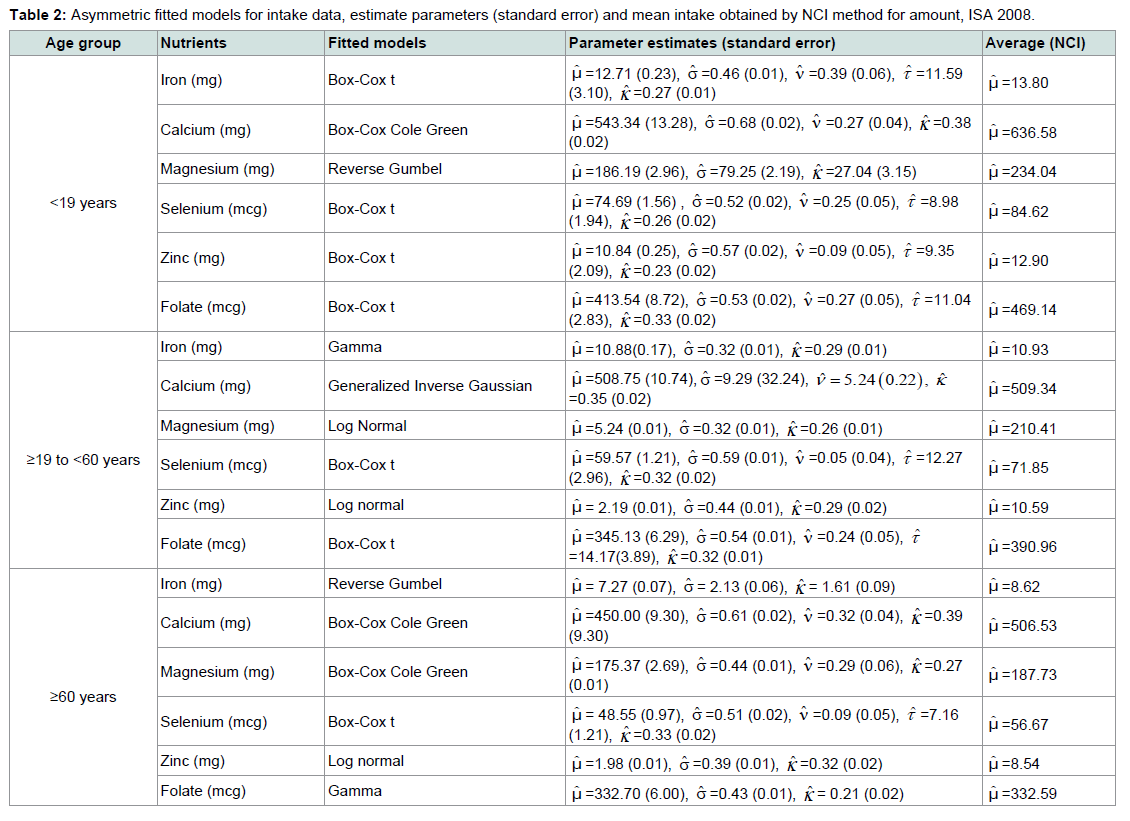
Table 2: Asymmetric fitted models for intake data, estimate parameters (standard error) and mean intake obtained by NCI method for amount, ISA 2008.
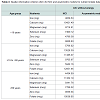
Akaike information criterion (AIC) was used to compare the NCI method and the asymmetric distribution for the distribution nutrient intake, presented on Table 3. From these obtained values, one can observe that there is not a significant difference between the NCI and the proposed asymmetric model. The same happens when energy was included in the model as a confounding factor.
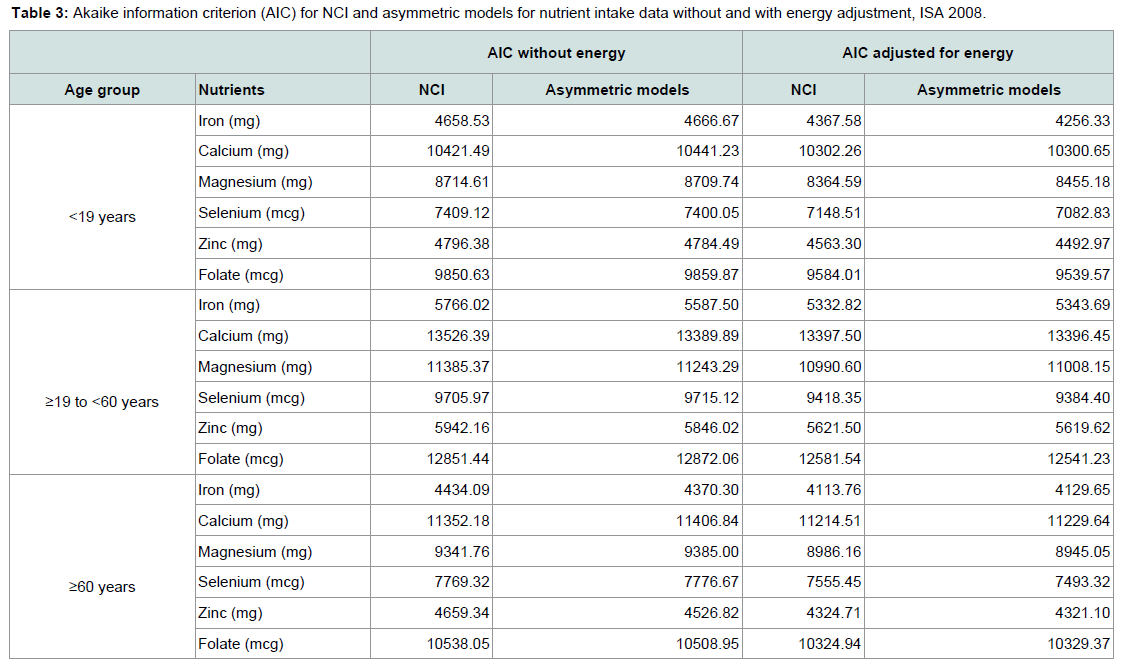
Table 3: Akaike information criterion (AIC) for NCI and asymmetric models for nutrient intake data without and with energy adjustment, ISA 2008.
Discussion
Several methods to estimate the distribution of the usual intake have been proposed in the literature as then NCI method (considered as a standard in this paper), MSM method (Multiple Source Method), ISU method (Iowa State University) and SPADE method (Statistical Program for Age-Adjusted Dietary Assessment). A comparative study using these four methods was made using two 24-hour recalls [15,16]. Authors warn that care must be taken in cases of high variability of high asymmetry. In the present study, descriptive analyses were made for the considered nutrients that presented asymmetric distribution and different models with different distributions could be fitted, providing similar goodness of fit to the NCI method for amount.As already mentioned, asymmetric distributions have already been used to model the nutrient intake, but without considering between and within variability [5]. In another approach, such variabilities were considered by means of modelling a new distribution class, named Box-Cox symmetric class [17]. In this case, data from three 24-hour recalls of older people were used and, again, values of AIC obtained from the Box-Cox symmetric class were very close to the NCI method for amount. This indicates that asymmetric models are effective to estimate the distribution of nutrient intake and to have the advantage of the direct interpretation of the involved parameters according to the used distribution, without the need to transform data and after analysis use a back transformation to get the estimate mean in the original scale, as the NCI method does.
Another advantage in using asymmetric models is the possibility to working with distributions that use the median and not the mean data as a central tendency parameter. In statistical analysis of continuous data, normal distribution is the most used due to its good properties, especially in the context of the linear models. However, outliers affect symmetry and also affect inference based on this model encouraging the development of robust procedures, which are defined as less sensitive than the pre assumptions on which they are based on [18].
Another important point is the practicality in using these models due the available tools in gamlss routine. One observed limitation in using such routine was, in some cases, the difficulty of getting the parameter estimate from some distributions fitdist selection criterion. For such cases, distributions were used based on values of AIC close to the ideal fit for the raw data.
It is worth to observe that, including the confounding variables in the distribution of nutrient intake, it seems that the parameters referred to the random effect decreases and, probably, this effect is not important. This fact has already been observed using the NCI method to obtain the inadequate prevalence of nutrient intake after including confounding variables [19]. In such case, the inadequate prevalence estimate became close to the obtained by the empirical distribution that does not take the variability (between and within person) in account. For the considered models, despite of not calculating the inadequate prevalence yet, the results are very similar, indicating that the between and within-person variability can lose their effect when confounding variables are included in the model.
Conclusion
It was proposed in this paper the use of asymmetric distributions to estimate the distribution of nutrient intakes based on a random effect model. The main advantages of this new approach are no data transformation and the direct interpretation of the results with the considered distributions. Other studies now can be developed using simulated situations, in order to evaluate the precision of the estimates and the manner to estimate the inadequate prevalence using such proposed models, as well as develop routines for implementing these distributions.Acknowledgements
The author would like to thank the São Paulo Foundation Research (FAPESP Process no. 2008/10261-8, 2012, 17454-1) and the National Council of Technological and Scientific Development (CNPq. Process no. 301197/2011-3) for financial support.References
- Dodd KW, Guenther PM, Freedman LS, Subar AF, Kipnis V, et al. (2006) Statistical methods for estimating usual intake of nutrients and foods: A review of the theory. J Am Diet Assoc 106: 1640-1650.
- Willett W (1998) Nutritional Epidemiology. Oxford University Press, USA, pp 514.
- Tooze JA, Midthune D, Dodd KW, Freedman LS, Krebs-Smith SM, et al. (2006) A new statistical method for estimating the usual intake of episodically consumed foods with application to their distribution. J Am Diet Assoc 106: 1575-1587.
- Kipnis V, Midthune D, Buckman DW, Dodd KW, Guenther PM, et al. (2009) Modeling data with excess zeros and measurement error: application to evaluating relationships between episodically consumed foods and health outcomes. Biometrics 65: 1003-1010.
- Corrente JE, Morimoto JM, Marchioni DML, Fisberg RM. (2011) Alternative distributions to estimate usual intake of nutrients for groups. J Life Sci 5: 569-574.
- Alves MC, Escuder MM (2008) Sample plan of ISA-Capital.
- Guenther PM, DeMaio TJ, Ingwersen LA, Berlin M (1995) The multiple-pass approach for the 24-hour recall in the continuing survey of food intakes by individuals (CSFII) 1994-1996. Mass: International conference on dietary assessment methods, Boston.
- Blanton CA, Moshfegh AJ, Baer DJ, Kretsch MJ (2006) The USDA automated multiple-pass method accurately estimates group total energy and nutrient intake. J Nutr 136: 2594-2599.
- Rigby RA, Stasinopoulos DM (2006) Using the Box-Cox t distribution in GAMLSS to model skewness and Kurtosis, Statistical Modelling 6: 209-229.
- Hubert M, Vandervieren E (2008) An adjusted boxplot for skewed distributions, Comput Stat Data Anal 52: 5186-5201.
- Tooze JA, Kipnis V, Buckman DW, Carroll RJ, Freedman LS, et al. (2010) A mixed-effects model approach for estimating the distribution of usual intake of nutrients: the NCI method, Stat Med 29: 2857-2868.
- Rigby RA, Stasinopoulos DM (2006) Statistical modelling using GAMLSS in R, London.
- Rigby RA, Stasinopoulos DM (2005) Generalized additive models for location, scale and shape Appl Stat 54: 507-554.
- Stasinopoulos DM, Rigby RA, Akantziliotou C (2008) Instructions on how to use the GAMLSS Package in R, London.
- Souverein OW, Dekkers AL, Geelen A, Hwubrock J, de Vries JH, et al. (2011) Comparing four methods to estimate usual intake distributions. Eur J Clin Nutr 65 Suppl 1: S92-S101.
- Waijers PM, Dekkers AL, Boer JM, Boshuizen HC, van Rossum CT (2006) The potential of AGE MODE, an age-dependent model, to estimate usual intakes and prevalences of inadequate intakes in a population. J Nutr 136: 2916-2920.
- Fumes G (2015) Box-Cox symmetric models and applications of nutritional data. PhD Thesis, Mathematics and Statistics Institute, University of São Paulo.
- Hampel FR, Ronchetti EM, Rousseeuw PJ, Stahel WA (1986) Robust statistics: the approach based on influence functions. John wiley & sons, New york.
- de Souza LB, Corrente JE, Papini SJ (2013) Prevalence of inadequacy intake for older people: The use of National Cancer Institute (NCI) Method. Food Nutr Sci 10: 25-30.