
Research Article
*Address for Correspondence: Ram B. Jain, Private consultant, 2959 Estate View Court, Dacula, GA, 30019, USA, Tel: 001-910-729-1049; E-mail: jain.ram.b@gmail.com
Citation: Jain RB. Thyroid Function and Phytoestrogens in General US Population. J Nutri Health. 2015;1(1): 6.
Copyright © 2015 Jain. This is an open access article distributed under the Creative Commons Attribution License, which permits unrestricted use, distribution, and reproduction in any medium, provided the original work is properly cited.
Journal of Nutrition and Health | ISSN: 2469-4185 | Volume: 1, Issue: 1
Submission: 15 July 2015 | Accepted: 07 August 2015 | Published: 11 August 2015

Levels of FT4 increased with increase in the levels of DAZ (β=0.004, p=0.03, Table 1), DMA (β=0.003, p=0.03, Table 1) and decreased with increase in the levels of ETD (β=-0.005, p< 0.01, Table 1). Levels in the third tertile of DAZ as compared to the first tertile of DAZ were also associated with higher levels of FT4 ( Table 2, Figure 2). Levels in the second tertile of EQU as compared to the first tertile of EQU were also associated with higher levels of FT4 ( Table 2, Figure 1). On the other hand, levels in the third tertile of ETD as compared to the first tertile of ETD were associated with lower levels of FT4 ( Table 2, Figure 1).Levels of TT4 decreased with increase in the levels of EQU (β=-0.007, p=0.01, Table 1), ETD (β=-0.009, p< 0.01, Table 1, and ETL (β=-0.008, Table 1, p< 0.01). Similar negative relationships for TT4 were observed between first and third tertiles of EQU, ETD, and ETL ( Table 2, Figure 2).
Thyroid Function and Phytoestrogens in General US Population
Ram B. Jain*
- Private Consultant, USA
*Address for Correspondence: Ram B. Jain, Private consultant, 2959 Estate View Court, Dacula, GA, 30019, USA, Tel: 001-910-729-1049; E-mail: jain.ram.b@gmail.com
Citation: Jain RB. Thyroid Function and Phytoestrogens in General US Population. J Nutri Health. 2015;1(1): 6.
Copyright © 2015 Jain. This is an open access article distributed under the Creative Commons Attribution License, which permits unrestricted use, distribution, and reproduction in any medium, provided the original work is properly cited.
Journal of Nutrition and Health | ISSN: 2469-4185 | Volume: 1, Issue: 1
Submission: 15 July 2015 | Accepted: 07 August 2015 | Published: 11 August 2015
Abstract
Data from National Health and Nutrition Examination Survey for the years 2007-2010 were used to evaluate the association between serum levels of six thyroid variables, namely, thyroid stimulating hormone (TSH), free and total triiodothyronine (FT3, TT3), free and total thyroxin (FT4, TT4), and thyroglobulin with the urinary levels of six phytoestrogens, namely, daidzein (DAZ), o-desmethylangolensin (DMA), equol (EQU), enterodiol (ETD), enterolactone (ETL), and genistein (GNS). Regression models with log10 transformed values of thyroid variables as dependent variables and age, gender, race/ethnicity, smoking status, iodine sufficiency status, body mass index, fasting time, urinary creatinine, and log10 transformed values of phytoestrogens as independent variables were fitted. Alternate models with tertiles of phytoestrogens in place of log10 transformed values of phytoestrogens were also fitted. Results of the tertile based models showed a negative association between the levels of FT3 and first and third tertiles of DMA, EQU, ETL and ETD. FT4 levels were positively associated with the levels of DAZ (β=0.004, p< 0.01) and DMA (β= 0.003, p< 0.01). TT4 levels were found to be negatively associated with the levels of EQU (β=-0.007, p=0.01), ETD (β=-0.009, p< 0.01), and ETL (β=-0.008, p< 0.01). Levels of urinary iodine were positively associated with the levels of every phytoestrogen.Keywords
Daidzein; Equol; o-desmethylangolensin; Enterodiol; Enterolactone; IodineAbbreviations
AGM: Adjusted Geometric Mean; DAZ: Daidzein; DMA: o-desmethylangolensin; EQU: Equol; ETD: Enterodiol; ETL: Enterolactone; FT3: Free Triiodothyronine; FT4: Free Thyroxine; GNS: Genistein; HISP: Hispanic; LOD: Limit of etection; NHANES: National Health and Nutrition Examination Survey; NHB: Non-Hispanic Black; NHW: Non-Hispanic hite; OTH: Other Unclassified Race/ethnicities; TGN: Thyroglobulin; TGNAb: Thyroglobulin antibodies; TPOAb: hyroid Peroxidase Antibodies; TSH: Thyroid Stimulating Hormone; TT3: Total Triiodothyronine; TT4: Total hyroxine; UGM: Un-adjusted Geometric Means; UIC: Urinary Iodine ConcentrationIntroduction
Phytoestrogens are plant-derived naturally occurring phenolic compounds which have estrogenic effects and they bind to estrogen receptors [1]. There are three classes of phytoestrogens, namely, isoflavones, lignans, and coumestans [2]. Isoflavones include genistein (GNS), daidzein (DAZ), and glycitein and they are found in the highest amounts in soybeans, miso, tofu, and legumes [2,3]. Lignans are constituents of linseed and sesame seeds and in lower concentrations; they are found in seed oils, whole grain cereals, beans, and other fruits and vegetables [3,4].Consumption of phytoestrogens has been associated with decreased incidence of diabetes and heart disease [5,6]. Consumption of soy isoflavones was found to reduce the risk of breast cancer incidence by 24% in Asian populations and breast cancer recurrence by 16% [7] but menopausal status may be an effect modifier. Among post-menopausal females, high lignan intake was shown to be associated with reduced risk of breast cancer by 15% [8]. In a metaanalysis, relative risk of ovarian cancer among those who consumed isoflavones was 0.63 and among those who consumed soy foods was 0.51 [9]. Relative risk of prostate cancer associated with soy consumption was shown to be 0.74 and with isoflavones, relative risk was 88% but this risk was shown to be 0.52 among Asian populations [10].
The role of phytoestrogens among those with metabolic syndrome has also been evaluated. In children and adolescents aged 6-18 years, enterolactone (ETL) and equol (EQU) were found to be inversely related to systolic blood pressure; triglycerides were related to DAZ, EQU, GNS, and o-desmethylangolensin (DMA); and a positive association between enterodiol (ETD) and fasting glucose [11] was also found. In postmenopausal females with metabolic syndrome, soy diet as compared to non-soy protein diet was associated with decreases in diastolic blood pressure, triglyceride levels, and C-reactive protein [12]. However, among those without metabolic syndrome, only EQU producers had reductions in diastolic blood pressure and C-reactive protein [12].
In a case-control study, consumption of traditional and nontraditional soy-based food and alfalfa sprouts was associated with reduced risk of thyroid cancer [13]. A 30-gram soy protein diet with 16 mg of phytoestrogens as compared to a 30 gram soy protein diet with 2 mg of phytoestrogens was found to have a 3-fold risk of developing overt hypothyroidism among those who had subclinical hypothyroidism [14]. Among healthy menopausal females, seaweed ingestion was associated with increased levels of urine iodine and serum TSH [15].
In a study among male Wistar rats fed with high phytoestrogen diet from conception to adulthood, withdrawal of dietary phytoestrogen in adult life was associated with increased body weight, adiposity, and energy intake [16]. Association of phytoestrogen withdrawal with elevated leptin and thyroxine and decreased thyroid stimulating hormone (TSH) levels was also observed [16]. In other words, lower levels of phytoestrogens are associated with lower levels of TSH and higher levels of thyroxine. Thus, at least in animals, phytoestrogen intake has the potential to affect thyroid function.
Thus, while phytoestrogens do seem to have potential to disrupt thyroid homeostasis in humans, I could not find any study that has evaluated the association between phytoestrogen levels and the levels of thyroid hormones in a nationally representative sample of humans. The questions that need to be answered are: if the consumption of phytoestrogens affects thyroid homeostasis, what is the direction of this effect? For example, does it raise TSH and lower free (FT4) and/or total thyroxine (TT4) levels or does it lower TSH levels and raise FT4 and/or TT4 levels? Do different phytoestrogens and/or their metabolites affect thyroid homeostasis in different directions? This study was undertaken to answer some of these questions. National Health and Nutrition Examination Survey (NHANES, www.cdc.gov/nchs/nhanes.htm) provides publically available data on urinary levels of six phytoestrogens and their metabolites as well as serum levels of six thyroid variables for the years 2007-2010. Consequently, a decision was made to use NHANES data for this study for the years 2007-2010.
Materials and Methods
NHANES (www.cdc.gov/nchs/nhanes.htm) data for those aged ≥ 12 years for the years 2007-2010 from demographic, phytoestrogen, thyroid profile, serum cotinine, urinary iodine, self-reported health conditions, prescription drug use, and fasting questionnaire files were downloaded and match merged. NHANES uses a complex, stratified, multistage, probability sampling designed as representative of the civilian, non-institutionalized U.S. population based on age, gender, and race/ethnicity. Sampling weights are created in NHANES to account for the complex survey design, including oversampling, survey non-response, and post-stratification. All data collection is done with the approval of the Institutional Review Board of the Centers for Disease Control and Prevention.There were six thyroid hormones for which data were available. They were: thyroid stimulating hormone (TSH), free triiodothyronine (FT3), total triiodothyronine (TT3), free thyroxine (FT4), totalthyroxine (TT4), and thyroglobulin (TGN). In addition, data were also available for thyroid peroxidase and thyroglobulin antibodies or TPOAb and TGNAb respectively. Data were available for 6 urinary phytoestrogens, namely, daidzein (DAZ), o-desmethylangolensin (DMA) which is a bacterial metabolite of DAZ, equol (EQU) which is also a metabolite of DAZ and as such is not of plant origin, enterodiol (ETD), enterolactone (ETL), and genistein (GNS). Percent values at or above the limit of detection (LOD) varied from a low of 94.4% for DMA to a high of 100% for DAZ and GNS. All values < LOD were imputed as LOD/Sqrt (2). It should be noted that NHANES analyzes a racemic mixture of both forms of equol, namely, S- and R-equol resulting in a single signal. These two enantiomers of equol are not distinguished in NHANES.
Quantitative detections of GNS, DAZ, EQU, DMA, ETD, and ETL are done by utilizing high performance liquid hromatographyatmospheric pressure methodology. The details are given at wwwn.cdc.gov/Nchs/Nhanes/2009- 010/PHYTO_F.htm#Description_of_Laboratory_Methodology. TSH is measured by a 3rd generation, two-site mmunoenzymatic (“sandwich”) assay. FT3, TT3, and TT4 are measured by a competitive binding immunoenzymatic assay. T4 assay is a two-step enzyme immunoassay. TGN assay is a simultaneous one-step “sandwich” assay. Details about ethodologies to measure thyroid hormones are available at wwwn.cdc.gov/Nchs/Nhanes/2009010/THYROD_F.htm#Description_of_Laboratory_Methodology.
There were a total of 4856 participants aged ≥ 12 years available for analysis. However, after removing those females who were pregnant at the time of participation in NHANES (N=42), who had missing values for smoking status (N=314) and/or iodine sufficiency status (N=282), who reported having current thyroid problems (N=283), who had TPOAb>20 IU/mL (N=266) and/or TGNAb> 35 IU/mL (N=70), and those who were taking thyroid prescription drugs (N=32), a total of 3699 participants remained available for final analysis. Detailed sample sizes were: NMales=1964, NFemales=1735, NAge: 12-19 years=714, NAge: 20-164 years=2311, NAge: 65+ years=674, NNon- Hispanic Whites=1601, NNon-Hispanic Blacks=760, NHispanics=1142, NOthers=196, NNonsmokers=2836, NSmokers=863, NUrine Iodine < 100 μg/L=1186, and NUrine Iodine ≥ 100 μg/L=2513. However, because of missing values for phytoestrogens and other dependent variables in the models, actual sample sizes used in the regression models were smaller.
For each of the six thyroid variables, namely, TSH, FT3, TT3, FT4, TT4, and TSH, a regression model was fitted. While, thyroid variables were used as dependent variables, the independent variables considered for regression modeling were: age (12-19 years, 20-64 years, 65+ year), race/ethnicity (non-Hispanic whites (NHW), non- Hispanic blacks (NHB), Hispanics (HISP), other unclassified race/ethnicities (OTH)), smoking status (nonsmoker, smoker), iodine sufficiency status (urine iodine concentration, UIC < 100 μg/L or iodine deficient, UIC ≥ 100 μg/L or iodine replete), body mass index, fasting time in hours before the blood was drawn for analysis, family poverty income ratio, and urine creatinine. In addition, testing session, i.e., morning and later during the day during which blood was drawn was included as an indicator variables in all regression models. Values of each thyroid variable were log10 transformed before using them as dependent variables in the models. Because of highly skewed distributions of phytoestrogens [17], values of phytoestrogens were also log10 transformed before feeding them into the regression models as independent variables. Thus, there were a total of 36 regression models that were fitted. In addition, another 36 models were fitted with tertiles of each of the six phytoestrogens being used as independent variables. Tertiles for DAZ were computed as follows: first tertile ≤ 26.7 ng/mL, second tertile between 26.7 and 134 ng/mL, and third tertile > 134.0 ng/mL. First tertile for DMA was set at ≤ 1.1 ng/mL, second tertile between 1.1 and 10.4 ng/mL, and third tertile > 10.4 ng/mL. First tertile for EQU was set at ≤ 3.83 ng/mL, second tertile between 3.83 and 10.6 ng/mL, and third tertile > 10.6 ng/mL. First tertile for ETD was set at ≤ 20.5 ng/mL, second tertile between 20.5 and 70.9 ng/mL, and third tertile > 70.9 ng/mL. First tertile for ETL was set at ≤ 135 ng/mL, second tertile between 135 and 558 ng/mL, and third tertile > 558 ng/mL. First tertile for GNS was set at ≤ 13.3 ng/mL, second tertile between 13.3 and 56.2 ng/mL, and third tertile > 56.2 ng/mL.
All analyses were done using SAS v. 9.3 (www.sas.com/en_us/home.html, SAS Institute, Cary, NC, USA). Specifically, SAS Procs SURVEYMEANS and SURVEYREG were used for all computations.
Results
There were six thyroid function variables and six phytoestrogen variables in the analysis for this study. This results in fitting 36 regression models with phytoestrogen variables as continuous variables and 36 regression models with phytoestrogen variables as categorical variables or as tertiles. These analyses resulted in 72 sets of adjusted geometric means (AGM) for thyroid function variables which for all practical purposes were similar and have been presented before in Jain [18,19] and as such, are only briefly mentioned below. Detailed Tables are presented as supplementary material. Statistically significant interactions at α=0.05 between (i) gender and age were observed for TSH, FT3, and TT3; (ii) gender and race/ethnicity for FT4, TT4, and TGN; (iii) age and race/ethnicity for TSH, FT3, TT3, and TGN; (iv) age and smoking status for FT3; and (v) age and iodine sufficiency status for TT3. AGMs by age are presented in Table S1, by age and race/ethnicity in Table S2, by age and iodine sufficiency status in Table S3, by age and smoking status in Table S4, by gender and age in Table S5, by gender and race/ethnicity in Table S6, and by smoking and iodine sufficiency status in Table S7. In accordance with the main focus of this study, i.e., the association between the levels of phytoestrogen and thyroid hormones, regression coefficients with p values for the models fitted with phytoestrogens as continuous variables is given in Table 1. R2 for the models varied from a low of 2.5% for FT4 to a high of 26.6% for FT3 ( Table 1). AGMs for thyroid hormones by the tertiles of all six phytoestrogens are given in Table 2.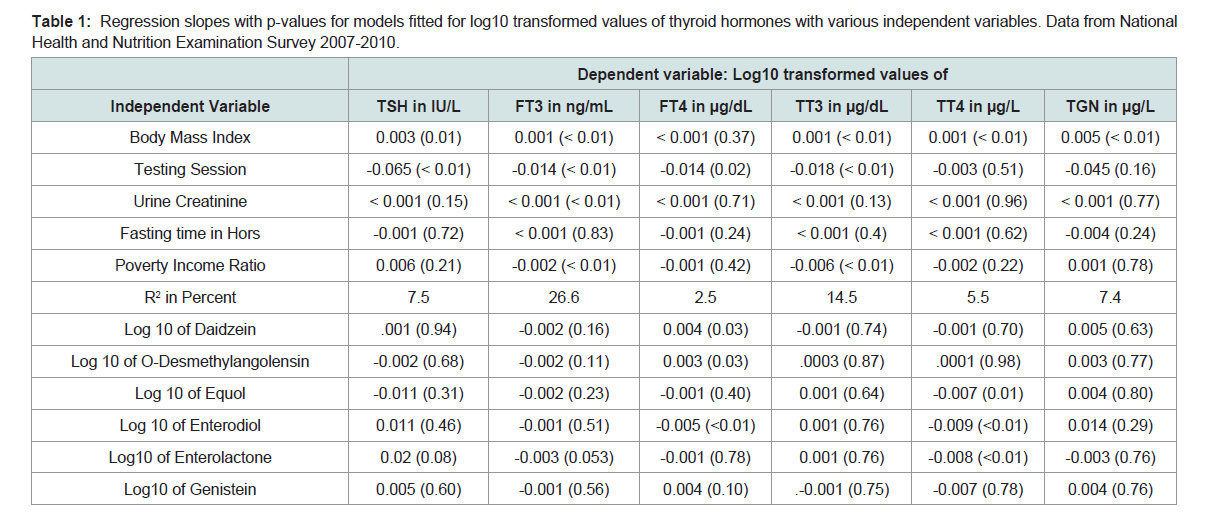
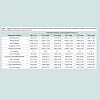
Table 1: Regression slopes with p-values for models fitted for log10 transformed values of thyroid hormones with various independent variables. Data from National Health and Nutrition Examination Survey 2007-2010.
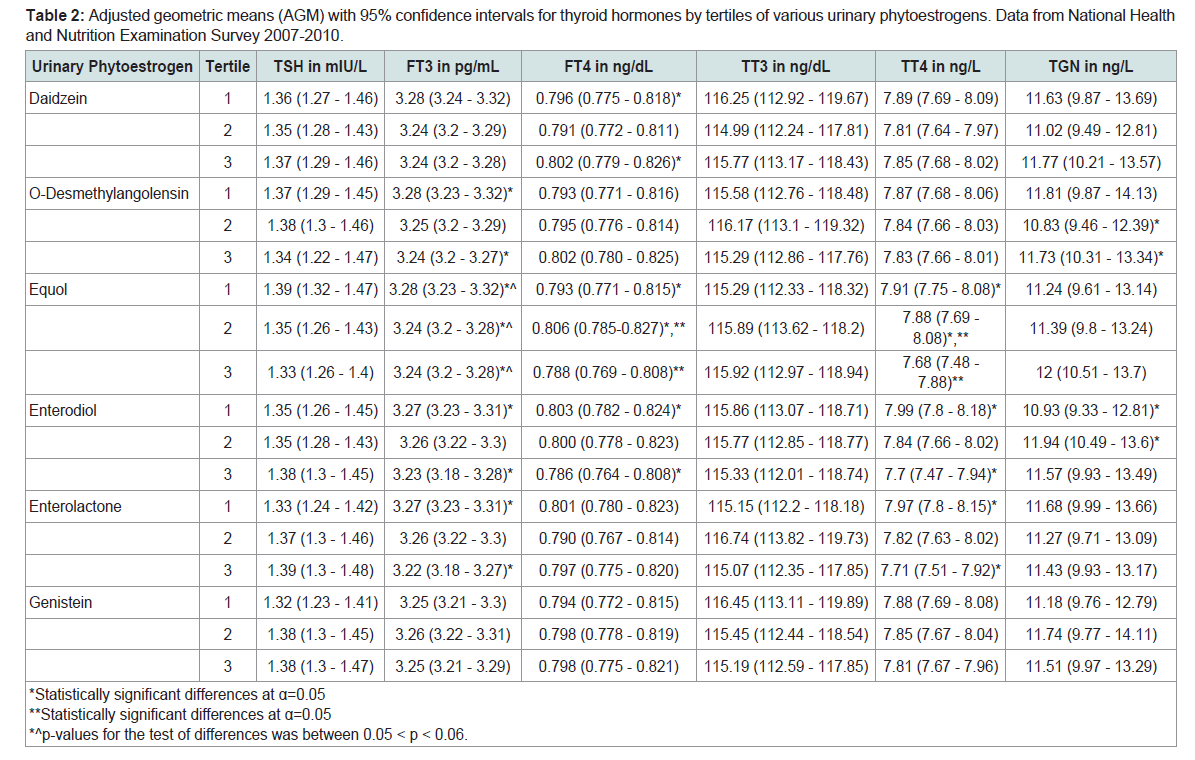
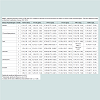
Table 2: Adjusted geometric means (AGM) with 95% confidence intervals for thyroid hormones by tertiles of various urinary phytoestrogens. Data from National Health and Nutrition Examination Survey 2007-2010.
Irrespective of the age group, usually, TSH levels by race/ethnicity, were found in the order NHB > HISP > NHW (Table S2) and within each age group, males had higher AGM than females (Table S5). Nonsmokers had higher levels of TSH than smokers (Table S7) and iodine deficients had lower levels of TSH than iodine replete (Table S7). Within each age group, males had higher levels of FT3 than females (Table S5) and FT3 levels decreased with increase in age (Tables S2, S4, and S5). NHB had the lowest levels of FT3 and HISP the highest levels within each age group (Table S2). For those aged 12-19 years, nonsmokers had higher levels of FT3 than smokers but the reverse was true for those aged 65+ years. NHW males had higher AGM than NHB males for FT4 (Table S6). Those aged 20-64 years old had lower FT4 levels than those aged 12-19 years and 65+ years (Table S1). TT3 levels decreased with increase in age (Tables S2, S3, and S5). Males had higher AGM for TT3 than females (Table S5). TT3 levels, in general, by race/ethnicity were in the order: NHB > HISP > NHW (Table S2). For 65+ years old, those with iodine deficiency had higher levels of TT3 than those who were iodine replete (Table S3). Irrespective of race/ethnicity, males had lower levels of TT4 than females (Table S6). Both NHW and NHB had lower levels of TT4 than HISP (Table S6). Smokers had higher AGM for TGN than nonsmokers (Table S7). NHW and NHB males had lower levels of TGN than NHW and NHB females (Table S6). For both males and females, NHB had higher levels of TGN than NHW and HISP had lower levels than NHB (Table S6).
Levels of every thyroid hormone except FT4 increased with increase in body mass index ( Table 1). Poverty income ratio was inversely associated with the levels of FT3 (β=-0.002, p< 0.01, Table 1) and TT3 (β=-0.006, p< 0.01, Table 1). Those who were tested later during the day had lower levels of TSH (β=-0.065, p< 0.01, Table 1), FT3 (β=-0.014, p< 0.01, Table 1), FT4 (β=-0.014, p=0.02, Table 1), and TT3 (β=-0.018, p< 0.01, Table 1).
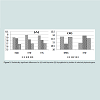
Levels of TSH, FT3, TT3, and TGN were not found to be associated with the levels of any of the six phytoestrogens tudied here ( Table 1). Even though FT3 was not found to be associated with the levels of phytoestrogens when phytoestrogens were used as continuous variables in the regressions models, statistically significant association of FT3 with DMA, EQU, ETD, and ETL ( Table 2, Figure1) were observed. Levels of FT3 were higher for the first tertile of DMA than with the third tertile (Table 2, p< 0.05). The same was true was both ETD and ETL ( Table 2, Figure 1). Even EQU had a borderline negative relationship with FT3 ( Table 2, 0.05 < p < 0.06).
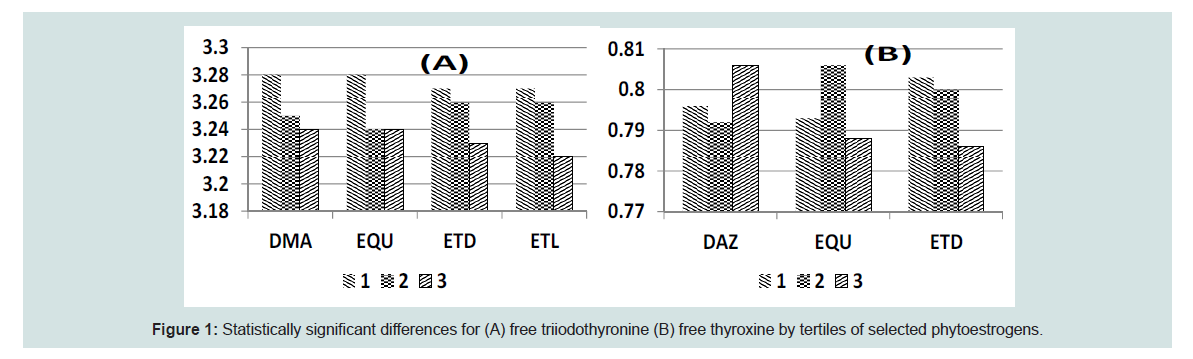
Figure 1: Statistically significant differences for (A) free triiodothyronine (B) free thyroxine by tertiles of selected phytoestrogens.
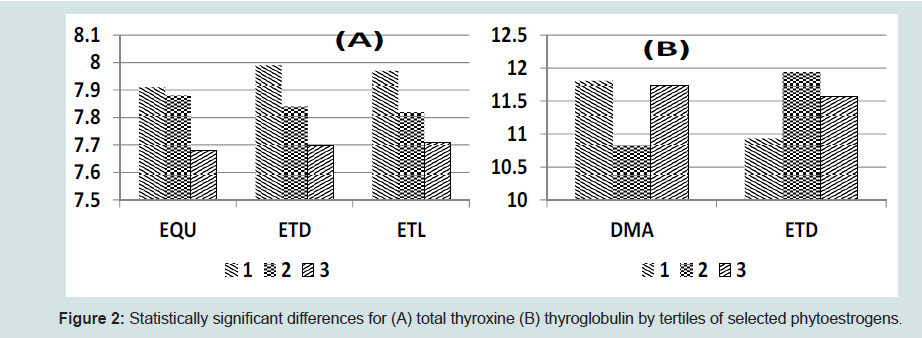
Figure 2: Statistically significant differences for (A) total thyroxine (B) thyroglobulin by tertiles of selected phytoestrogens.
No statistically significant association between the levels of TGN and phytoestrogens were observed when phytoestrogens were used as continuous variables in the regression models ( Table 1). However, when phytoestrogens were used as categorical variables in the regression models, higher levels of TGN with the levels of DMA in the third tertile as compared with the levels in second tertile of DMA were observed (11.73 vs. 10.83 ng/mL, p< 0.05, Table 2, Figure 2). Similarly, levels of TGN rose from 10.93 ng/mL for the first tertile of ETD to 11.94 ng/mL for the second tertile of ETD (Table 2, p< 0.05, Figure 2).
Discussion
Association between thyroid function and isoflavones DAZ and its metabolites EQU and DMAWhile statistical significance was not uniformly observed, there does seem to be an inverse association between the levels of FT3 and DAZ as well as EQU, DMA, ETD, and ETL ( Tables 1 and 2). TT3 was not found to be correlated with DAZ, EQU, or DMA. On the other hand, even when statistical significance was not necessarily achieved, there is certainly some evidence of a positive association between the levels of FT4 and DAZ as well as DMA and possibly EQU ( Tables 1 and 2). And, surprisingly, levels of TT4 were statistically significantly negatively associated with the levels of EQU. In the animal study by Andreolli et al. a negative association between phytoestrogens and TT4 and a positive association between phytoestrogen levels and TSH was discovered [16]. While, an association between phytoestrogen levels and TSH was not observed in this study, the negative association of FT3 with DAZ, EQU, and DMA; and the negative association between EQU and TT4 are in parallel with what was found by Andreoli et al. [16]. However, positive association between FT4 and DAZ and DMA is a new finding in this study. It looks like different isoflavones may correlate differently with different thyroid hormones and possibly in opposite directions.
Association between thyroid function and enterolignans ETD and ETL
The negative associations between isoflavones and FT3 and TT4 were also observed for lignanas. Both ETD and ETL had negative associations with both FT3 and TT4 (Table 2). In addition, ETD also had negative association with FT4. Thus, negative association between soy diet (or isoflavones) and TT4 found by Andreoli et al. also seems to be applicable to lignan metabolites [16].
Conclusion
A statistically significant negative correlation between FT3 and, DMA, ETD and ETL ( Table 2) and a statistically significant positive correlation between FT4 and DAZ and DMA seemed to be indicative of interaction of iodine levels with DAZ and DMA. In order to confirm this conjecture, we computed nonparametric Spearmans’ correlations between urinary iodine and each of the six phytoestrogens by iodine sufficiency status and the results confirmed our conjecture (Table S8). Each of the six phytoestrogens had nonlinear correlations with urinary iodine. While correlations were substantially higher of the order of 0.2 with lower values of urinary iodine or when iodine was deficient, the correlations were substantially smaller of the order of 0.15 with higher values of urinary iodine or when iodine was replete. When iodine sufficiency status changed from deficient to replete, the correlation with DAZ changed from 0.21 to 0.13 and for DMA from 0.13 to 0.08. Change in correlations with change in iodine status from deficient to replete was highest for ETD (from 0.22 to 0.08) and ETL (from 0.16 to 0.02). Thus, in order to assess the associations of phytoestrogens with certain other health indicators, for example, thyroid health, it is necessary that the effect modifying status of iodine be actively and simultaneously considered. This recommendation was further strengthened by the fact the unadjusted geometric means associated with iodine deficiency were statistically significantly lower than those associated when the iodine sufficiency status was iodine replete (Table S9). In fact, for each of the six urinary phytoestrogen variables considered in this study, unadjusted geometric means associated with iodine deficiency for DAZ, DMA, EQU, and GNS were about half of what they were for when the iodine sufficiency status was iodine replete (Table S9). Even for ETD and ETL, unadjusted geometric means associated with iodine deficiency were about 40% lower than what they were when the iodine sufficiency status was iodine replete (Table S9).Thus, there is evidence from this study that the consumption of phytoestrogens do seem to affect the levels of FT3, TT3, and TT4 as well as TGN ( Table 2) and direction of effect by different phytoestrogens is not necessarily the same for FT3, FT4, and TT4. On the other hand, in contradiction to the results observed by Horn- Ross et al. Teas et al. and Andreoli et al. I could not find any effect of phytoestrogens on the levels of TSH [13,15,16]. These differences are probably due to the differences in study design and the populations covered by these studies. However, increase in iodine levels with increases in the levels of phytoestrogens was confirmed as was shown by Teas et al. [15]. Because of certain undeniable beneficial health effects [4] of the consumption of phytoestrogens, the challenge for the researchers will be to find at what specific levels what specific phytoestrogens outweigh other health benefits with possible potential to disrupt thyroid homeostasis. Even bigger challenge may be to translate observed phytoestrogen levels with “net” health benefits to recommended levels of phytoestrogen containing foods for daily consumption.
In summary, though, (i) serum FT3 levels were negatively associated with urinary levels of DMA, EQU, ETD, and ETL (ii) serum FT4 levels were positively associated with urinary levels of DAZ, DMA, and EQU, (iii) serum TT4 levels were negatively associated with urinary levels of DAZ , EQU, ETD, and ETL, (iv) here was a positive association between urinary iodine levels with the urinary levels of DAZ, DMA, EQU, ETD, ETL, as well as GNS but the size of correlation decreased with increase in the urinary levels of iodine, and (v) those who were iodine deficient had substantially lower levels of DAZ, DMA, EQU, ETD, ETL, as well as GNS than those who were iodine replete.
References
- Turner JV, Agatonovic-Kustrin S, Glass BD (2007) Molecular aspects of phytoestrogen selective binding at estrogen receptor. J Pharm Sci 96: 1879-1885.
- Dueregger A, Heidgger I, Ofer P, Perktold B, Ramoner R, et al. (2014) The use of dietary supplements to alleviate androgen deprivation therapy side effects during prostate cancer treatment. Nutrients 6: 4491-4519.
- Manach C, Scalbert A, Morand C, Remsey C, Jimenez L (2004) Polyphenols: food sources and bioavailability. Am J Clin Nutr 79: 727-747.
- Adlecreutz H (2007) Lignans and human health. Crit Rev Clin Lab Sci 44: 483-525.
- Villegas R, Gao YT, Yng G, Li HL, Elasy TA, et al. (2008) Legume and soy food intake and the incidence of type 2 diabetes in Shangai Women’s Health Study. Am J Clin Nutr 87: 162-167.
- Zhang X, Shu XO, Gao YT, Yang G, Li Q, et al. (2003) Soy food consumption is associated with lower risk of coronary heart disease in Chinese women. J Nutr 133: 2874-2878.
- Dong JY, Qin LQ (2011) Soy isoflavones consumption and risk of breast cancer incidence or recurrence: a meta-analysis of prospective studies. Breast Cancer Rest Treat 125: 315-323.
- Buck K, Zaineddin AK, Vrieling A, Linseisen J, Chang-Claude J (2010) Meta-analysis of lignans and enterolignanas in relation to breast cancer risk. Am J Clin Nutr 92: 141-153.
- Qu XL, Fang Y, Zhang M, Zhang YZ (2014) Phytoestrogen intake: a meta-analyis of 10 observational study. Asian Pac J Cancer Prev 15: 9085-9091.
- Yan L, Spitznagel EL (2009) Soy consumption and prostate cancer risk in men: a re-visit of a meta-analysis. Am J Clin Nutr 89: 1155-1163.
- Jeng HA, Kantaria K, Beydoun HA (2015) Urinary phytoestrogens in relation to metabolic disturbances among children and adolescents. J Environ Sci Health B 50: 121-127.
- Acharjee S, Zhou JR, Elajami TK, Welty FK (2015) Effect of soy nuts and equol status on blood pressure, lipids and inflammation in postmenopausal women stratified by metabolic syndrome status. Metabolism 64: 236-243.
- Horn-Ross PL, Hoggatt KJ, Lee MM (2002) Phytoestrogens and thyroid cancer risk: the San Francisco Bay Area thyroid cancer study. Cancer Epidemiol Biomarkers Prev 11: 43-49.
- Sathyapalan T, Manuchehri AM, Thatcher NJ, Rigby AS, Chapman T, et al. (2011) The effect of soy phytoestrogen supplementation on thyroid status and cardiovascular risk markers in patients with subclinical hypothyroidism: a randomized double blind cross-over study. J Clin Endocrinol Metab 96: 1442-1449.
- Teas J, Braverman LE, Kurzer MS, Pino S, Hurley TG, et al. (2007) Seaweed and soy: companion foods in Asian cuisine and their effects on thyroid function in American women. J Med Food 10: 90-100.
- Andreoli MF, Stoker C, Rossetti MF, Alzamendi A, Castrogiovanni D, et al. (2015) Withdrawal of dietary phytoestrogens in adult male rats affects hypothalamic regulation of food intake, induces obesity and alters glucose metabolism. Mol Cell Endocrinol 401: 111-119.
- Ryback ME, Sternberg MR, Pfeiffer CM (2013) Sociodemographic and lifestyle variable are compound- and class-specific correlates of urine phytoestrogen concentrations in the U.S. population. J Nutr 1013: 986S-994S.
- Jain RB (2013) Association between thyroid profile and perfluoroalkyl acids: data from NHANES 2007-2008. Environ Res 126: 51-59.
- Jain RB (2014) Association between thyroid function and selected organochlorine pesticides: data from NHANES 2001-2002. Sci Total Environ 466-467: 706-715.