
Unobtrusive and Highly Accurate Breath Alcohol Analysis Enabled by Improved Methodology and Technology
Bertil Hök1, Jonas Ljungblad*1,2, Annika Kaisdotter Andersson1, Mikael Ekström2 and Mats Enlund3
- 1Hök Instrument AB, Flottiljgatan 49, SE-721 31 Västerås, Sweden
- 2Mälardalen University, Västerås, Sweden
- 3Department for Clinical Research, Västerås Sjukhus, Västerås, Sweden
*Address for Correspondence: Jonas Ljungblad, Mälardalen University & Hök Instrument AB, Västerås, Sweden E-mail: jonas.ljungblad@hokinstrument.com
Citation: Hök B, Ljungblad J, Andersson AK, Ekström M, Enlund M. Unobtrusive and Highly Accurate Breath Alcohol Analysis Enabled by Improved Methodology and Technology. J Forensic Investigation. 2014;2(4): 8.
Copyright ©2014 Hök B, et al. This is an open access article distributed under the Creative Commons Attribution License, which permits unrestricted use,distribution, and reproduction in any medium, provided the original work is properly cited.
Journal of Forensic Investigation | ISSN: 2330-0396 | Volume: 2, Issue: 4
Submission: 25 September, 2014| Accepted: 22 October, 2014 | Published: 24 October, 2014
Abstract
The study objective was to evaluate a novel method and technology for unobtrusive determination of breath alcohol in relation to current industrial accuracy standards. The methodology uses carbon dioxide as a tracer gas detected by sensor technology based on infrared spectroscopy. Part one of the investigation was to analyse the performance of hand-held prototype devices and included tests of resolution, unit-to-unit variation during calibration, response to alcohol containing gas pulses created with a wet gas simulator, and cross sensitivity to other substances. In part two of the study, 30 human participants provided 1465 breath tests in both unobtrusive and obtrusive use modes. The results of both parts of the study indicate that the prototype devices exceeded present industrial accuracy requirements. The proposed methodology and technology eliminate the previous contradiction between unobtrusiveness and high accuracy.Keywords
Breath alcohol analysis; Infrared spectroscopy; Accuracy; UnobtrusivenessIntroduction
Alcohol misuse remains a major health issue and a dominant cause of serious traffic accidents in almost all societies. Many informative and persuasive initiatives have been undertaken. Their importance is beyond dispute, but a holistic approach including clever management, adequate resources, and sustainability, is required for them to be maximally effective [1]. The availability of adequate methods and devices to determine breath alcohol on a massive scale is also needed.Breath alcohol analysis methodology has developed steadily during recent decades. The physiological rationale for replacing blood analysis with breath analysis is now widely recognized [2,3] and some countries have even introduced breath alcohol concentration (BrAC) to drunk driving legislation [4].
Breath alcohol sensor technologies based on electrochemical devices and infrared spectroscopy have evolved and facilitated the development of products for collecting evidence and screening [5]. Industrial standards have also been established for evidential instruments [6], alcohol interlocks [7], and alcometers for screening [8] and for public use [9].
There is a growing demand for more user-friendly and less obtrusive techniques and devices that do not sacrifice accuracy and reliability.The DADSS (driver alcohol detection system for safety) program is one prominent example [10,11]. It is aiming at unobtrusive operation, while maintaining requirements on accuracy which are matching or even surpassing those of evidential instruments [6].
In earlier publications, we have demonstrated methods for contactless determination of BrAC [12,13] in screening applications where sobriety is expected to be the norm. The physiological rationale of using a tracer gas, e.g. CO2, for contactless determination was examined [14], and the usefulness of this technique in patients with reduced consciousness was demonstrated [15]. Recently, unobtrusive BrAC determination [16] was demonstrated and progress concerning measurement accuracy was reported [17].
In this paper, the seemingly contradictory demands for both unobtrusiveness and high accuracy are addressed. New experimental results from tests using both artificial and human subjects are provided. The interpretation of these results is discussed in a wider context, including an issue recently raised by Grubb et al. [18] in this journal, in which the use of CO2 as a tracer gas was supposed to “introduce methodological flaws”.
Methods and Materials
In this section we address the methodology used in the present investigation, in relation to industrial standards, the adapted technology, and breath alcohol determination in general. The distinction between technical and physiological error sources is outlined, with special attention to the need for unobtrusive measurement.Industrial Standards
In Table 1, the current industrial standard accuracy requirements are summarized. The technical accuracy of breath alcohol analysers is commonly expressed as a combination of an offset error expressed in mg/L and a calibration error expressed in the percentage of the reading. In alcohol interlocks, the allowed error close to the concentration limit is also specified as a maximum allowed error using a function test with an artificial gas pulse generator. The cross sensitivity to common endogenic or exogenic substances is specified as the ratio between the maximum allowed reading and the reading at the same concentration of ethyl alcohol (EtOH).
In many applications, breath alcohol analysers are used to classify whether a specific concentration limit has been exceeded or not. For example, most European countries have a legal concentration limit of 0.25 mg/L for drunk driving; which approximately corresponds to a blood concentration of 0.05%. In the classifier situation, the accuracy of a breath alcohol sensor can be described by its ability to discriminate between true positive and negative outcomes, and the corresponding false positive and negative outcomes.
Technology, Prototypes, and Modes of Operation
19] with a 1.2 m optical path for EtOH and a 30 mm optical path for CO2. The cell includes emitters and detectors tuned to the absorption peaks of EtOH at a wavelength of 9.5 μm, and CO2 at 4.26 μm. Signal conditioning, including algorithms for determining BrAC, is performed by onboard electronic circuitry. Photographs of the measuring cell and the hand-held prototype device are shown in (Figure 1). Further details of the technology and engineering solutions have been published elsewhere [13,17].
Table 1: Technical accuracy requirements according to current industry standards.
Resolution, Calibration, and Function Tests
Breath analyser resolution is determined by noise behaviour. The prototypes were tested by analysing the EtOH channel output, according to principles developed by Allan [20], by graphing the background noise plotted against the magnitude of the time window.
Calibration was performed in a chamber as shown in Figure 2, left. A precisely controlled volume of pure EtOH is injected into the chamber and the sensor response is measured. The procedure is repeated for each of eight concentrations 0, 0.1, 0.2, 0.3, 0.4, 0.5, 1.2 mg/L. Individual calibration parameters are stored in an electrically erasable programmable read-only memory in each device in order to standardize the output. The calibration procedure is finalized by verification against a reference sensor. The equipment used for the function test (Figure 2) includes bottled gas with precisely controlled EtOH and CO2 concentrations. Gas pulses from the bottles are passed through an aqueous solution, corresponding to the specific EtOH concentration, where it becomes saturated with water vapour corresponding to a human breath.
 The functional tests were performed with N=97 of 0.1 mg/L gas pulses on four units, using the output of an evidential instrument (Evidenzer; Nanopuls AB, Uppsala, Sweden) as a reference. Thus, each breath test could be quantified with respect to its deviation from the reference value. A histogram of the statistical distribution provided evidence of both systematic and random error.
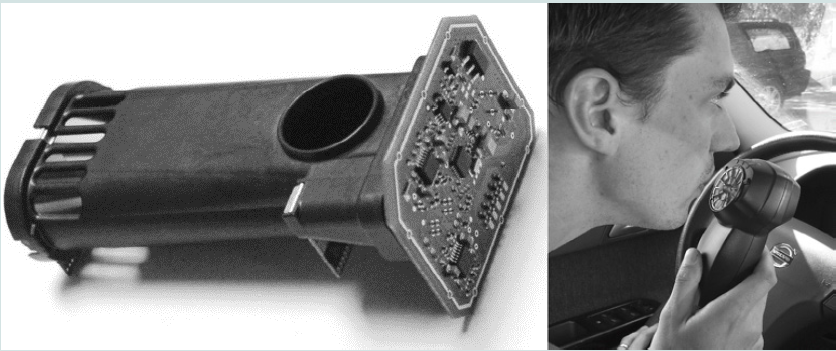
Figure 1: Left: The measuring cell includes an electronic circuit board for signal conditioning. Right: Prototype of the hand-held breath alcohol analyser in its intended testing environment inside a vehicle.
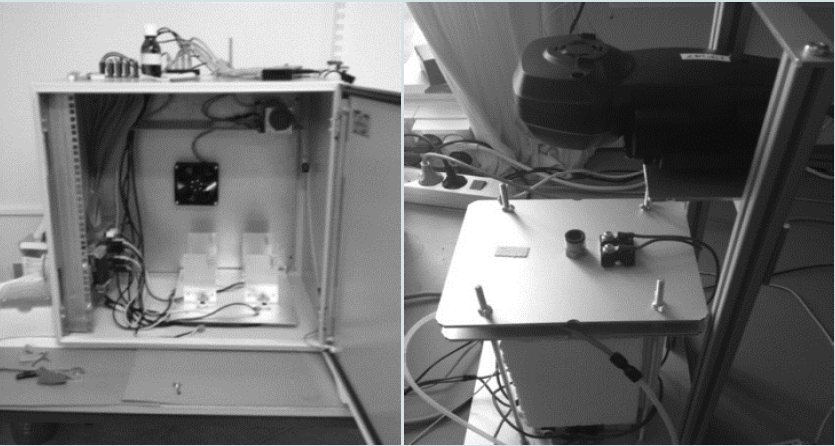
Figure 2: Equipment used for calibration (left) and function test (right).
The cross-sensitivity of each prototype device was tested by exposing it to controlled concentrations of various substances, recording the output signal, and comparing it to the signal obtained when subjecting it to the equal concentration of EtOH. Most of these substances have infrared absorption spectra that are widely different from EtOH; therefore, their cross-sensitivities will be negligible. Calculations were performed on all substances using a public database [21] and measurements were performed for the most critical substances.
Unobtrusive Measurement and Physiological Error Sources
In accordance with Zaouk et al. [10] and Ferguson et al. [11], breath alcohol determination is said to be unobtrusive if it does not interfere with the normal activities of a sober test subject. A breath may be unobtrusively detected by a sensor located at a distance of 10-20 cm from the test subject’s mouth, but it will be diluted with ambient air by a factor of as much as 5-10. This corresponds to the long-range operational mode used in this investigation.
When used in the short- and long-range operational modes, the BrAC value was calculated using the equation (1) [13,14]:
 Where EtOHmeas, and CO2meas represent measured values, and CO2alv represents the alveolar CO2 concentration, which was setat 4.8 vol% in this investigation [22]. D is the dilution factor. The background CO2 concentration, CO2background, is typically 0.04-0.06% [23]. The fact that the background concentration is normally less than two orders of magnitude lower than the alveolar concentration allows for the possibility of a large dilution factor and unobtrusive determination. The standard deviation of alveolar CO2concentration between individuals is approximately 10% [22], but a larger variability of end-expiratory concentration can be expected from shallow breathing and other factors [14].
Human Subjects Test
Out of 30 test subjects, 19 were male and 11 were female, and all were between 19 and 70 years old. Male subjects were given 0.6 g of EtOH per kilogram of body mass and the corresponding amount given to female subjects was 0.55 g of EtOH per kilogram of body mass. Alcohol was consumed in less than 15 minutes and provided an intoxication level of approximately 0.4mg/L. BrAC determinations were then performed every 20 minutes during the EtOH elimination phase. Each measurement set consisted of one test in a reference instrument, one test into the prototype fitted with a mouthpiece, one breath test towards the prototype at a distance of approximately 3 cm, and one test towards the prototype at a distance of approximately 15 cm. In the latter two tests, CO2 was used to account for the dilution of the breath sample. In total, 1465 tests were performed with the prototype and statistically analysed. The study results thus include technical, physiological, and behavioural error sources. The human subjects study was approved by the Swedish Ethical Review Board in Uppsala (Dnr 2013/089). The reference instrument used throughout the human subject trials was an evidential breath analyser (Evidenzer; Nanopuls AB). Apart from EtOH, the reference instrument was also capable of measuring CO2 and water concentration in undiluted breath samples. The data collected from human subjects were analysed with respect to compliance with industrial standards.
Results
Results are presented from tests performed on prototype devices using both artificial and human breath.Resolution, Calibration, and Function Test Cross-sensitivity
Resolution was determined by the EtOH sensor signal noise behaviour. Ideally, “white” noise dominates with a uniform spectral distribution. If the noise magnitude is plotted against the time window of the measurement, one normally observes a declining characteristic until a minimum is reached. At some point, long-term drift becomes more dominant, which causes the noise to increase. This behaviour was observed in our prototypes (Figure 3). With an integration time of 1 second, the resolution is approximately 0.0009 mg/L. A minimum is observed at approximately 800 seconds, which is more than one order of magnitude lower than the 1 second value.
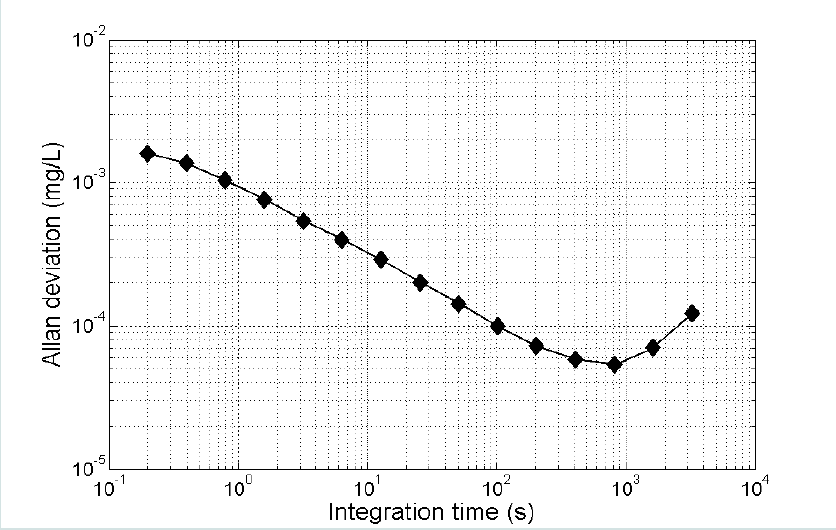
Figure 3: Allan deviation as a function of integration time.
Figure 4 shows a histogram illustrating the variation of thecalibration factor in 115 prototype units. The average value deviated by less than 0.003 mg/LEtOH from the nominal 0.40 mg/L, and the standard deviation was 0.007 mg/L, or 1.75% of the nominal value.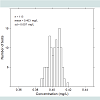 Function tests were performed on four prototypes and 97 breath tests were performed using artificial gas pulses having an EtOH concentration of nominally 0.1 mg/L. The tests were performed at room temperature. The results are summarized in Figure 5 , which shows a test result distribution histogram.
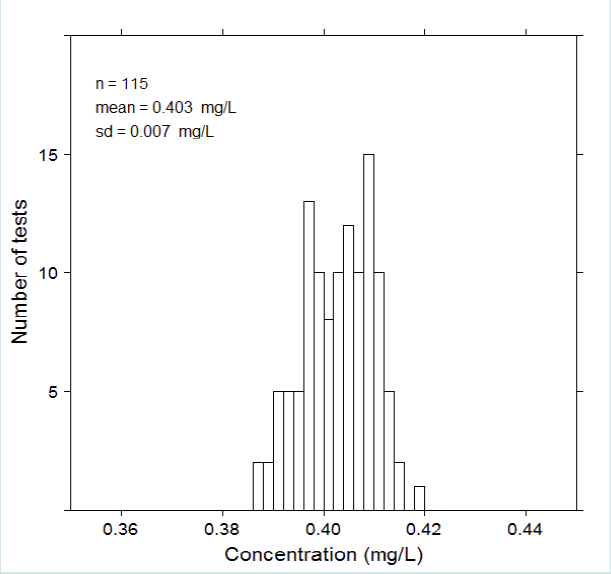
Figure 4: Unit-to-unit variation of calibration factor for a batch of 115 prototype units.
Figure 5 illustrates that the measured concentrations have a normal statistical distribution with no major skewness. Compared with the Evidenzer value, the systematic error defined as the deviation between the measured average and the nominal values, was less than 0.01 mg/L, and the standard deviation of the random error was 0.006 mg/L. The units were used in the contact less mode of operation using CO2 as a tracer gas. The observed variability was considerably smaller than the requirements according to industrial standard EN50436-1,2.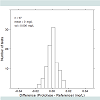 Figure 6 summarizes the cross-sensitivity test results in relation to the requirements of each industrial standard. Unfilled bars illustrate the allowed cross-sensitivity according to different industrial standards and filled bars show the calculated values based on the sensor’s optical filter characteristics. The calculations were confirmed by measurements of the most critical substances, and these results were published recently [17].
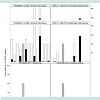 The calculated and measured cross-sensitivities of the prototype units fulfilled the requirements of all industrial standards with the exception of methanol, which exceeded the evidential standard requirements by approximately 40%.
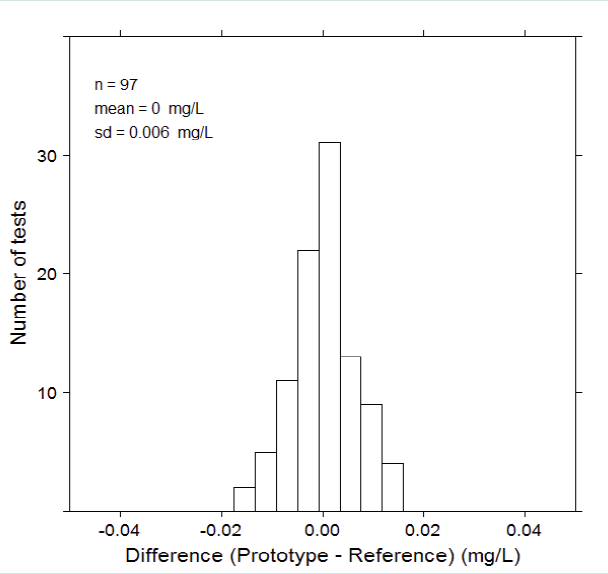
Figure 5: Results of function tests performed on four prototype units.
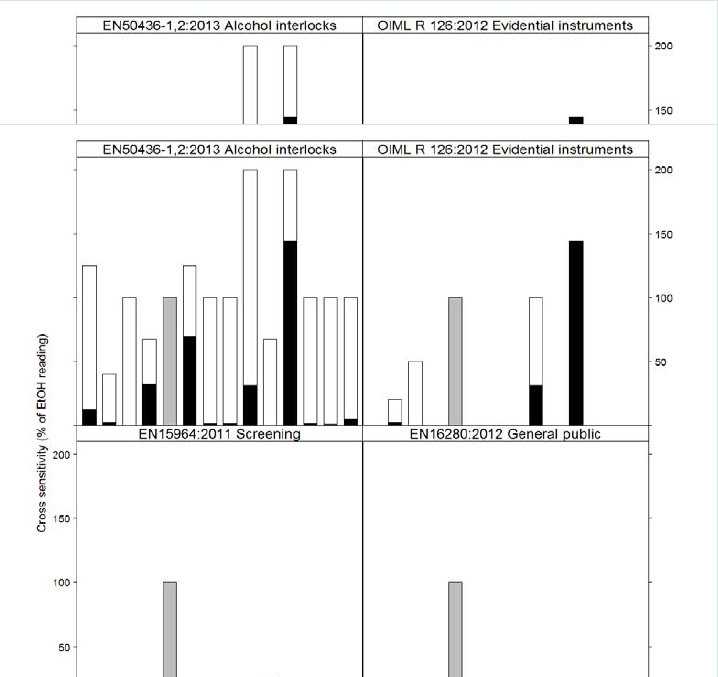
Figure 6: Cross-sensitivity of the prototype units.
Tests with Human Subjects
The variability of end-expiratory CO2 breath tests is illustrated in Figure 7. As expected, the long- and short-range breath tests exhibited large variations, whereas the variations for the undiluted breath tests were smaller. It is notable that the average of the undiluted values (4.1 ± 0.5 kPa) was significantly lower than the nominal alveolar value (4.8 kPa).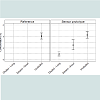 In Figure 8, the results of BrAC determinations for the entire human test population are summarized. In the upper panel, classifier performance is depicted with respect to the Swedish concentration limit of 0.1 mg/L EtOH. The shaded vertical area corresponds to the allowable error according to the function test of EN50436-1,2 centred around the concentration limit. When applying this error band, no FNs or FPs were observed for the short-range tests, whereas one was noted for the long-range tests.
 In the lower panel of Figure 8, classifier performance is depicted with respect to the central European concentration limit of 0.25 mg/L. The shaded vertical area corresponds to the allowable error according to the function test of EN50436-1,2. When applying this error band, three FNs and seven FPs were observed for both the short- and long-range tests; therefore, 1.7% of the determinations were falsely classified according to these criteria.
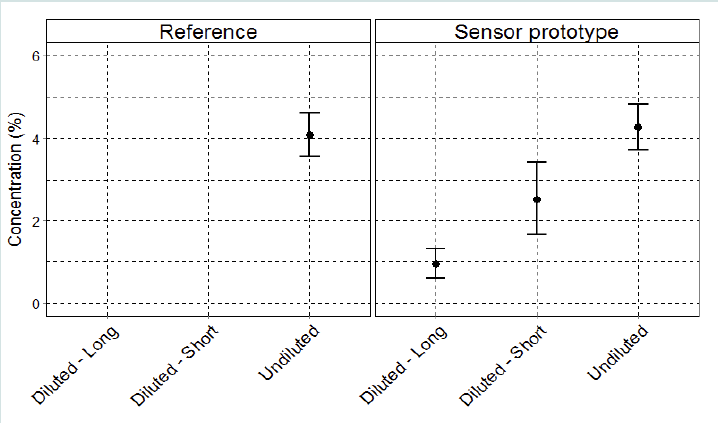
Figure 7: Variation in CO2 for the long- and short-range breath tests, as well as the undiluted tests using a mouthpiece. The error bars represent one standard deviation for tests in each category.
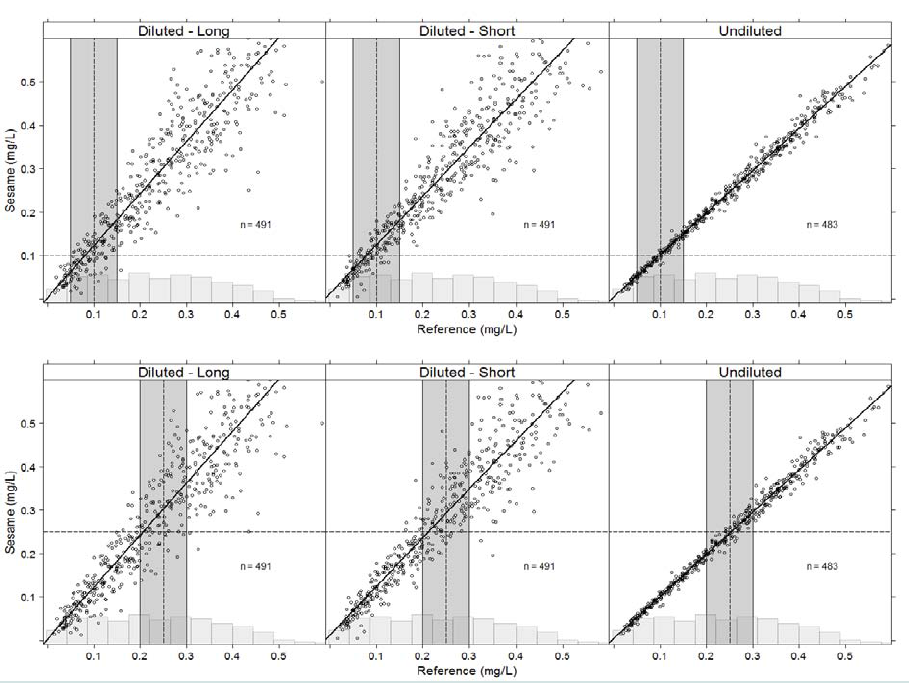
Figure 8: Results of human study of 30 test subjects. Upper: Classifier performance related to the Swedish concentration limit of 0.1 mg/LEtOH. Lower: Classifier performance related to the central European concentration limit of 0.25 mg/LEtOH. See text for more details.
Discussion
Our objective was to evaluate the method and performance of a novel prototype breath alcohol analyser. The test results using artificial breath samples indicate that the prototype’s performance complies with, or exceeds, the requirements with respect to resolution, calibration factor variation, function test variability, and cross-sensitivity, with methanol being the only deviation with respect to evidential requirements [6].The human study included 30 individuals and 1465 EtOH breath tests examined with respect to the prototype’s ability to correctly classify the breath tests in relation to the Swedish and central European concentration limits of 0.1 and 0.25 mg/L, respectively. One case of false determination was observed with respect to the Swedish limit, whereas 1.7% of the determinations using CO2 as a tracer gas were falsely classified using the central European limit. When the same prototypes were used in the undiluted mode of operation, no case of false determination was observed regardless of concentration limit.
The significant difference between the observed undiluted CO2 values (Figure 7), and the expected average arterial concentration [22] explains the increased slopes of the regression lines in the diluted modes of operation shown in Figure 8 . This observation is in accordance with previous results[24,25] and is related to gas exchange within the respiratory airways.
The prevalence of false determinations was obviously related to the choice of both operational mode and concentration limits. With a low concentration limit, both the short- and long-range modes with CO2 as a tracer gas produced only one false output out of 982 breath tests. At higher concentration limits, the measurement error associated with CO2 variability became more pronounced. In borderline cases, an unobtrusive test may be followed by an undiluted test, which will reduce the risk of false determination to almost zero.
Figure 8 indicates that in both the short- and long-range operational modes, the statistical signal behaviour is heteroscedastic, which was verified by performing the test suggested by Breutsch and Pagan[26]. This behaviour is predictable from Equation (1) and the dominating variability of CO2alv. It is actually a desirable property reducing the dominant error to almost zero at a low EtOH concentration.
Using the technique described in this paper, screening of breath alcohol can be performed at some distance from the mouth of the test subject. It implies a simplified operation for the user or operator compared to present techniques using a mouthpiece. In screening situations where the subjects are normally sober, the vast majority of tests can be performed unobtrusively. When the measurement result is close to the legal limit, and definitely when it is intended as legal evidence, higher accuracy is required. Only then it is necessary to provide an undiluted breath sample, e.g. by using a mouthpiece. The results of the present investigation show that the same type of breath analyser can be used in both the screening and high accuracy modes of operation.
The use of water vapour as tracer gas was patented by Albarda [27] and has been used by Lindberg et al. [28] and Grubb et al. [18] . It has the benefit of enabling high accuracy because of the fact that the inter-individual variations are smaller by a factor of 3-4 compared with CO2 [14]. However, the background concentration may be significant in most applications and may even exceed the alveolar concentration depending on the local circumstances. Therefore, unobtrusive measurement with high sample dilution is not feasible using H2O as tracer gas.
It should be noted that physiological error sources are also present in conventional breath tests using a mouthpiece. Depending on the test subject’s lung capacity, a breath test could either represent a deep or a shallow breath, which could give rise to an error exceeding 10% [2,3].
The results reported here demonstrate that the methodological issue raised by Grubb et al.[18] has been effectively resolved. Taking full advantage of the improvements in technology and methodology, there is no longer a contradiction between unobtrusiveness and high accuracy.
Acknowledgements
Financial contributions from Vinnova, The Swedish Innovation Agency, The US National Highway Traffic Safety Administration, NHTSA, and the Swedish Knowledge Foundation are gratefully acknowledged. The authors also wish to express their thanks to Håkan Pettersson, Autoliv, for his excellent leadership, and to all members of the project team. Special thanks to Claes Tingvall, the Swedish Transport Administration, for pointing out the significance of heteroscedasticity in this context.References
- Barnes JK (2013) Driving Under the Influence (DUI): An example of a close collaboration between legal case processing and treatment processes to effect holistic rehabilitation. International Conference on Alcohol, Drugs and Traffic Safety ICADTS, Brisbane, Australia
- Jones AW (1990) Physiological aspects of breath alcohol measurement.Alcohol Drugs Driving 6: 1-25.
- Hlastala MP (1998) The alcohol breath test – a review. J Appl Physiol 84: 401-408.
- Jones AW (2010) The relationship between blood alcohol concentration (BAC) and breath alcohol concentration (BrAC): A review of the evidence. (Road Safety Web Publication No. 15), Department of Transport, London.
- /Harding P, Zettl R (2008) Methods for breath analysis (Chapter 7). Garriott JC (Ed.) Garriott’sMedicolegal Aspects of Alcohol. (5th edn), Lawyers & JudgesPublishing Company, Tucson, AZ, 229-253.
- International Organization of Legal Metrology (2012) InternationalRecommendation: Evidential Breath Analyzers. OIML R 126.
- European Standard: Alcohol Interlocks – Test Methods and Performance Requirements – Part 1: Instrument for Drink-Driving-Offender Programs – Part 2: Instruments Having a Mouthpiece and Measuring Breath Alcohol for General Preventive Use, EN50436-1, 2.
- European Standard (2011) Breath alcohol Test Devices Other Than Single Use Devices – Requirements and Test Methods. EN15964: Austrian Standards Institute, Austria.
- European Standard (2012) Breath Alcohol Test Devices for General Public – Requirements and Test Methods. EN16280, Austrian Standards Institute, Austria.
- B Zaouk (2011) Driver Alcohol Detection System for Safety. Transportation Research Board 90th Annual Meeting, Washington DC.
- S Ferguson, A Zaouk, N Dalal, C Strohl, E Traube, et al. (2012) Driver Alcohol Detection System for Safety (DADSS)–Phase I Prototype Testing and Findings. Proceedings of the 22nd International Conference on the Enhanced Safety of Vehicles, 11-0230.
- B Hök, H Pettersson, G Andersson (2006) Contactless measurement of breath alcohol. Proceedings of the Micro Structure Workshop, MSW Västerås, Sweden.
- B Hök, H Pettersson, Annika Kaisdotter Andersson, S Haasl, et al. (2010) Breath Analyzer for Alcolocks and Screening Devices. IEEE Sensors J 10: 10-15.
- A Kaisdotter Andersson (2010) Improved Breath Alcohol Analysis with Use of Carbon Dioxide as the Tracer Gas. Mälardalen University, Västerås- Eskilstuna, Sweden.
- A Kaisdotter Andersson, B Hök, D Rentsch, G Rücker, M Ekström (2010) Improved Breath Alcohol Analysis in Patients with Depressed Consciousness. Med Biol Eng Comput 48: 1099-1105.
- A Kaisdotter Andersson, B Hök, A Karlsson, H Pettersson (2013) Unobtrusive Breath Alcohol Testing. 20th International Conference on Alcohol, Drugs and Traffic Safety. Brisbane, Australia.
- J Ljungblad, B Hök, M Ekström (2014) Critical Performance of a New Breath Analyzer for Screening Applications, Intelligent Sensors, Sensor Networks and Information Processing (ISSNIP). IEEE Ninth International Conference, Singapore.
- D Grubb, A Frigyesi, D Dencker, M Finnhult, S G Olsson, et al. (2014) Breath Alcohol Analysis by Standardization to Water Vapour Enables Contact Free Sampling with Preserved High Accuracy As Compared With Mouthpiece Sampling. J Forensic Investigation 2: 1-6.
- JU White (1942) Long Optical Paths With Large Aperture. J Opt Soc Amer 32: 285-289.
- D Allan (1966) Statistics of Atomic Frequency Standards. Proc IEEE 54: 221-230.
- Pacific Northwest National Laboratory, PNNL, Database of Infrared Absorption Spectra.
- AB Lumb (2005) Nunn’s Applied Respiratory Physiology. (6thedn), Elsevier, USA.
- Huang SM Hays, RV Gobbell, NR Ganick (1995) Indoor Air Quality, Solutions and Strategies. McGraw-Hill, New York.
- A Jonsson, B Hök, L Andersson, G Hedenstierna (2009) MethodologyInvestigation of Expirograms for Enabling Contact Free Breath Analysis. J Breath Research 3: 036002.
- KR Ward, DM Yealy (1998) End-tidal Carbon Dioxide Monitoring in Emergency Medicine, Part 1: Basic Principles. Acad Emerg Med 5: 628-636.
- Bermejo TS Breutsch, AR Pagan (1979) A Simple Test for Heteroscedasticity and Random Coefficient Variation. Econometrica 47: 1287-1294.
- S Albarda (1979) Method and Apparatus for Determining Alcohol Concentration in the Blood. US Patent No. 4,314,564. Assignee: Drägerwerk AG, Germany.
- L Lindberg, S Brauer, P Wollmer, L Goldberg, AW Jones, et al. (2007)Breath Alcohol Concentration Determined With a New Analyzer Using Free Exhalation Predicts Almost Precisely the Arterial Blood Concentration. Forensic Sci Int 168 168: 200-207.