
Research Article
*Address for Correspondence: Mina Lee, Graduate School of Global Environmental Studies, Kyoto University, Kyoto 606-8501, Japan, E-mail: lee.mina.24a@st.kyoto-u.ac.jp
Citation: Lee M. The Price of Korean Photovoltaic Technology and the Impact of R&D. J Environ Stud. 2016;2(2): 10.
Copyright © 2016 Lee et al. This is an open access article distributed under the Creative Commons Attribution License, which permits unrestricted use, distribution, and reproduction in any medium, provided the original work is properly cited.
Journal of Environmental Studies | Volume: 2, Issue: 2
Submission: 01 September, 2016 | Accepted: 29 September, 2016 | Published: 07 October, 2016
 The key political instruments regarding renewable energy in Korea are the Renewable Portfolio Standard (RPS) and R&D subsidies. The RPS, which replaced a Feed-in Tariff (FIT), was introduced in 2012 to enlarge the domestic market of renewable energy. The instrument mandates that electricity utilities that generate more than 500 MW must increase renewable energy production from 2% in 2012 to 10% in 2024. As of 2014, a cumulative capacity of 3.2 GW was newly installed, 1.2 GW of which are from PV energy [1].
 However, PV is struggling to diffuse and reduce costs despite a series of various efforts in the RPS and R&D support. For example, only 64.7% and 67.2% of the renewable energy certificates (RECs) were implemented in 2012 and 2013, respectively, indicating how the RPS as a diffusion policy failed to fulfill the entire original target. R&D investment is also problematic if the PV generation price will decrease enough to be competitive with one of the traditional sources of energy, such as fossil fuel or nuclear power. In Korea, the average PV R&D share as a percentage of total investment has been around 6.1% over the past seven years. Thus, political incentives have been recommended for Korea to obtain a more advanced and competitive level of PV technology to broaden its share in the national and overseas markets. The efficiency of PV R&D investment should improve in accordance with an in-depth evaluation to determine the obstacles for PV growth and suggest reform measures [2-5]. It is important to evaluate the introduction of future renewable energy technology with R&D efforts because the performance of the technology could otherwise be underestimated, especially regarding the energy system model [6]. Therefore, it is essential for Korea to have substantial reductions in PV price that correspond to the political efforts.


 There has been limited research estimating PV prices in Korea. Park et al. used data from 1995 to 2010 and draw a time of grid parity in PV under various scenarios until 2030 [32]. According to a learning curve determined in a case of a 2 year time lag and a 10% depreciation rate for R&D, the PV generation price is expected to decrease to 157 KRW/kWh in 2018, which is lower than the generation price of oil and liquefied natural gas (LNG). Hong et al. estimated PV generation cost with data from 2004 to 2011, and the cost decreased by 2.33% when the cumulative power generation doubled and by 5.13% every time R&D investment was doubled with 3 years of time lag and a 20% depreciation rate for R&D [33].
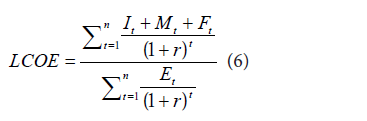
 The Levelised Cost of Electricity Generation (LCOE) is based on a discounted cash flow (DCF) where the present value of the total investment cost is divided by the average real generation cost per generating unit. The LCOE varies by technology and its technological level is measured as efficiency and performance, place and project, and investment in the technology. The formula to measure the PV LCOE is described as Equation (6), as follows:
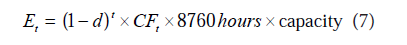
 Second, the future Korean PV LCOE is estimated. With the Korean PV module price predicted in the previous step, the future BOS is also observed for the LCOE analysis. The estimated future BOS cost is discussed by Jeong where the future BOS cost by 2031 is determined using a 16.7% LDR from 2001 to 2011 [39]. The data on the Korean PV annual production by 2029 was collected from the 7th Basic Plan for Long-term Electricity Supply and Demand (2015- 2029), and the remaining annual production by 2040 was assumed to increase 7% from the previous year, which is the average increasing rate during the 5 years between 2025-2029. Finally, the annual PV system price (It) is determined by combining the PV module and BOS prices. The annual operations and maintenance expenditure (Mt) is estimated as 1% of the It and the fuel expenditures (Ft) is considered to be “0” since the PV generation system converts sunlight directly into electricity. The discounted rate (r) is 5.5%, which is the social discounted rate used by the Korea Development Institute (KDI) that is applied to long-term projects or projects with long-term effects, such as a public investment. The economic life of a PV system is assumed to be 20 years [40]. The annual PV generation (Et) is estimated with Equation (7), as per Jeong, with 0.7% of the degradation rate (d) and 15.5% of the capacity factor (CF) [39], as follows:
 Future PV LCOE in Korea
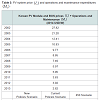 Finally, the 2040 PV LCOE in Korea is measured under the IEA’s three scenarios, and the predictive values are as shown in Table 4. The figures from 2002 and 2013 are actual PV generation prices [37], and the LCOE in 2020, 2030, and 2040 are forecasted according to the scenarios. The PV LCOE is predicted to continuously decrease to USD 0.011/kWh in 2040 under the most positive 450 Scenario.
 Sensitivity analysis
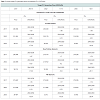
 The PV LCOE is also re-estimated with the PV module prices changed according to the sensitivity analysis. The results of the changed PV LCOE are shown in the Table 5. The PV LCOE is expected to drop to USD 0.010/kWh by 2040 under the 450 Scenario with the R&D expenditures having increased 5% annually, or at least USD 0.014/kWh under the Current Policies Scenario with the R&D expenditures having decreased 5% annually.
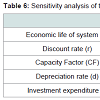
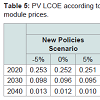 Doshi et al. and Jeong apply ± 30% to the baseline values of the capacity factor (CF), discount rate(r), economic lifetime of system(n), depreciation rate(d), and other variables to conduct sensitivity analysis [39,41]. This study also conducts sensitivity analysis by applying ± 30% to the baseline values of the parameter variables. The results that describe changes in the PV LCOE are shown in Table 6. The CF and I impact the Korean PV LCOE significantly as the LCOE decreases by 23.33% and 30% as the CF improves by 30% and the I decreases by 30%, respectively. Therefore, the LCOE decreases by USD 0.00678/kWh when the I declines 30% from the expected price, and USD 0.007497/kWh when the CF improves 30% from the assumed performance of 15.5%.
This research uses international PV production and R&D investment to estimate the LDR and LSR of Korean PV. The PV modules produced in each country are being sold in the domestic and international markets, indicating that the price of Korean PV modules is determined based on the demand and supply in the international open market. Therefore, while PV modules from other countries, such as China, are less expensive, Korea should strengthen its domestic PV technology to be able to sell its PV modules in the international market. In fact, the current market price of c-Si PV does not differ much between countries since the PV knowledge accumulated by past R&D activities in advanced countries, such as Europe or Japan, is rapidly diffused globally through the products, and China is leading the market by having a second mover advantage.
The Price of Korean Photovoltaic Technology and the Impact of R&D
Mina Lee*
- Graduate School of Global Environmental Studies, Kyoto University, Kyoto 606-8501, Japan
*Address for Correspondence: Mina Lee, Graduate School of Global Environmental Studies, Kyoto University, Kyoto 606-8501, Japan, E-mail: lee.mina.24a@st.kyoto-u.ac.jp
Citation: Lee M. The Price of Korean Photovoltaic Technology and the Impact of R&D. J Environ Stud. 2016;2(2): 10.
Copyright © 2016 Lee et al. This is an open access article distributed under the Creative Commons Attribution License, which permits unrestricted use, distribution, and reproduction in any medium, provided the original work is properly cited.
Journal of Environmental Studies | Volume: 2, Issue: 2
Submission: 01 September, 2016 | Accepted: 29 September, 2016 | Published: 07 October, 2016
Abstract
Solar Photovoltaic (PV) technology which is playing a major role in providing clean electricity in Korea has been particularly diffused by financial and political support since 2008. However, although the energy technology has made unprecedented progress over the last several years, it is expected to be continually diffused until 2035 when it will constitute 14.1% of renewable energy in the total primary energy supply (TPES) and have its generating price decreased by KRW 60.9/ kWh. This study uses 2-Factor Learning Curves (2FLC) to estimate future Korean PV module price considering both cumulative production and R&D investment. Subsequently, the Levelised Cost of Electricity (LCOE) that considers the module price anticipated before hand is applied to forecast the Korean PV generating price to estimate if the nation will reach its planned goal by 2035. As a result, the PV module price would decrease by USD 0.282/W in 2040 with 12.22% of Learning-by- Doing rate (LDR) and 10.44% of Learning-by-Searching rate (LSR) with 5 years of time-lag and 15% of depreciation rate in Knowledge stock (KS) estimated by R&D investment. The future PV generating price in 2035 is expected to be KRW 32.043-36.484/kWh, which is, the PV price that would reach its national target price by 2035 if current or similar levels of diffusion and R&D are offered in the time period.Keywords
Korea; Photovoltaic; Technological diffusion; R&D; 2 Factor Learning Curves (2FLC); Levelised Cost of Electricity Generation (LCOE)Introduction
Korea is an energy-intensive country that must consider strong and radical action to diversify its energy sources and adhere to the international trend toward renewable energy use. In 2014, the nation’s total primary energy supply (TPES) was 282.9 million tonnes of oil equivalent (toe). The Second National Energy Basic Plan (2014-2035) includes a target for the supply of new and renewable energy (hereinafter referred to as “renewable energy”)1 to be 11% of the TPES by 2035. The renewable energy production in 2014 was 10,956 thousand toe, which is 3.87% of the TPES, while waste energy was 6,904 thousand toe and bio energy was 2,821 thousand toe.(1According to the “Act on the promotion of the development, use, and diffusion of new and renewable energy” enforced in April 2010, the term “new energy and renewable energy means energy sources converted from exiting fossil fuel resources or renewable energy sources, including the sun, water geothermal heat, precipitation, and bio-organisms; solar energy, bio energy converted from biological resources, which falls within the criteria and range prescribed by Presidential decree, wind power, water power, fuel cells, energy from liquefied or gasified coal, and from gasified heavy residual oil, which falls within the criteria and scope prescribed by Presidential Decree, ocean energy, waste energy, which falls within the criteria and scope prescribed by Presidential Decree, geothermal energy, hydrogenous energy and Sources of energy prescribed by Presidential Decree, other than petroleum, coal, nuclear power, or natural gas.)
The nation’s total electricity generation in 2014 was 521.9 terawatt hours (TWh) and the electricity sourced from renewable energy (excluding hydro power) was 14.7 TWh, which is 2.8% of the TPES. Excluding hydro power, which that is often regarded as a nonrenewable energy source because of its high technological maturity, solar photovoltaic (PV) energy plays a major role in providing clean electricity, producing 2,556 gigawatt hours (GWh), which is the largest share of electricity production by a renewable energy source. Wind power and fuel cells produced 1,145 GWh and 943 GWh of electricity, respectively, in 2014.
The share of renewable energy is planned to be 11.0% of the TPES by 2035 with an annual 6.2% average growth rate in accordance with the Second National Energy Basic Plan (2014-2035) and the Fourth Basic Plan for New and Renewable Energy. The main directions for the renewable energy diffusion plan are to decrease the share of waste energy that accounts for two-thirds of the current renewable energy and to foster PV and wind energy as core sources of energy. PV energy is planned to be 12.9% in 2025 and 14.1% in 2035 of the renewable energy of the TPES with an 11.7% annual average growth rate. Thus, 13.4% of the renewable energy of the total electricity generation will be supplied by PV to reach this target.
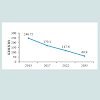
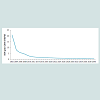
According to the Fourth Basic Plan for New and Renewable Energy, the price of PV that will function as a significant renewable energy source in Korea is intended to decrease to KRW (Korean Rates Won) 60.9/kWh by 2035, as depicted in the Figure 1. The plan states that research and development (R&D) is continually required to decrease the price of PV, improve its competitiveness with other electricity sourced by traditional fossil fuels and nuclear power, and diffuse PV energy widely for national energy security and environmental impact.
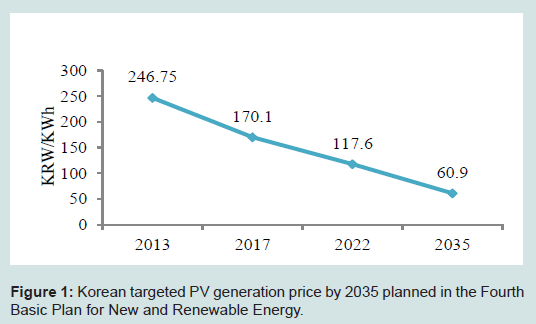
Figure 1: Korean targeted PV generation price by 2035 planned in the Fourth Basic Plan for New and Renewable Energy.
Approximately 3.71 trillion KRW of Korea’s R&D budget, comprised of 1.94 trillion KRW from the government (52.3%) and 1.77 trillion KRW (47.7%) from the private sector, has been dedicated to encouraging and improving renewable energy technology [1]. The R&D budget for renewable energy sharply increased in 2008, and 74.5% of the total renewable energy R&D budget from 1988 to 2013 was allocated to four priority renewable energy sources: PV (26.6%), wind (15.9%), hydrogen and fuel cell (24.8%), and integrated gasification combined cycle (IGCC) (7.2%).
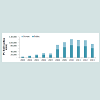
PV energy has been continuously and intensively promoted by R&D policy, as shown in Figure 2, with 641.5 billion KRW in investment, comprised of 429.4 billion KRW from the government with 9% annual average growth and the remaining from the private sector [1], to improve conversion efficiency to decrease the cost of the system and electricity generation and to make PV energy competitive against traditional energy resources, specifically fossil fuel and nuclear power. In addition, the policy also seeks to catch up with the existing advanced PV technology and future innovative PV technologies, such as copper indium gallium selenide (CIGS) thin film solar cells, dye sensitized solar cells, and organic solar cells, to have a competitive advantage in the overseas market.
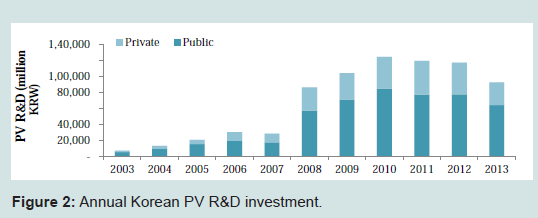
Figure 2: Annual Korean PV R&D investment.
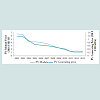
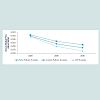
Considering that PV technology is expected to retain a major role in the Korean electricity market, this study aims to predict the future Korean PV generation prices under the current level of diffusion and R&D policies to discern if the technology can compete with the generation prices of traditional sources of power in the national electricity market. Therefore, the future price of a domestic PV module, which occupies the largest part of the generation price, is naturally estimated. Figure 3 describes the PV module and generation prices from 2002 to 2013 in Korea. A PV module in 2002 costs USD (US Dollar rates) 6.61/W, and declined to 0.89/W in 2013 [7]. The PV generation price is estimated to have been USD 1.189/kWh in 2002, and decreased to USD 0.262/kWh in 2013, and, as mentioned earlier, is expected to decrease to KRW 60.9/kWh (approximately USD 0.06/kWh if KRW 1000 is converted as USD 0.91) by 2035.
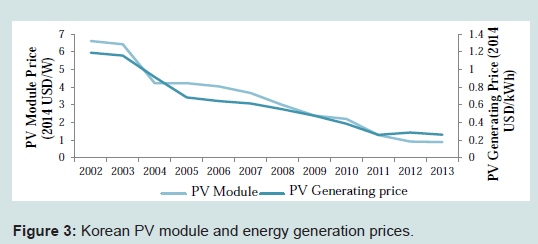
Figure 3: Korean PV module and energy generation prices.
Literature Review
The exogenous growth model from the perspective of macroeconomics was advanced by Ramsey and Solow, and considers long-term and stable economic growth as being determined exogenously, for example, technical shock or technical change as a result of innovation without compensation [8,9]. However, in the recent endogenous growth model suggested by Romer and Lucas, economic growth is based on accumulated knowledge and human capital, such that producing new knowledge that will be constantly developed is significant for economic growth [10,11]. Therefore, R&D investment that brings about technical progress and technical innovation will shift the current technology and industry structure and ultimately influence economic growth.Innovation is defined as “an idea, practice, or object that is perceived as new to an individual or another unit of adoption” by Everett Rogers, who explains that innovation is developed through the processes of decision, activities, and impacts generated from the recognition of a problem or need to the basic and applied research, development, commercialization, adoption and diffusion, and consequences. Here, the processes of basic and applied research and development are customarily referred to as R&D. That is, an invention is discovered or created from a new idea through basic and applied research and turns into an innovation after going through a development process where technological transfer occurs as the result of the research. The learning effect that reduces the unit cost of a product is a function of the experience gained from the product’s cumulative output, research, use, and/or interaction in later stages of commercialization, adoption, and diffusion.
Wright first depicted the learning effect and showed that the total number of working hours decreases as the production level increases in airplane manufacturing [12]. Arrow and Alchian developed the theory and several different mechanisms of learning were distinguished, such as learning-by-doing (LBD) [13,14], learningby-searching (LBS), learning-by-using (LBU), and learning-byinteracting (LBI) [15]. An approach called the one-factor learning curve (1FLC) is often applied to quantify the learning effect from LBD, and the approach has been extended to include LBS, which is called the two factor learning curve (2FLC) [16]. Recently, active R&D has become a significant factor to lead technical change endogenously and should also be considered when learning effects are estimated.While the significance of energy diversification, along with fossil fuel depletion and environmental conservation from global warming and climate change, are being stressed, renewable energy has garnered attention as being able to cope with these difficulties. International investment in technology development for renewable energy has increased dramatically during the last two decades, and some renewable energies, such as hydraulic, bio, waste, PV, and wind, have been commercialized and are performing a major role in supplying energy to some countries. For example, two-thirds of Sweden’s electricity is provided by renewable sources, and the country announced an ambitious plan to be the first fossil fuel-free country in a speech to the UN General Assembly [17]. However, uncompetitive generation costs for some renewables, such as PV and wind energy, is problematic to disseminating the energy, and several academic attempts have been made to analyze the prospects for reducing the cost of renewables by estimating the learning curves by the 1FLC [15,18-25].
R&D should not be disregarded since knowledge stock (KS) is significant for endogenous technical change and stable economic growth. The 2FLC incorporates the KS that is normally measured by past R&D investment in addition to the cumulative installed capacity or production of a certain technology, as is used in the 1FLC, and is more accurate to examine future energy price.
Two Factor Learning Curve (2FLC)
The 2FLC was first introduced by Kouvaritakis et al. [34]. The model explains the relationships between cost reduction and cumulative capacity (CC), as well as the knowledge stock (KS) led by R&D activity. Therefore, from the two factors CC and KS, two learning-curves are specified: one is the conventional “learning-by-doing” that explains the cost reduction as related to the CC, and the other is “learning-by-searching” that explains the KS as created by R&D activity to decrease the cost. The 2FLC can be demonstrated by Equation (1), presented as follows:
Where
SC: Specific Cost in one of currencies; CC: Cumulative Capacity; KS: Knowledge Stock; te: Technology; T: Time; a: Specific cost at unit cumulative capacity and unit knowledge stock; -α; Learning-by-doing index; and -β; Learning-by-searching index.
Therefore, the learning-by-doing rate (LDR) and the learningby-searching rate (LSR) are derived from Equations (2) and (3) as follows: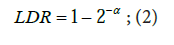
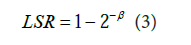
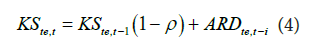
The specific technology cost decreases with the LDR for each doubling of CC and/or the LSR for each doubling of KS. The KS is estimated from the past R&D investment utilized for a given year forthe technology, and a depreciation rate and time-lag are taken into account. The KS is specified as Equation (4), as follows:
where
KS: Knowledge Stock; ρ: Knowledge stock depreciation; ARD: Annual R&D expenditure; te: Technology; t: Time; and i: Time lag between R&D expenditure and its effectThe learning parameter is estimated by using Ordinary Least Squares (OLS), and is specified with an error term (ε , as Equation (5) follows:
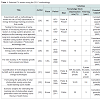
The models of selected studies using 2FLC for predicting PV cost is shown in Table 1. The studies using 2FLC are mostly panel studies to compare the future energy price among countries. The results described as LDR and LSR were discovered differently depending on the variables considered as measures of each study. The LDR and LSR in the international studies are, on average, 14% and 9%, respectively. A study in the United States estimated its LDR and LSR as approximately 13% and 10%, and a Japanese study found 15.7% and 13.2%, which represents higher rates than in the United States.
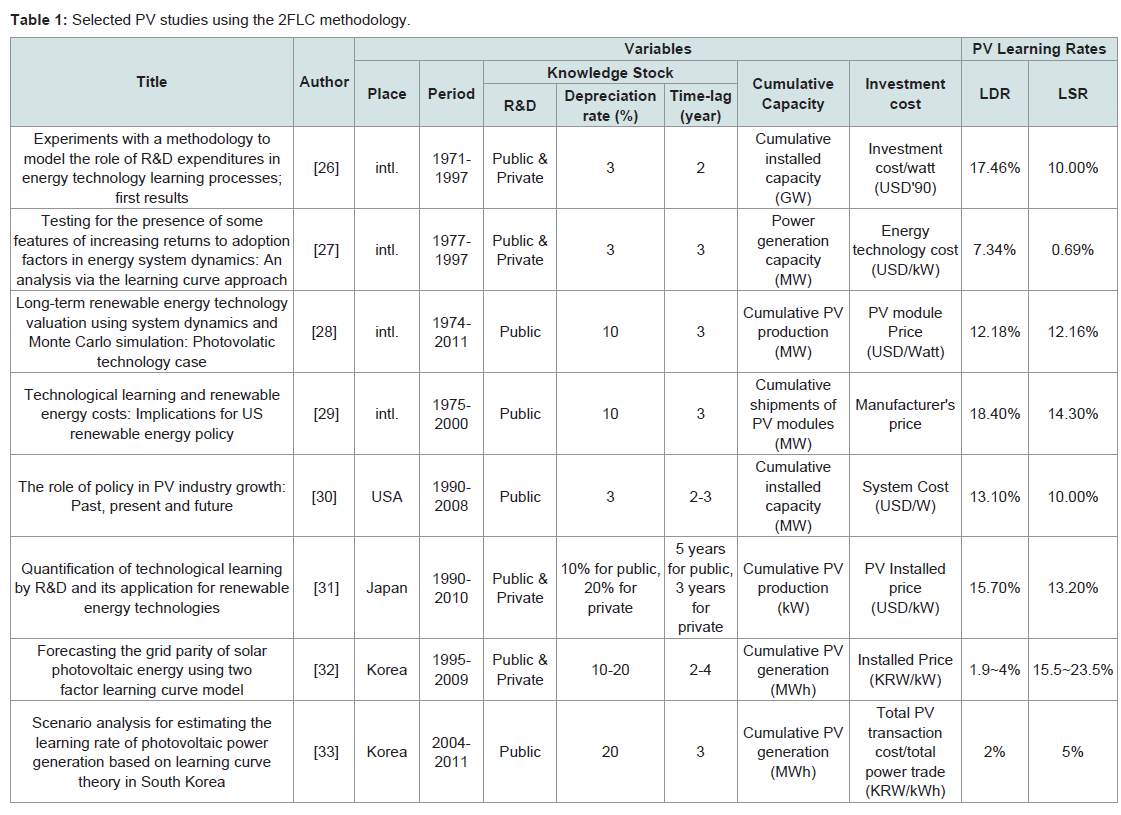
Table 1: Selected PV studies using the 2FLC methodology
Levelised Cost of Electricity Generation (LCOE)
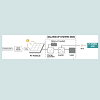
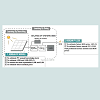
A PV cell is classified largely as non-organic or organic according to the cell material. Non-organic PV cells are divided further depending on whether they are produced by silicon. The wafer-based crystalline silicon (c-Si) PV, which accounted for approximately 90% of the PV market in 2013, is separated into monocrystalline silicon (sc-Si) PV, that has commercial efficiency between 16% and 24%, and multicrystalline silicon (mc-Si) PV, that has average conversion efficiency around 14 to 18% [35].The wafer-based c-Si PV, which dominates the current market with mature technology obtained by knowledge accumulated within the electronic industry, is manufactured according to the value chain depicted in Figure 4. Polysilicon is the raw material for c-Si that is produced and transformed into the ingot, wafer, and cell, and is the smallest unit to convert solar energy into direct current electricity. The cell is then assembled as a PV module to obtain a large volume of electricity, and the produced electricity is transferred to the grid being supported by a balance of system (BOS).
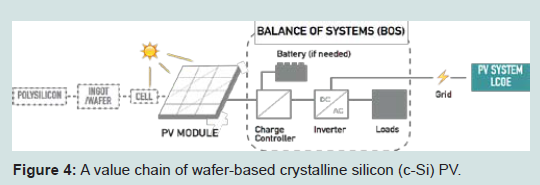
Figure 4: A value chain of wafer-based crystalline silicon (c-Si) PV
where;
LCOE = Average lifetime levelised cost of electricity generation;
It = PV system price in the year t;
Mt = Operations and maintenance expenditures in the year t;
Ft = Fuel expenditures in the year t;
Et = Electricity generation in the year t;
r = Discount rate; and
n = Economic life of the system.
The BOS, comprised of an inverter, charge controller, battery if needed and other parts required supporting the system, occupies the largest portion of the PV system cost together with the PV module. The cost of the BOS largely varies depending on the nature of the installation, from 20% for a large-scale grid connected system to 70% for a smaller off-grid system. On average, the BOS is 40% of the cost for a standard utility-scale ground-mounted system [36]. Therefore, the PV module and BOS prices must be considered for PV LCOE analysis. Fuel expenditures (F) and operations and maintenance expenditures (M) are relatively lower than conventional fossil fuel and nuclear power plants [36].
Analytical Framework
First, the predicted future price of a domestic PV module is measured by a 2FLC. The time period for obtaining LDR and LSR was between 1994 and 2013, where the nominal pricing values used for analysis have been converted into real values using the 2014 US GDP (Gross Domestic Product) as a divisor. The specific investment cost (SC) is presented as the price of Korean PV module in 2014 USD currency per Watt (W), and the data was obtained from the “International Energy Agency Photovoltaic Power Systems (IEAPVPS) National Survey Reports” reported from 2002 and 2013. As shown in Figure 5, the early Korean PV module price in 1994 was more than twice the international module, but the current price is adequately competitive in the international market. International R&D expenditures and PV module production are used for the 2FLC since new PV knowledge diffuses rapidly through the international market and the export-oriented Korean PV module industry is affected by international module production. International PV module production data from 1975 to 2013 was obtained from the Earth Policy Institute. The PV cumulative capacity in 2013 was 168 GW and has recently rapidly increased. The international R&D expenditure data from 1974 to 2013 was collected from International Energy Agency (IEA) statistics to measure the KS at the beginning of the PV R&D activity. The PV annual KS are calculated according to Equation (4) with varied depreciation rates of 5, 10, 15, 20% per year and 2 to 6 years of annual time-lags. Therefore, the indexes of LBD and LBS are calculated with Equation (5), and the LDR and the LSR are obtained from Equations (2) and (3). Finally, the future Korean PV module price can be predicted with the most explainable LDR and LSR.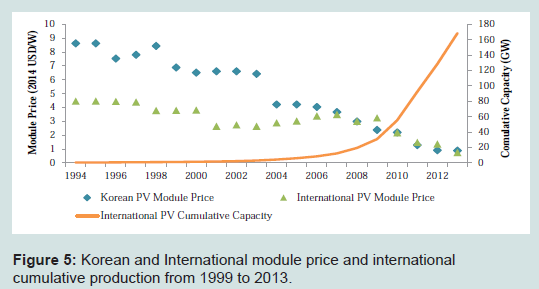
Figure 5: Korean and International module price and international cumulative production from 1999 to 2013.
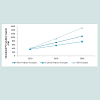
The future PV module price is anticipated with three future PV production scenarios, the Current Policies Scenario, the New Policies Scenario, and the 450 Scenario, which are forecasted throughout 2040 by the IEA [37]. The predicted PV cumulative capacity in the three scenarios is presented in Figure 6 [38]. The Current Policies Scenario and the New Policies Scenario considers the policies and measures implemented as of mid-2015 that influence energy markets, and the 450 Scenario also takes into account relevant declared policy intentions with specific instruments that may not have been introduced yet.
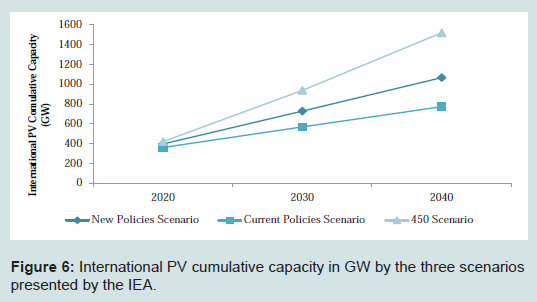
Figure 6: International PV cumulative capacity in GW by the three scenarios presented by the IEA.
The Figure 7 shows the analytical framework to predict future Korean PV module prices and LCOE.
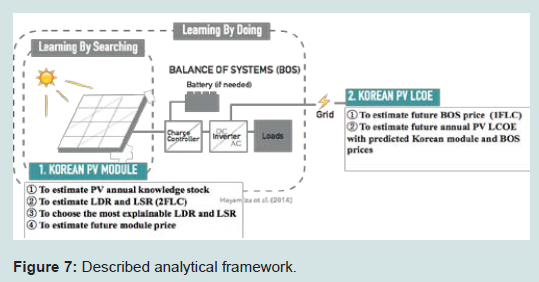
Figure 7: Described analytical framework.
Results
This study uses the 2FLC and LCOE to predict the future Korean PV module and generation prices. The objective of the study is to determine if the price of a PV electricity system will reach the targeted PV generation prices by the given planned period presented in the Fourth Basic Plan for New and Renewable Energy.Future PV module price in Korea
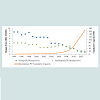
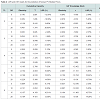
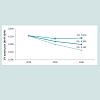
The KS was calculated in advance with scenarios of 2- to 6-year time lags and 5, 10, 15, 20% depreciation rates. The Durbin-Watson (DW) statistic and the variance inflation factor (VIF) tests were carried out to verify the serial correlation and multi-collinearity,respectively. The results, as estimated with OLS, are described in Table 2. Considering the adjusted R2 is larger than 0.900, the DW is close to 2.000, and the VIF is below 10, an option with the CC and KS with a 5-year time-lag and 15% of depreciation is the most significant in explaining the Korean PV module price. The indexes of LBD and LBS are specified as -0.188 and -0.159, respectively, as a result, and the LDR and LSR are estimated as 12.22% and 10.44% consequently through Equations (2) and (3). The future Korean PV module prices (2014 USD/W) predicted for 2040 according to the two learning rates and the three scenarios presented by the 2015 IEA World Energy Outlook are shown in Figure 8. The Korean PV module price is expected to decrease to USD 0.300/W in 2040 under the Current Policies Scenario, to USD 0.282/W under the New Policies Scenario, and to USD 0.264/W under the 450 Scenario.
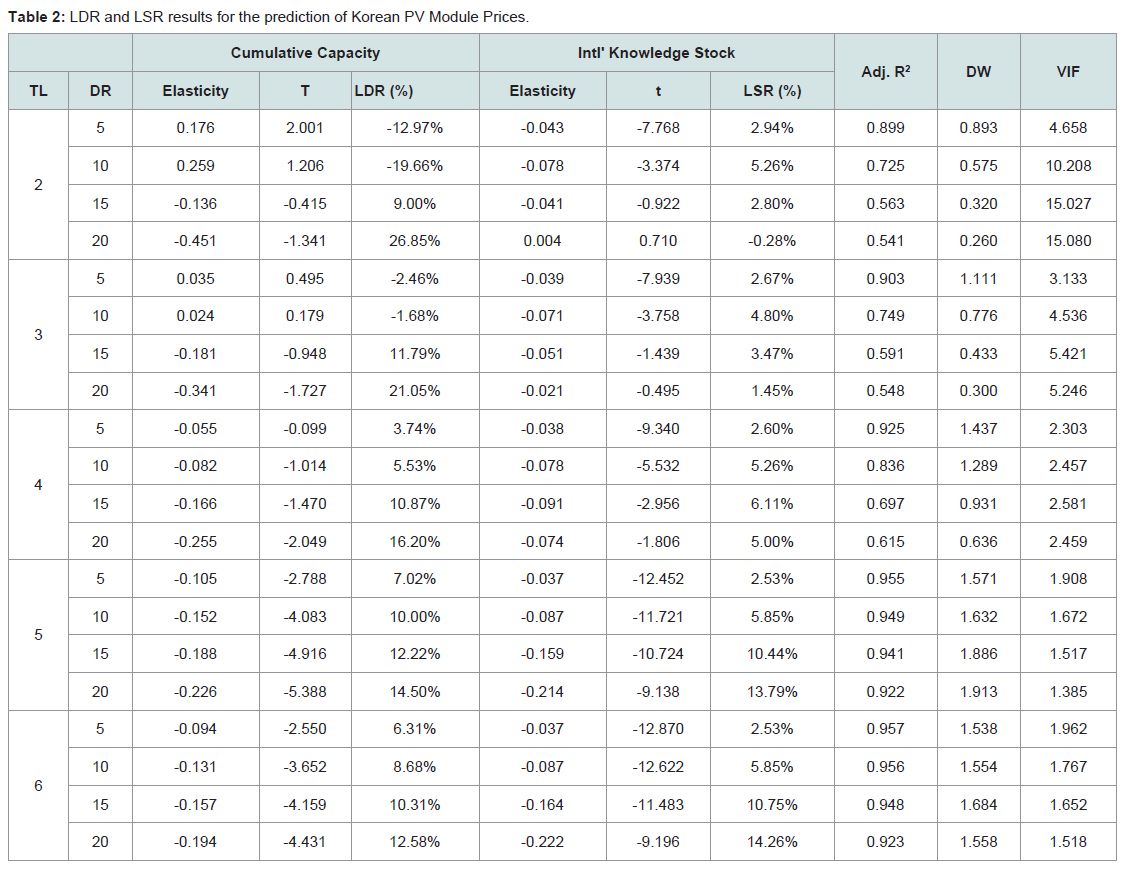
Table 2: LDR and LSR results for the prediction of Korean PV Module Prices.
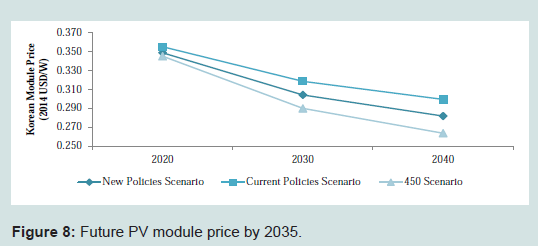
Figure 8: Future PV module price by 2035.
Estimating the annual It to measure the future Korean PV LCOE requires two major expenditures, the PV module and the BOS. The expected BOS price by 2040 is shown in Figure 9, and is predicted to decrease to USD 0.64/W by 2040. The PV system price, which is the combined Korean PV module and BOS prices and the Mt are presented in Table 3. Again, the annual Mt is assumed to be 1% of the annual I, and the Ft is not expected to occur for this study.
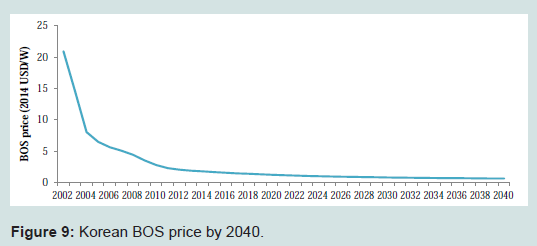
Figure 9: Korean BOS price by 2040.
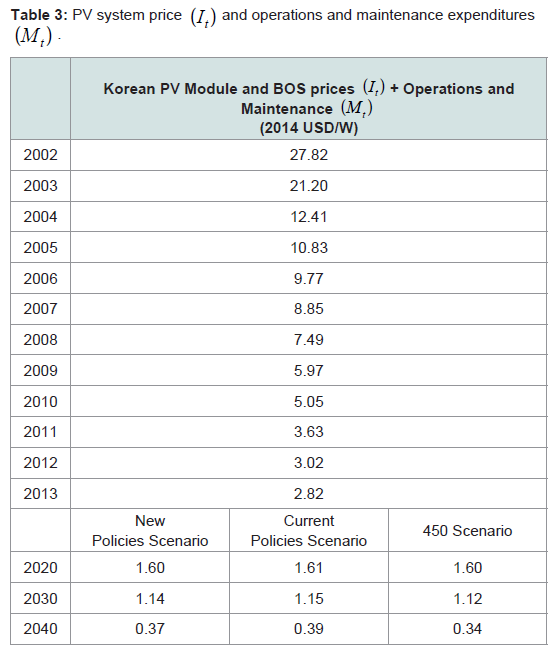
Table 3: PV system price (It) and operations and maintenance expenditures (Mt).
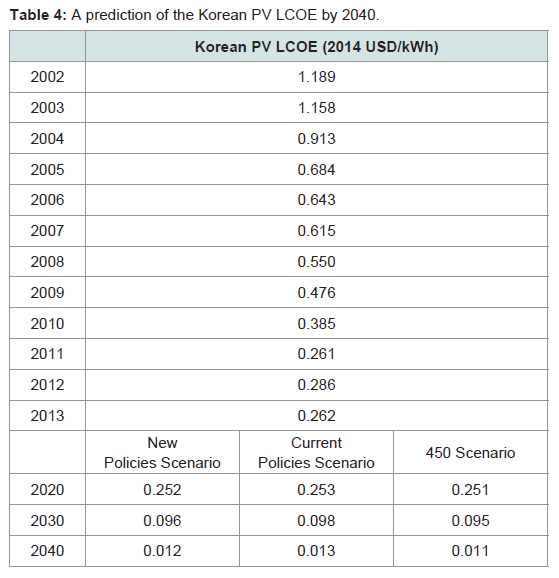
Table 4: A prediction of the Korean PV LCOE by 2040.
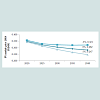
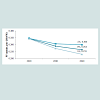
Sensitivity analysis is necessary when there are uncertainties in the variables used for analysis. The sensitivity analysis for the Korean PV module price was performed in advance. Based on Hayamizu et al. this study applies ±5% annually to the baseline value of international R&D expenditures to observe the R&D impact on capital costs of PV modules by 2040 and estimate PV module prices in each scenario [31]. The results are shown in Figures 10-12. The PV module price will likely decrease to USD 0.231/W by 2040 under the 450 Scenario with the R&D expenditure having increased 5% annually from 2014.
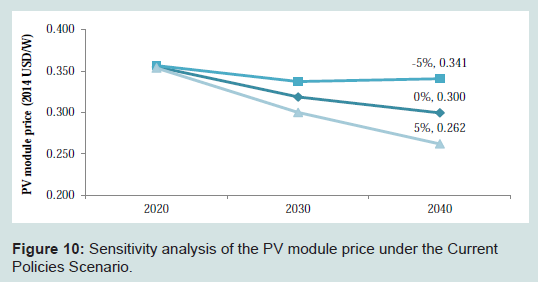
Figure 10: Sensitivity analysis of the PV module price under the Current Policies Scenario.
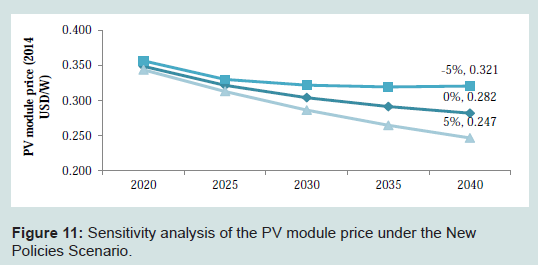
Figure 11: Sensitivity analysis of the PV module price under the New Policies Scenario.
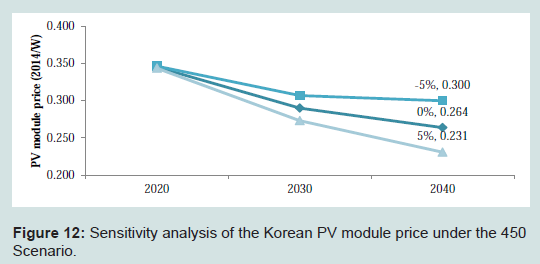
Figure 12: Sensitivity analysis of the Korean PV module price under the 450 Scenario.
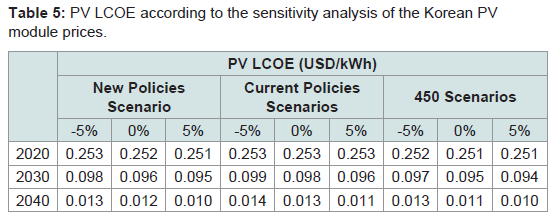
Table 5: PV LCOE according to the sensitivity analysis of the Korean PV module prices.
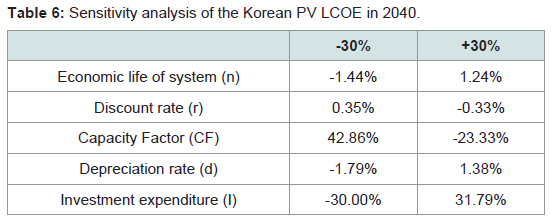
Table 6: Sensitivity analysis of the Korean PV LCOE in 2040.
Conclusions and Policy Implications
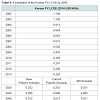
This study estimates the future Korean PV module and LCOE prices by 2035 to verify if the forecasted prices will reach the national targeted generation prices with the current level of production and R&D support. First, the Korean PV module price is projected with a 2FLC, taking into account international PV cumulative production and R&D expenditures. As a result, the PV module price has a tendency to decrease by 12.22% of the LDR and 10.44% of the LSR every time the cumulative PV production and KS are doubled. The time-lag and depreciation rate for the PV R&D are measured as 5-year and 15%, respectively, and have an adjusted R2 of 0.941, DW of 1.886, and a VIF of 1.517. These results indicate that 5 years are required between R&D investment and the realization of quantifiable benefits, since the price and KS of the technology depreciates rapidly at 15% annually, which is characteristic of an evolving technology such as PV.Forecasting the PV electricity price in Korea is based on the LCOE formula sequence. The PV generation price is estimated to decrease to USD 0.011 ~ 0.013/kWh by 2040. The PV target generation price, according to the Fourth Basic Plan for New and Renewable Energy released in 2014, is expected to reach KRW 245.75/kWh by 2017, KRW 117.6/kWh by 2022, and KRW 60.9/kWh by 2035. The annual PV LCOE prices are estimated with the constant average annual growth rate (CAAGR) to determine if the PV LCOE would decrease by its expected target price. The CAAGR tends to be higher with time as well, as do the New Policies Scenario and 450 Scenario. As shown in Table 7, the PV generation price is not expected to reach the 2022 goal, but will decline to KRW 60.9/kWh of the 2035 PV target price by 2032 and decrease to KRW 31.043 ~ 39.917/kWh by 2035. According to the sensitivity analysis performed due to the uncertainty in the variables used for the analysis, the price is expected to change with CF and I, which is required to enhance the efficiency of PV modules and reduce system costs. As for the time to reach the grid parity for PV, it is not anticipated to be lower than the Korean System Marginal Price (SMP) by 2022 according to a scenario provided by the Korea Power Exchange (KRX). The SMP in 2022 is expected to be KRW 127.1/kWh [37], and the PV generation price will reach the grid parity before 2025-26 if the SMP maintains this level.
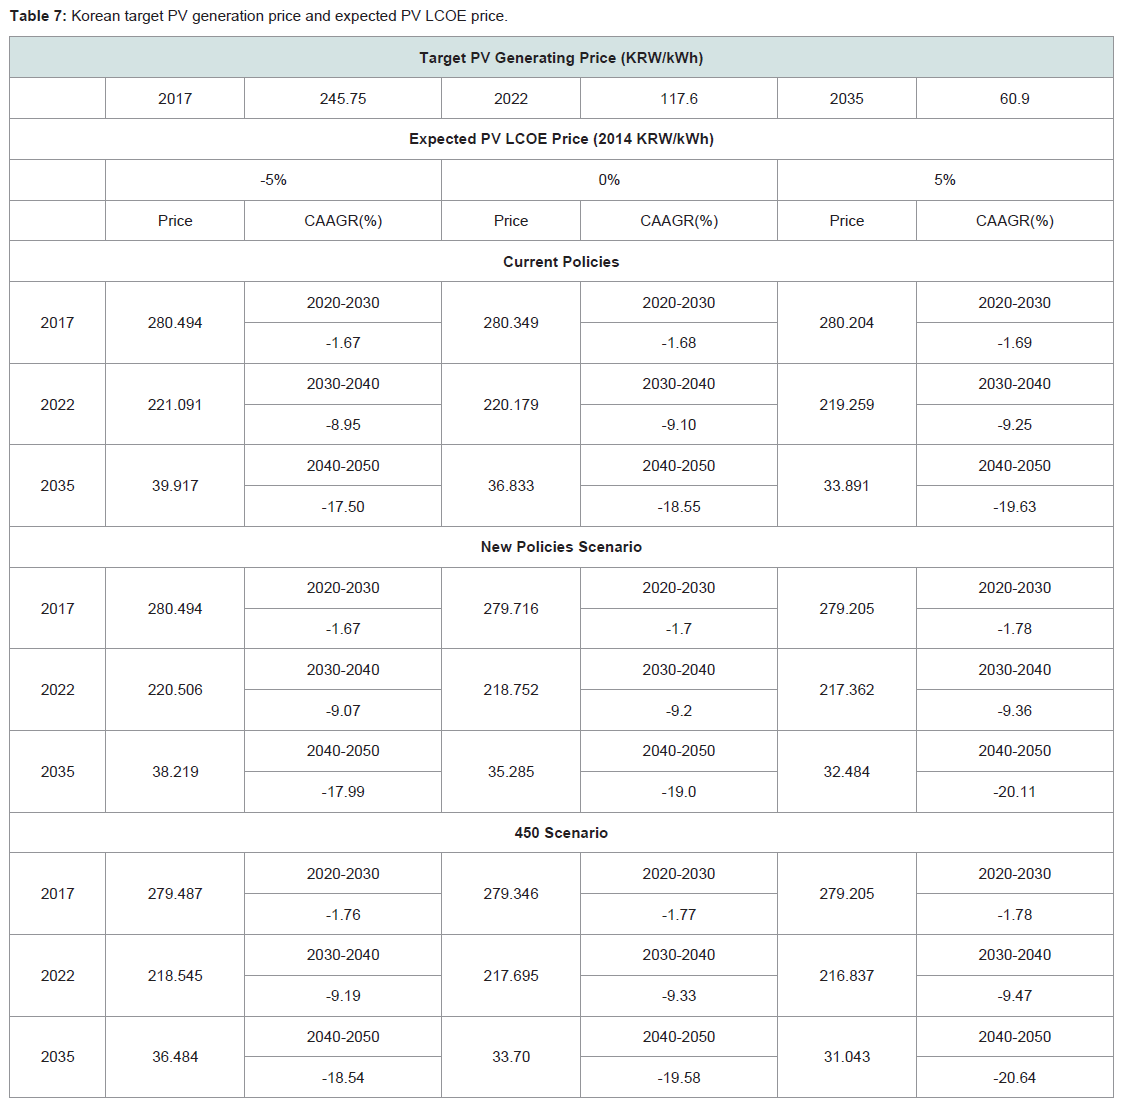
Table 7: Korean target PV generation price and expected PV LCOE price.
Knowledge creating activities, such as R&D, arise from three types of market failure: indivisibilities, uncertainty, and externalities. These market failures reduce the private sector’s incentive to invest in R&D. R&D projects involving significant fixed costs exhibit economies of scale with highly educated human resources or specified use (indivisibilities); it can be uncertain if a project will have market value (technological uncertainty); and, moral hazard generates difficulties in carrying out R&D activities (externalities). In addition, knowledge creating activities, as a public good, are both non-rival and non-excludable [42]. The knowledge can be in circulation to be consumed by many people, which weakens any attempt to produce new knowledge (non-rival); and, it is difficult for innovators to value the knowledge created and exclude its use by others (non-excludable), which also reduces the innovator’s R&D efforts. However, often those who heavily invest in R&D activities benefit since the knowledge is seldom worthless, and foreknowledge enables a private rate for individuals who invested in R&D that exceeds the social rate of return as the first runner in the market.
New PV technology should be developed with R&D to become a front-runner in the market. In fact, the current major source of PV income in Korea is from export revenue, mostly in the polysilicon industry in an upstream value chain that has a high entry barrier and is being operated by large companies with a large international market share. On the contrary, the downstream of the PV value chain that relies largely on export revenue due to the narrow domestic market suffers from its limited position in the international market. This is predicted to get more difficult in the long-term due to the lack of past performance and verification of product reliability through commercialization.
It is important for innovative PV to have opportunities to evolve to produce large quantities, improve cost competitiveness, and occupy a dominant position in the international market. The technological gap between the future generation of PV, such as PV based on thinfilm technology, and the technology level in advanced countries is seriously widening. Specifically, in 2011, Korea was 66% compared to advanced countries, and the localization rate was also low at 46%.
To enhance the R&D for new PV technology, which is expected to decrease PV module and PV generation prices, strong, short-term R&D investment in c-Si of low cost and high efficiency is required. This will distinguish the technology from advanced countries, enlarge the domestic market by strengthening diffusion policies, such as RPS, promote the use of domestic products, and accumulate track records so they can be sold in the international market. Further, strong R&D investment in future PV technology, such as a-Si and CIGS, will enhance its technological level to allow it to dominate the market share in the long-run. Such investments will fund in-depth and durable evaluations of R&D projects until the PV modules have economical value through commercialization.
Soft systemCampus management: Interviewees B commented that it is important to develop the managerial plans of the campus so as the concept of sustainability can be promoted. The effective and efficient management plans have great influence on a campus’s development (interviewees B, C and E).
Seventy interviewees: A (23%), B (100%), C, D, E, F, G (100%), H (100%), I (20%) and J (63.3%) stated that the sustainable campus needs a sound management system. An effective management system could improve the efficiency of the entire university system and may conserve resources which ease the achievement of the sustainability goal (interviewees G).
Other factors related to campus management include oversight mechanisms and censorship systems for the implementation of campus sustainability activities, e.g. finance (interviewee C).
Interviewee F asserted that many policies cannot be executed properly without oversight mechanisms on campus. Interviewees A discussed this issue from the student’s point of view, suggesting that the university could place more emphasis on students, in order to standardize student’s administration.
References
- MOTIE (2014) 2014 New and Renewable Energy White Paper. Ministry of Trade, Investment and Energy, Sejong.
- KEEI (2013) 2013 Yearbook of Energy Statistics. Korea Energy Economics Institute. Gyeonggi Province: Yang-Hoon Sonn.
- KEEI (2013) Forecast on Photovoltaic Industry and Module Price and Domestic and Foreign Strategy. Korea Energy Economics Institute, Ulsan.
- KISTEP (2011) Green Tech Research; Policy analysis and suggestions on Photovoltaic R&D, Seoul.
- KISTEP (2012) Current Situation and Role of Government R&D in Photovolatic Technology. Korean Institute of S&T Evaluation and Planning, Seoul.
- Watanabe C, Nagamatsu A, Griffy-Brown C (2003) Behavior of technology in reducing prices of innovative goods-an analysis of the governing factors of variance of PV module prices. Technovation 23: 423-436.
- IEA (2013) National Survey Report of PV Power Applications in Korea 2013. International Energy Agency.
- Ramsey FP (1928) A mathematical theory of saving. Econ J 38: 543-559.
- Solow RM (1956) A contribution to the theory of economic growth. Q J Econ 70: 65-94.
- Romer PM (1986) Increasing returns and long-run growth. J Polit Econ 94: 1002-1037.
- Lucas RE Jr (1988) On the mechanics of economic development. J Monet Econ 22: 3-42.
- Wright TP (1936) Factors affecting the cost of airplanes. J Aeronaut Sci 3: 122-128.
- Arrow KJ (1962) The economic implications of learning by doing. Rev Econ Stud 29: 155-173.
- Alchian A (1963) Reliability of progress curves in airframe production. Econometrica 31: 679-693.
- Junginger M, Faaij A, Turkenburg WC (2005) Global experience curves for wind farms. Energy Policy 33: 133-150.
- Argot L, Epple D (1990) Learning curves in maufacturing. Science 247: 920-924.
- Bolton D (2015) Sweden wants to become the first fossil fuel-free country in the world - how will it work?
- Neij L (1999) Cost dynamics of wind power. Energy 24: 375-389.
- Nemet GF (2006) Beyond the learning curve: factors influencing cost reduction in photovoltaics. Energy policy 34: 3218-3232.
- Albrecht J (2007) The future role of photovolatic: A learning curve versus portfolio perspective. Energy Policy 35: 2296-2304.
- Pan H, Köhler J (2007) Technological change in energy systems: Learning curves, logistic curves and input-output coefficients. Ecol Econ 63: 749-758.
- Söderholm P, Sundqvist T (2007) Empiricial challenges in the use of learning curves for assessing the economic prospects of renewable energy technologies. Renew Energy 32: 2559-2578.
- Kahouli-Brahmi S (2008) Technoligical learning in energy-environment-economy modelling: A survey. Energy Policy 36: 138-162.
- Ferioli F, Schoots K, van der Zwaan B (2009) Use and limitations of learning curves for energy technology policy: A component-learning hypothesis. Energy Policy 37: 2525-2535.
- Berglund C, Söderholm P (2006) Modeling technical change in energy system analysis: analyzing the introduction of learnig-by-doing in bottom-up energy models. Energy Policy 34: 1344-1356.
- Miketa A, Schrattenholzer L (2004) Experiments with a methodology to model the role of R&D expenditures in energy technology learning processes; first results. Energy Policy 32: 1679-1692.
- Kahouli-Brahmi S (2009) Testing for the presence of some features of increasing returns to adoption factors in energy system dynamics: An analysis via the learning curve approach. Ecol Econ 68: 1195-1212.
- Jeon C, Shin J (2014) Long-term renewable energy technology valuation using system dynamics and Monte Carlo simulation: Photovolatic technology case. Energy 66: 447-457.
- Kobos PH, Erickson JD, Drennen TE (2006) Technological learning and renewable energy costs: implications for US renewable energy policy. Energy Policy 34: 1645-1658.
- Byrne J, Kurdgelashvili L (2011) The role of policy in PV industry growth: past, present and future. In: Luque A, Hegedus S (Eds). Handbook of photovoltaic science and engineering, (2ndedn). John Wiley & Sons, Ltd, UK.
- Hayamizu S, Furubayashi T, Nakata T (2014) Quantification of technological learning by R&D and its application for renewable energy technologies. Japan Soc Mech Eng 80.
- Park SJ, Lee DJ, Kim KT (2012) Forecasting the grid parity of solar photovoltaic energy using two factor learning curve model. IE Interfaces 25: 441-449.
- Hong S, Chung Y, Woo C (2015) Scenario analysis for estimating the learning rate of photovoltaic power generation based on learning curve theory in South Korea. Energy 79: 80-89.
- Kouvaritakis N, Antonio S, Stephane I (2000) Modelling energy technology dynamics: methodology for adaptive expectations models with learning by doing and learning by searching. Int J Global Energy Issues 14: 104-115.
- IEA (2014) Trend 2014 in photovoltaic applications. International Energy Agency, IEA PVPS.
- IRENA (2012) Renewable energy technologies: cost analysis series, Solar Photovoltaics. Abu Dhabi: IRENA 1: 1-45.
- IEA (2015) World energy outlook 2015. IEA Publications, Paris, France.
- IEA (2014) PVPS Report: Snapshot of Global PV 1992-2013. IEA PVPS (Photovolatic Power System Programme).
- Jeong Y (2013) Forecast on PV module price and market and study on domestic and forgein confrontation strategy. Korea Energy Economics Insitute. Ulsan.
- Lee S, Choi H, Lee D, Kim J (2011) Economic evaluation for the development of solar power systems through solar irradiation data analysis. 25.
- Doshi TK, D'Souza NS, Nguyen L, Guan TH, Zahur NB (2013) The economics of solar PV in Singapore. GSTF Int J Eng Technol 2: 53-63.
- Geroski PA (1995) Markets for technology: knowledge, innovation and appropriability. In: Stoneman P (Ed). Handbook of the economics of innovation and technological change. Oxford, Basil Blackwell Ltd, UK, pp. 90-131.