
Research Article
*Address for Correspondence: Dejene Endah Rita Sulistya Dewi, Doctoral Program on Environmental Science,Diponegoro University, Indonesia Jl. Imam Barjo, Semarang-50241, Indonesia, E-mail: endahrita@yahoo.co.id
Citation: Sulistya Dewi ER, Legowo AM, Izzati M, Purwanto P. Kinetic Growth of Saccharomyces cerevisiae in Non Dairy Creamer Wastewater Medium. J Environ Stud. 2016;2(1): 5.
Copyright © 2016 Sulistya Dewi ER, et al. This is an open access article distributed under the Creative Commons Attribution License, which permits unrestricted use, distribution, and reproduction in any medium, provided the original work is properly cited.
Journal of Environmental Studies | ISSN: 2471-4879| Volume: 2, Issue: 1
Submission: 07 April, 2016 | Accepted: 18 May, 2016 | Published: 23 May, 2016
Reviewed & Approved by: Dr. Jim Clarke, Practice of Civil & Environmental Engineering, Vanderbilt University, USA
 ,
,
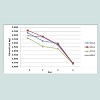
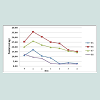
After 24th hour (day 1) the graph shows that the cell dry weight is increasing. This condition was in line with the decreasing glycerol levels chart. It can be interpreted that the utilization or use of the substrate of glycerol for cell growth Saccharomyces cerevisiae had taken place. Figure 2 shows the use of glycerol in the medium by Saccharomyces cerevisiae. The content of glycerol in the medium declined until the end of the fermentation process (day 2 to 6) which can be interpreted also that metabolic processes in the process of growth and the formation of proteins occurred. Figure 3 shows the glycerol use in growth functioned very well in the formation of protein, so stock levels of protein can be seen, especially an increase in the fermentation process day 0 to day 2. The conditions shows that the highest protein content was obtained at the concentration of 106 cells followed by the concentration of cells 107, 105 and 108. The measured protein levels at the last fermentation, decreased and of course this would be in line with the growth of cells (cell dry mass, which suffered decline). At the position of fermentation hours of 120th heading to 144 (day 5 to 6), Saccharomyces cerevisiae cell went through a phase of death, which can be characterized by a decrease in dry weight of the cells, the levels of the substrate becomes less and low protein content production.
The biomass growth of Saccharomyces cerevisiae during the 144-hour fermentation period showed two phases, exponential and maximum constant, whereas adaptation and death phases were unclear. The adaptation phase did not show up in the growth graph because the colony of Saccharomyces cerevisiae before the breeding in the fermentation medium were initially bred at enrichment medium of the non dairy creamer wastewater. Such condition allowed the colony to grow and to adapt properly before they had been inoculated in the fermentation medium. Therefore, in the fermentation medium the microbes would promptly grow and multiply.
 Furthermore, Table 1 shows that the exponential phase lasted in 24th-64th hours during the fermentation process. The biomass concentration were produced from the concentration medium of 75% ranged 90-240.625 mg/l at this phase. Substrates found in the fermentation medium (S mg/l) decreased due to the formation of the product (P mg/l), i.e. the proteins. The highest rate of proteins was found in the 24th hour of fermentation (22.15 m/l) with the specific growth rate of 0.240868 (hours-1). The substrate consumption rate (YX/S) by the cells showed a significantly extreme decrease, which meant that the glycerol as the substrate in the medium could be maximally used by Saccharomyces cerevisiae. The product formation rate (YP/S) showed an increase product of proteins which is parallel to the increase of time by 0.10818.
 During the fermentation process, the substrate composition changed over time and there would be metabolism products. Environmental condition of the Saccharomyces cerevisiae was at anunsteady state. The fermentation process took place in line with the constant specific growth rate and did not depend on the change in nutrient concentration [12,13].
Kinetic Growth of Saccharomyces cerevisiae in Non Dairy Creamer Wastewater Medium
Endah Rita Sulistya Dewi1*, Anang M. Legowo1,2, Munifatul Izzati1,3 and Purwanto Purwanto1
- 1Department of Environmental Engineering, University of Port Harcourt, PMB 5323, Nigeria
- 2Department of Agricultural Sciences, Faculty of Animal and Agricultural Science, Diponegoro University, Jl. Imam Barjo, Semarang -50241, Indonesia
- 3Department of Biology, Faculty of Sains & Mathematics, Diponegoro University, Jl. Prof. Soedarto SH, Semarang-50275, Indonesia
*Address for Correspondence: Dejene Endah Rita Sulistya Dewi, Doctoral Program on Environmental Science,Diponegoro University, Indonesia Jl. Imam Barjo, Semarang-50241, Indonesia, E-mail: endahrita@yahoo.co.id
Citation: Sulistya Dewi ER, Legowo AM, Izzati M, Purwanto P. Kinetic Growth of Saccharomyces cerevisiae in Non Dairy Creamer Wastewater Medium. J Environ Stud. 2016;2(1): 5.
Copyright © 2016 Sulistya Dewi ER, et al. This is an open access article distributed under the Creative Commons Attribution License, which permits unrestricted use, distribution, and reproduction in any medium, provided the original work is properly cited.
Journal of Environmental Studies | ISSN: 2471-4879| Volume: 2, Issue: 1
Submission: 07 April, 2016 | Accepted: 18 May, 2016 | Published: 23 May, 2016
Reviewed & Approved by: Dr. Jim Clarke, Practice of Civil & Environmental Engineering, Vanderbilt University, USA
Abstract
Efforts in non dairy creamer (NDC) wastewater treatment can be performed by converting it into raw materials, i.e. as a medium for microorganisms growth. This research had an objective of examining the growth kinetics of Saccharomyces cerevisiae in the fermentation of the non dairy creamer wastewater for protein production. Kinetic study of the growth and fermentation is necessary as an introduction to understanding each process of the fermentation. The research applied an Experimental Design with a full factorial design. Treatments during the experiment consisted of P1 (NDC medium concentration of 25%), P2 (NDC medium concentration of 50%), P3 (NDC medium concentration of 75%), and P4 (NDC medium concentration of 100%). The cellular concentrate intakes were 105, 106, 107, and 108 cell/ml. The experiment resulted in specific growth rate (μ) of 0.240868 (hour-1), maximum specific growth rate (μmax) of 55.7479 (hour-1), with the highest protein contents of 22.15 mg/l at the concentration medium of 75%.Keywords
Saccharomyces cerevisiae; Non dairy creamer wastewaterIntroduction
Non dairy creamer wastewater that migrates from waste disposal has been proven to cause pollution due to inadequate treatment. In addition to reducing water body quality, the wastewater also has bad smell, which also impacts the affected environment. The smell comes from organic compounds within the wastewater. Therefore, proper treatment is important to convert the wastewater into valuable raw materials.There have been many studies concerning wastewater as a more affordable growth medium for microorganisms in order to produce single cell proteins. However, none of the studies has done so with non dairy creamer wastewater. The use of Saccharomyces cerevisiae in the treatment of non dairy creamer wastewater is expected to have a promising prospect in producing single cell proteins. Single cell proteins are dry cells, which can be found in khamir, bacteria, and algae. These biomass microorganisms are potential sources of proteins for human food and livestock feed. The single cell proteins can be an alternative to fulfill the future needs for proteins because they contain particular proteins as well as carbohydrates, fat, mineral, and other nutrients for both human and animals, cited from [1-3]. The use of Saccharomyces cerevisiae in the non dairy creamer wastewater treatment is expected to be effective in the production of the single cell proteins.
According to laboratory analysis, the non dairy creamer wastewater contained organic matters, in particular carbon in the form of carbohydrate, protein, and fat, so that they have a great potential to be a growth medium for microorganisms. One of the treatments of the non dairy creamer industry wastewater can be converting the wastewater into raw materials. These raw materials are useful for the medium of the microorganism fermentation developed in the production of the single cell proteins.
The fermentation process can be assessed through fermentation kinetics. Kinetics study of the growth and fermentation is important as an introduction to understanding each process of the fermentation. The data to be observed concerning the microbial growth include the following parameters: specific growth rate, doubling time, growth yield, metabolic quotient, and biomass maximum rate. The fermentation kinetics illustrates the growth and the formation of products by microorganisms. Not only active cells, but also dormant and dead cells participate into the fermentation process. The kinetics of growth and formation of the products is affected by cells’ response ability. Therefore, the study of growth kinetics in the fermentation process is particularly important.
Based on the background of the study, we performed a kinetics study on the growth of Saccharomyces cerevisiae to produce single cell protein and to keep the environment from pollution caused by non dairy creamer wastewater with used it for growth medium for microorganisms.
Materials and Methods
Equipment and materials preparation: The materials for the experiment consisted of the colony of Saccharomyces cerivisiae, non dairy creamer wastewater, khamir extract, pepton, dextrose, aquades, NaOH 0.5 N, H2O, Na2CO3, and CuSO4.YEPD medium design: The YEPD medium was made of khamir extract, pepton, dextrose and aquadest. All of the materials were put into beaker glass and stirred to obtain homogenous mixture. The mixture was then put into a 150 ml erlenmeyer jar or jam bottle, covered with sponge cap and aluminum foil, and sterilized with autoclave at 121 ºC for 15 minutes. Furthermore, the medium was freezed and then inoculated.
Inoculum preparation: Following [4], in which Saccharomyces cerevisiae is cultured in the YPDA medium for four days and inoculated at 28 ºC, and then washed in the 25 ml sterilized, distilled aquadest to produce end concentration of 106 cells/ml.
Wastewater medium characteristics for production: This stage dealt with an examination of carbohydrates contents, i.e. glucose, nitrogen, fat in the form of glycerol, phosphate, sulphate, and pH.
Making of non dairy creamer wastewater: Medium was made of non dairy creamer wastewater with concentrations of 100%, 25%, 50%, and 75%. These materials were stirred to obtain homogenous mixture, filtered, and put into the jam bottle. The jam bottle was covered with sponge and sterilized with an autoclave at 121 ºC for 15 minutes, and then freezed and inoculated.
Saccharomyces cerivisiae breeding in YEPD and non dairy creamer wastewater media: The breeding of the S. cerivisiae in the YEPD and non dairy creamer media followed [5]. In both YEPD and non dairy creamer media, the S. cerivisiae were suspended within sterilized aquadest with the density of 106 cells/ml. Each of the medium in the jam bottle was subject to an inoculation with 50 ml of the suspension. Furthermore, either YEPD or non dairy creamer wastewater medium was incubated at 26 ºC for 144 hours. The measurement of Saccharomyces cerivisiae pH and cell population rates took place once in 24 hours for the consecutive seven days. At this stage the experiment obtained fermentation kinetic profile at vary wastewater medium concentration, allowing the optimum wastewater concentration.
Measuring medium pH: The experiment recorded the pH of both YEPD and non dairy creamer wastewater media at 0th, 24th, 48th, 72th, 96th, 120th, and 144th hours using a pH meter.
Calculating number of S. cerevisiae cell population: The population (cells/ml) was calculated measured once in 24 hours following [6] using a hemositometer under light microscope or an optical density (OD) analysis with 550 nm wavelong photometer.
Breeding Saccharomyces cerevisiae in wastewater at optimum concentration to be determined by various concentrations of Saccharomyces cerevisiae. At this stage of the experiment, fermentation kinetic profiles were obtained at different numbers of cells concentrations, so that an optimum concentration of Saccharomyces cerevisiae cells was obtained.
Making of S. cerevisiae cell powder: The powder was made in the following steps [5]. Saccharomyces cerevisiae cells were harvested when they reached the optimum growth by a 300-rpm centrifugation twice, once in every ten minutes. Sediments were soaked by aquadest and filtered with Whatman No. 40 filter paper. The cells were dried at 50-60 ºC for three days. These dried cells were crushed and scaled for their dry cell weight. Finally, the dried cells were subject to a Micro Kjeldahl method of analysis to get the protein contents.
This experiment took place at the Chemical Laboratory of the Faculty of Sciences and Mathematics, Satya Wacana Christian University, Salatiga.
Data analysis
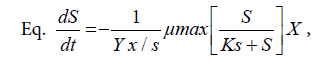
The data consisted of Saccharomyces cerevisiae density, dry cell weight, proteins in culture media, and absorption ability. These data were analyzed with Multivariate of Anova. The data collected during fermentation process were biomass volumetric concentration of Saccharomyches cerevisiae cells (X g/l), reduced organic compounds concentration (S g/l), and product proteins concentration (P g/l). This data collection took place from t0 to t6 in 24 hours. Kinetic parameters to be determined were specific growth rate (μ) Eq. ln X = μ t + ln X0, maximum specific growth rate (μm)
yield biomass on substrate (YX/S),
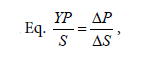
yield product on biomass (YP/S)
, and substrate use constant
Results and Discussion
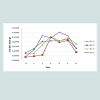
The kinetics study on the growth and fermentation are important to understanding each fermentation process. This kinetic fermentation describes the growth and product formation by microorganisms. Not only active cells, but also dormant even dead cells also took part in the process. The product growth and kinetic formation affects the cells’ response ability, so that kinetics study is important to assess the growth during the fermentation process, cited in [7-9].Microbes used nutrients for their growth through a series of biosynthesis in order to produce new cell materials or biomass. Accordingly, these microbes experienced growth in size and at particular period. They will grow two-fold. The kinetic of the biomass formation of Saccharomyces cerevisiae, the use of substrates and the formation of the proteins were observed in the production media of the non dairy creamer wastewater. Fermentation time took 144 hours. The kinetic profiles of biomass growth, substrate use and protein formation, as presented in Figures 1-3, at the concentration media of 75% respectively. Figure 1 shows the kinetic profiles Saccharomyces cerevisiae biomass growth in media concentration 75% measured in dry weight of the cells have a tendency that growth chart increases at the 24th hour of the fermentation (day 1) until the 72nd hour. Further, the graph declined at the 120 hours of fermentation leading to 144 hours of fermentation (day 5 to 6). The condition can be interpreted that microorganisms lead to the death phase.
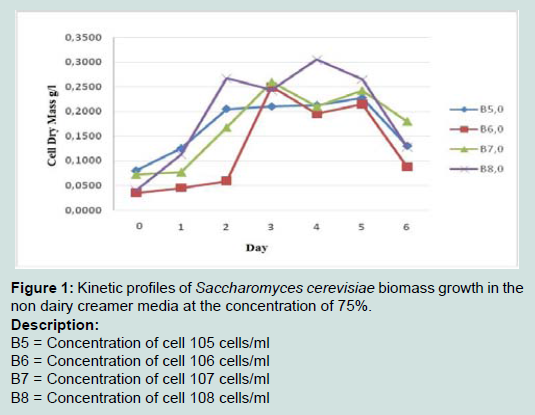
Figure 1: Kinetic profiles of Saccharomyces cerevisiae biomass growth in the non dairy creamer media at the concentration of 75%.Description:B5 = Concentration of cell 105 cells/mlB6 = Concentration of cell 106 cells/mlB7 = Concentration of cell 107 cells/mlB8 = Concentration of cell 108 cells/ml
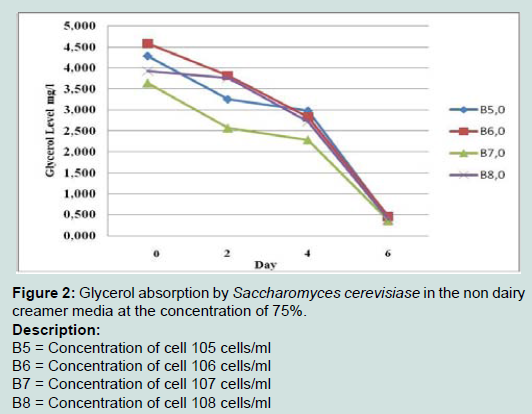
Figure 2: Glycerol absorption by Saccharomyces cerevisiase in the non dairy creamer media at the concentration of 75%.
Description:
B5 = Concentration of cell 105 cells/mlB6 = Concentration of cell 106 cells/mlB7 = Concentration of cell 107 cells/mlB8 = Concentration of cell 108 cells/ml
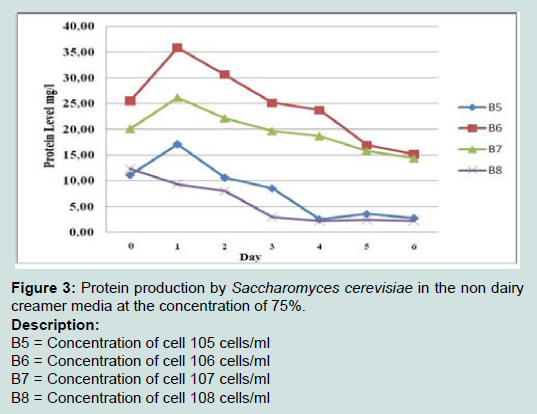
Figure 3: Protein production by Saccharomyces cerevisiae in the non dairy creamer media at the concentration of 75%.Description:B5 = Concentration of cell 105 cells/mlB6 = Concentration of cell 106 cells/mlB7 = Concentration of cell 107 cells/mlB8 = Concentration of cell 108 cells/ml
According to [10], the use of the inoculums culture medium is similar to the fermentation medium may accelerate the adaptation phase. Therefore, at the beginning of the fermentation, the growth of Saccharomyces cerevisiae directly entered the exponential phase, during which the Saccharomyces cerevisiae grew at the maximum specific growth rate.
Cited from [11] which supported the above conclusion by stating that one of the phases for producing starter is by growing the microbes in the proper medium and incubation process until it reached the optimum growth rate.
Meanwhile, death phase may occur when the availability of nutrients in the medium continue to decrease, energy supply within the cells depletes and the presence of toxic metabolite products, which hamper the growth of Saccharomyces cerevisiae.
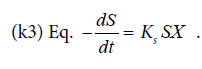
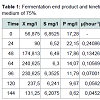
The correlation between fermentation time and biomass concentration, total glycerol substrate and protein product could determine the biomass (X g/l), glycerol concentration (S g/l), and protein concentration (P g/l) residual. It can also determine the kinetic parameters of specific growth rate (μ), maximum specific growth rate (μmax), yield biomass on substrate (Y X/S), yield product on biomass (Y P/S), substrate use constant (K3). The end /residual product of the fermentation process and the kinetic parameters are presented in Table 1.
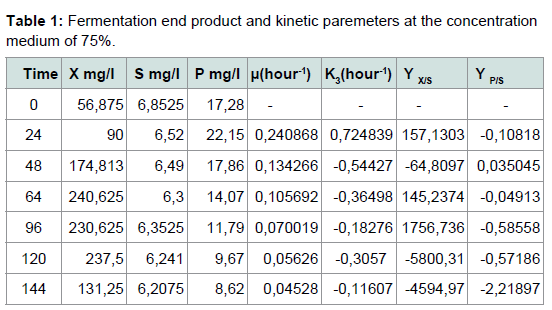
Table 1: Fermentation end product and kinetic paremeters at the concentration medium of 75%.
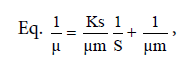
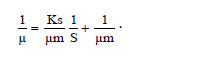
The specific growth rate decreased by the length of time for fermentation. At logarithmic phase the experiment found a maximum cell growth. This promising cell growth resulted in constant specific growth rate (μ), constant cell composition, different breeding medium chemical composition due to product synthesis and the use of substrate. During the exponential phase, the growth rate of dX/s increased by X. The logarithmic presentation, log X=f(t) resulted in straight line. The specific growth rate was constant and it reached the maximum when the substrates or particular compounds needed for the growth in the breeding medium which almost depleted and there was abundant of inhibiting products, dX/s (Table 1). There would be a decrease on the μ(hours-1) at the lowest rate when the fermentation reached the 144th hour (0.04528) at the concentration medium of 75%. At the stationary phase, the biomass concentration was maximum. The decreasing phase began with the loss of viable cell population in the media due to mortality, followed by autolysis by cellular enzymes. In the optimum condition the growth rate would be maximum, from which the term maximum specific growth was derived. The maximum specific rate (μm) was obtained by correlating 1/μ to 1/S according to the equation.
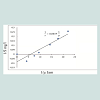
Furthermore, 1/μm was the intercept and Ks/μm was formed from this linear equation. At the concentration medium of 75%, the experiment obtained μm=55.7473 and Ks=6.3. Figure 4 shows Curve 1/μ on 1/s. Figure 4 shows 1/s=0,8409 1/μ closing to 1, where 1 was deemed having inter-variable strong correlation so that there was an interaction between growth rate and substrate rate.
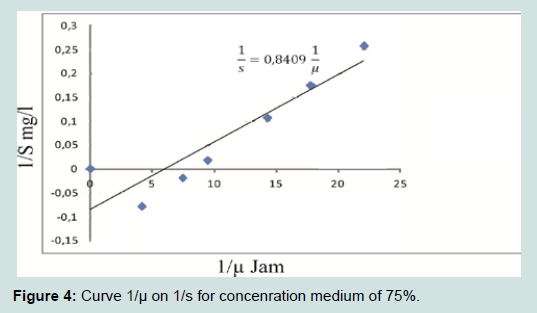
Figure 4: Curve 1/μ on 1/s for concenration medium of 75%.
Table 1 shows the specific growth rate of Saccharomyces cerevisiae in the medium concentration of 75%. The specific growth rate at the medium concentration was used to enhance the maximum growth rate by using Monod equation. The maximum specific growth rate was determined by using the highest specific growth, i.e. the maximum specific growth rate from the calculation, 55.7479 hours-1 at the concentration medium of 75%. The maximum specific growth rate from the calculation showed the contribution of the Saccharomyces cerevisiae to produce proteins. Figure 3 shows that the medium concentration intake resulted in different rate of proteins. This was parallel to the maximum specific growth rate from the calculation of the Monod equation.
The substrate consumption by the Saccharomyces cerevisiae was proven by the decrease of the glycerol concentration (Figure 2). The lower the remaining glycerol concentration (S g/l), the faster the formation of the product, i.e. the proteins (P g/l).
According to [10], typically glucose becomes the main source of carbons absorbed through an active transfer, which is then metabolized to produce energy and cell-forming materials synthesis, as well as metabolite synthesis. The glucose absorption causes the decrease of glucose in the culture during fermentation. The decrease of the Saccharomyces cerevisiae culture-dissolved glucose indicates the glucose absorption by the microbes for the purpose of metabolism and formation of macromolecules (β-glucose), leading to an increasing product.
To the present day, the glucose supply is inadequate. Therefore Saccharomyces cerevisiae will use it for metabolism process. However, at fermentation condition within the non dairy creamer wastewater medium derived from coconut oil, the Saccharomyces cerevisiae will be able to use the glycerol contained within these materials.
The microbial-borne glycerol will be converted to phosphoglyceric acid, pyruvic acid, and acetyl-CoA. These substances will enter Krebs cycle to produce ATP.
Following [14], the use of the glycerol substrate in batch system to produce Saccharomyces cerevisiae biomass can be recommended. The substrate consumed can be converted to biomass and product formation and useful for energy maintenance.
The substrate consumption by Saccharomyces cerevisiae cells is observable by the decrease of glycerol and in parallel to the substrate use constant (K3). The heavier dry cells as the cell growth rate, the lower the remaining glycerol will be.
Yield biomass on the substrate refers to as (Y X/S). It was a comparison between biomass formed and consumed substrate. In this study, the substrate consumption rate by the cells showed an extreme decrease of the remaining glycerol contents, which meant that the medium had been in maximum use. The low/high remaining glycerol contents in the medium were affected by the microorganism ability to convert the carbon source in the substrate to the biomass and products.
The comparison of the yield x/s from the experiment with theoretical conversion rate showed an efficient fermentation process. The yield product on the substrate explained the comparison between products to be formed and substrates to be consumed.
These calculations can be used for assessing the preferred system/ fermentor performance. Besides, they can also be useful for economic analysis, which describes the correlation between the availability and the price of raw materials and products to be obtained [15]. The product formation rate was an increase of the product in the form of varied proteins related to time. In the batch culture, the formation rate of the proteins varied due to the continued decrease of the substrate. The decrease of the substrate concentration can be expressed in its consumption rate, i.e. the decrease of the substrate concentration is parallel to the time allocated.
Conclusion
The kinetic parameters of the fermentation of the single cell production by the Saccharomyces cerevisiae in the non dairy creamer wastewater medium resulted in the highest protein rate 22.15 mg/l, specific growth rate (μ) 0.240868 (hours-1), maximum specific growth rate (μmax) 55.7479 (hours-1), yield biomass on substrate (Y X/S) 157.1303, yield product on biomass (Y P/S) 0.10818, and substrate use constant (K3) 0.724839, at the concentration medium of 75%.References
- Nasseri AT, Rasoul-Amini S, Morowvat MH, Ghasemi Y (2011) Single cell protein : production and process. Am J Food Technol 6: 103-116.
- Prakash B, Porumal P, Tamilmani P, Mathew LP (2013) Economic utilization of horn residues for microbial biomass & SCP production by solid state fermentation. Asian J Biochem Pharm Res 3: 104-110.
- Jaganmohan P, Purushottam Daas B, Prasad SV (2013) Production of single cell protein (SCP) with Aspergillus terreus using solid state fermentation. Eur J Biol Sci 5: 38-43.
- Mondal AK, Sengupta S, Bhowal J, Bhattacharya DK (2012) Utilization of fruit wastes in producing single cell protein. Int J Sci Environ Technol 1: 430-438.
- Amaria, Agustini R, Cahyaningrum SE, Santosa SJ, dan Narsito (2007) Adsorbsi seng (II) menggunakan biomassa Saccharomyces cereviceae yang diimobilisasi pada silika secara sol gel. Akta Kimindo 2: 63-74.
- Purwitasari E, Pangastuti A, Setyaningsih R (2004) Pengaruh media tumbuh terhadap kadar protein Saccharomyces cereviceae dalam pembuatan protein sel tunggal. Bioteknologi 1: 37-42.
- Najafpour G, Khavarpour M, Ghoreyshi AA, Jahanshahi M, Bambai B (2011) Biodesulfurization of natural gas: growth kinetic evaluation. Middle-East J Sci Res 7: 22-29.
- Sridevi A, Radha S, Viswanath B, Rajasekhar Reddy B, Narasimha G (2012) Kinetic model for cellulase production by Aspergillus niger isolated from effluents of cotton ginning industry. Br J Eng Technol 1: 163-183.
- Fan S, Chen S, Tang X, Xiao Z, Deng Q, et al. (2015) Kinetic model of continuous ethanol fermentation in closed-circulating process with pervaporation membrane bioreactor by Saccharomyces cerevisiae. Bioresour Technol 177: 169-175.
- Thontowi A, Kusmiati, Nuswantara S (2007) β-Glucan production of Saccharomyces cerevisiae in medium with different nitrogen sources in air-lift fermentor. Biodiversitas 8: 253-256.
- Annuar MS, Tan IK, Ibrahim S, Ramachandran KB (2008) A kinetic model for growth and biosynthesis of medium-chain-length poly-(3-hydroxyalkanoates) in Pseudomonas putida. Braz J Chem Eng 25: 217-228.
- Liua CG, Linb YH, Baia FW (2011) A kinetic growth model for Saccharomyces cerevisiae grown under redox potential-controlled very-high-gravity environment. Biochem Eng J 56: 63-68.
- Zakhartsev M, Yang X, Reuss M, Pörtner HO (2015) Metabolic efficiency in yeast Saccharomyces cerevisiae in relation to temperature dependent growth and biomass yield. J Therm Biol 52: 117-129.
- Ochoa-Estopier A, Lesage J, Gorret N, Guillouet SE (2011) Kinetic analysis of a Saccharomyces cerevisiae strain adapted for improved growth on glycerol: Implications for the development of yeast bioprocesses on glycerol. Bioresour Technol 102: 1521-1527.
- Zinnai A, Venturi F, Sanmartin C, Quartacci MF, Andrich G (2013) Kinetics of D-glucose and D-fructose conversion during the alcoholic fermentation promoted by Saccharomyces cerevisiae. J Biosci Bioeng 115: 43-49.