
Journal of Environmental Studies
Download PDF
Research Article
*Address for Correspondence: Dejene Alemayehu, Kaw Nation Environmental Department, Kaw City, OK 74641, Oklahoma, USA, Tel: 580-269-1203; E-mail: jain.ram.b@gmail.com
Citation: Alemayehu D, Hackett F. Water Quality and Trophic State of Kaw Lake. J Environ Stud. 2016;2(1): 7.
Copyright © 2016 Alemayehu D, et al. This is an open access article distributed under the Creative Commons Attribution License, which permits unrestricted use, distribution, and reproduction in any medium, provided the original work is properly cited.
Journal of Environmental Studies | ISSN: 2471-4879| Volume: 2, Issue: 1
Submission: 03 March, 2016 | Accepted: 01 April, 2016 | Published: 06 April, 2016
Reviewed & Approved by: Dr. Mark Meo, Department of Geography & Environmental Sustainability, University of Oklahoma, USA
 Water quality surveys were conducted for three years, once in a month towards the end of each month. Measurements were done and samples collected from four sites within Kaw Lake. Water samples were collected from the upper layer of the lake called secchi disk depth, which is a few inches deep, and thereafter 1.2 meters intervals down into the lake in a vertical profile until 6 meters was reached. The secchi disk transparency measurement was determined by the depth at which the black and white disk is no longer visible with the naked eye in the water column. Water samples were taken to Accurate Lab, a certified laboratory in Stillwater for the analyses of total nitrogen (EPA method 300), total phosphorous (EPA 365.1) and chlorophyll a (SM10200H). Algal species enumeration and trophic site index values were also determined by KNED. Trophic State Index ranges along a scale from 0-100 based upon relationship between secchi depth, chlorophyll a, total phosphorous and total nitrogen [17,18]. The trophic state index (TSI) was calculated using the following formulae.
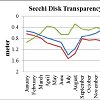
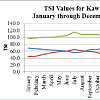
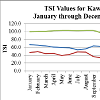
 The average secchi disk depths measured in 2013 were (0.6 m), 2014 (1.4 m) and 2015 (1.5 m). The lowest depth measurements were made on January, February and March (0.6 to 0.9 m) and September to December (0.4 to 0.9 m). The deepest measurements were in July 2015 (1.5 m) (Figure 2). The corresponding Trophic State Index calculated were in 2013 (69), 2014 (64) and 2015 (61), indicating the Secchi disk depths were in the eutrophic state (Figures 7-9).
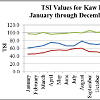
 The secchi disk depth was lower in April to September of 2014 and 2015 due to high rainfall. But it was the reverse due to low rainfall distribution in 2013.
 High algae productivity was observed starting March to October (2013 and 2014) due to high photosynthetic process and thereafter showed a declined trend.
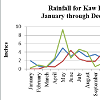
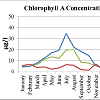
 As shown in Figure 3, there was increase in chlorophyll a concentration from 5 μg/l to 35 μg/l, March to July and decreased from 35 μg/l to 5 μg/l or less in November and December, following the amount of rainfall of less than one inch (Figure 2). As noted in Figure 3, the highest chlorophyll a concentration of 35 μg/l was observed in July where the rainfall was low. The inverse relationship between chlorophyll a and water level was noted by other studies [24,26]. In July and August, the turbidity was low and the water was clearer and the penetration of sun light goes down deep into the lake stimulating more photosynthetic process, increasing algal biomass and productivity. As shown in Figure 11, productivity of chlorophyll a increases as the concentration of total phosphorus increases until July. From November to February the concentration decreases from 35 μg/l to 5 μg/l, due to decreased sunlight, photosynthetic process, and frigid weather (Figure 3). Over all the trophic state of chlorophyll a concentration remained below 60 (TSI-Chla) indicating the lake to be in oligotrophic to mesotrophic state index (Figures 7-9).
 Human beings influence Lake Ecosystem by increasing the concentration of plant nutrients, primarily phosphorus [28]. The nutrient may enter into lakes as agricultural runoff, sewage, or wastewater and also by cattle ranching; causing over enrichment of nutrients in water bodies leading to algal bloom [29]. The decaying process of dead algal biomass may also result in the depletion of dissolved oxygen in the lakes causing anoxic environment [30].
Water Quality and Trophic State of Kaw Lake
Dejene Alemayehu* and Francine Hackett
- Kaw Nation Environmental Department, Kaw City, OK 74641, Oklahoma, USA
*Address for Correspondence: Dejene Alemayehu, Kaw Nation Environmental Department, Kaw City, OK 74641, Oklahoma, USA, Tel: 580-269-1203; E-mail: jain.ram.b@gmail.com
Citation: Alemayehu D, Hackett F. Water Quality and Trophic State of Kaw Lake. J Environ Stud. 2016;2(1): 7.
Copyright © 2016 Alemayehu D, et al. This is an open access article distributed under the Creative Commons Attribution License, which permits unrestricted use, distribution, and reproduction in any medium, provided the original work is properly cited.
Journal of Environmental Studies | ISSN: 2471-4879| Volume: 2, Issue: 1
Submission: 03 March, 2016 | Accepted: 01 April, 2016 | Published: 06 April, 2016
Reviewed & Approved by: Dr. Mark Meo, Department of Geography & Environmental Sustainability, University of Oklahoma, USA
Abstract
This study measures the concentration of nitrogen, phosphorous and chlorophyll a levels in Kaw Lake, Oklahoma using the Carlson Trophic State Index (TSI). Kaw Lake is 16 km east of Ponca City and about 5 km from Kaw Nation headquarter in Kaw City, OK. The Lake was constructed in 1976 by the Army Corps of Engineers (ACE) for the purpose of water supply, recreation, electricity and wildlife conservation services. Since the early 20th century, lakes have been classified according to the trophic state into oligotrophic, mesotrophic and eutrophic based on secchi disk depth transparency, chlorophyll a, and total phosphorous and total nitrogen concentrations. The purpose of this study was to evaluate the productivity of Kaw Lake and algal biomass production through the interaction of nutrient concentration mainly total phosphorous, chlorophyll a and secchi disk transparency as defined in Carlson Trophic State Index.In order to determine the trophic state index, water samples were collected from the surface of the lake to 6 meters depth at 1.2 meters vertical interval of the lake profile. The samples were analyzed for the concentration of nitrogen and phosphorous along with chlorophyll a at a certified commercial laboratory in Stillwater, OK from January to December, 2013-2015. The three years of TSI data analysis indicates that the average TSI of secchi disk transparency was in the range of 61-70, chlorophyll a 42-55, total phosphorous 99-104 and total nitrogen 164-166. The overall result of the study showed that the Carlson TSI of Kaw Lake excluding nitrogen ranged between 67-74 indicating that the lake is eutrophic to hypereutrophic requiring measures to control runoff, sedimentation and algal biomass. Based on the nitrogen and phosphorous ratio examined Kaw Lake is predominately nitrogen limited lake. This study suggests that managers and policy makers should take actions to slow down or halt eutrophication by applying best management practices of the soil and water conservation measures. A measure that minimizes fertilizer use, storm water runoff, septic system effluents and dredging of sediment deposition should be incorporated in the short and long term lake management practices of the watershed program.
Keywords
Trophic state index; Lake productivity; Eutrophication; Kaw lakeIntroduction
Kaw Lake was constructed in 1976 by the Army Corps of Engineers (ACE) for the purpose of water supply, recreation, electricity and wildlife conservation services. While some water quality problems may have been noted in its earlier years, no major water quality parameters related to eutrophication were studied except by the ACE, Alemayehu and OWRB [1-3]. Eutrophication is the process by which a body of water acquires high concentration of nutrients, especially nitrogen and phosphorous that promotes growth of algae [4,5].In order to determine the productivity of lakes, Carlson classified lakes and reservoirs into oligotrophic (low productive), mesotrophic (moderately productive), eutrophic (very productive & fertile) and hypereutrophic (extremely productive) based on nutrient enrichment and algal productivity [6].
Although light, temperature, and micronutrients are the main contributories for primary production, the addition of nutrients such as nitrogen and phosphorous impact the level of eutrophication [7].
The goal of this study was to create awareness among stake holders (federal, state, tribal, municipalities and communities) on the impact of nutrients (mainly nitrogen and phosphorous), algae, and siltation on the water quality and quantity of the lake and its biological productivity.
In lakes, total phosphorous concentration is the most common and useful indicator of trophic state [8]. In aquatic environments phosphorous is typically the nutrient in shortest supply [9] relative to nitrogen. The atmosphere is not a source of phosphorous because phosphorous does not exist in gaseous phase as nitrogen does. Phosphorous sorbs strongly to soil particles making erosion and dry deposition one source of phosphorous in water. Sorption to soil particles also allows it to be removed by sedimentation. Although phosphorous is naturally scarce, human activities can increase phosphorous in waters through human and animal waste, detergents and fertilizers, and erosion [10,11].
Nitrogen is more abundant than phosphorous and therefore less limiting to aquatic primary productivity [10]. However, nitrogen in both bioavailable and total concentrations is still used in predicting eutrophication. Total nitrogen (TN) is the summation of total kjeldahl nitrogen (TKN), nitrate and nitrite. Nitrogen differs from phosphorous in that it does not readily sorb to soil particles, it exists in the atmosphere and may be removed from the aquatic ecosystem through denitrification [10,11].
Nitrogen to phosphorous (N:P) ratios are useful in defining the nutrient in shortest supply that will limit algal growth [10,11]. Most surface waters are nitrogen or phosphorous limited. The use of N:P ratio to assess nutrient limitation assumes that algal growth is proportional to the quantity of either nitrogen or phosphorous in the water body [12].
Nutrient ratio less than 10 indicates nitrogen limitation; a ratio between 10 and 30 indicates co-limitation, and ratios greater than 30 shows phosphorous limitation [12].
The use of transparency as measured by secchi disk to estimate chlorophyll a along with nutrient are the primary factors that determines the level of eutrophication [6,13].
Transparency is based on the transmission of light through the water and the amount of suspended solids in the water and the natural color of the water. Secchi disk transparency depth is probably correlated with phosphorous concentration and chlorophyll a to determine the level of eutrophication using TSI [6]. Chlorophyll a is a green pigment found in plants and an indicator of phytoplankton abundance and biomass. In most instances high concentration indicates poor water quality [14,15].
Eutrophication may interfere with recreational, aesthetic and fishery water usage making water less suitable for potable use and recreation [9,11].
Methodology
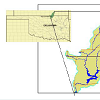
Kaw Lake is located 16 km east of Ponca City, Kay County Oklahoma, within the Northern Limestone Cuesta Plains [1,16]. Kaw Lake dam is located at a distance of 1,046 km on the Arkansas River, in the hydrological unit code of 10060001 (Figure 1). The lake has normal pool water storage of 52,867 hectare meter with water supply storage of 21,117 hectare meter [1]. The lake receives water from the Arkansas River that comes all the way from Colorado through Kansas into Kaw Lake. During this travel, surface runoff from agricultural fields, livestock ranch, and sewage from urban areas may join the river and drains into the lake during the rainy season.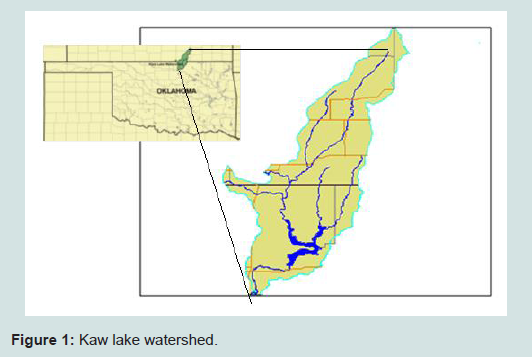
Figure 1: Kaw lake watershed.
1. TSI for secchi disk depth (SD) = 60-14.41 x Ln SD meters
2. TSI for chlorophyll a (Chla) = 9.81 *Ln Chla, μg/l + 30.6
3. TSI for total phosphorus (TP) = 14.42 Ln TP μg/l + 4.15
4. TSI for total nitrogen (TN) = 54.45 + 14.43 Ln TN μg/l
The final CTSI was calculated by averaging the above values andthe limiting nutrient using the following equation (LCWA):
Nutrient - Balanced Lakes (10 ≤ TN/TP ≤ 30)
TSI = [TSI (chla)+ [TSI (TN) + TSI (TP)] /2}/2
Phosphorous - Limited Lakes (TN/TP > 30) then TSI = [TSI (chl a)+ TSI (TP)]/2
Nitrogen - Limited Lakes (TN/TP < 10)
TSI = [TSI (chla) + TSI (TN)]/2
Where CTSI is Carlson Trophic State Index and Ln is natural logarithm. TSI is a measure of the trophic status of a body of water using several measures of water quality including: secchi disk depth transparency, chlorophyll a, concentration of algal biomass and total phosphorous level [6,15].
Results
In order to determine nutrient enrichment of Kaw Lake, water quality samples were analyzed for total nitrogen, total phosphorous, chlorophyll a and secchi disk depth from January to December of 2013 through 2015 (Figures 1-6) are presented below.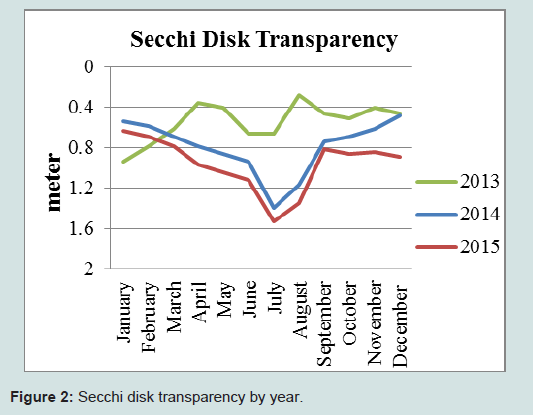
Figure 2: Secchi disk transparency by year.
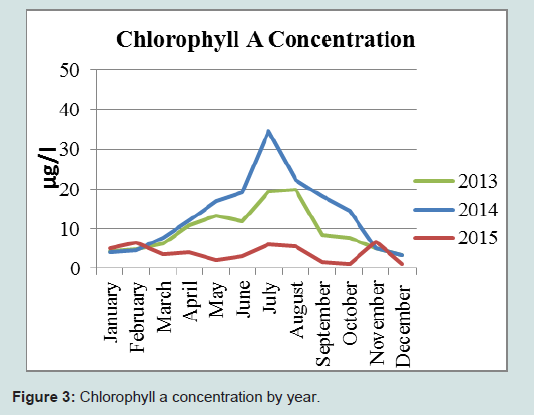
Figure 3: Chlorophyll a concentration by year.
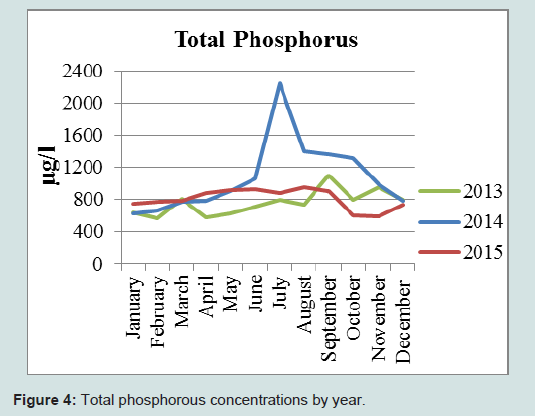
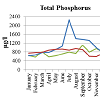
Figure 4: Total phosphorous concentrations by year.
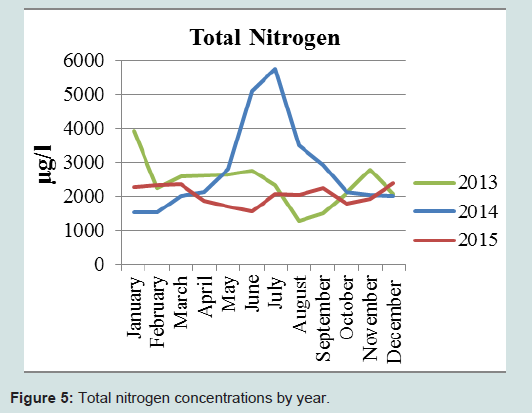
Figure 5: Total nitrogen concentrations by year.
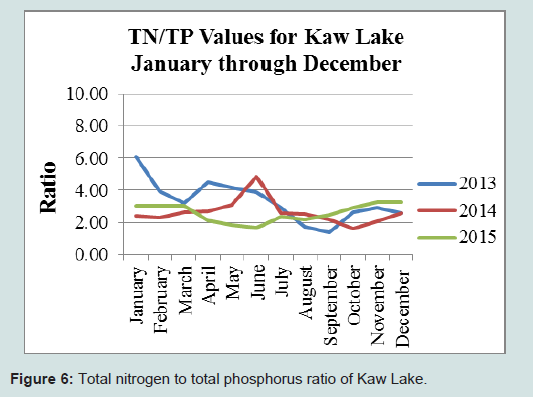
Figure 6: Total nitrogen to total phosphorus ratio of Kaw Lake.
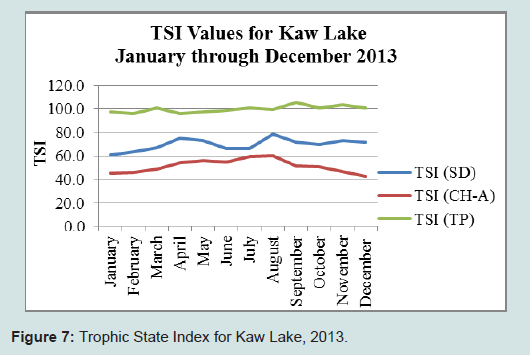
Figure 7: Trophic State Index for Kaw Lake, 2013.
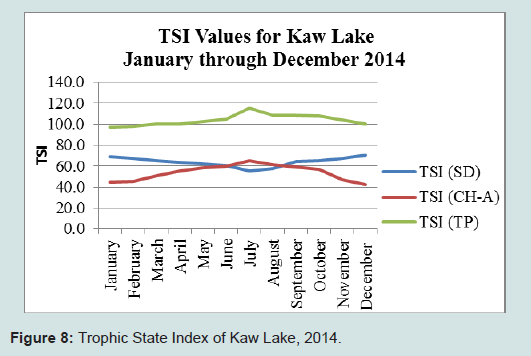
Figure 8: Trophic State Index of Kaw Lake, 2014.
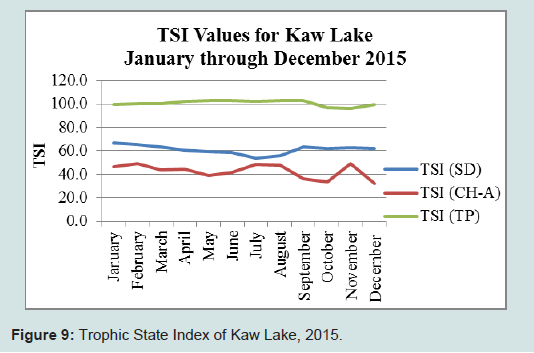
Figure 9: Trophic State Index of Kaw Lake, 2015.
The average chlorophyll a concentrations measured were in 2013 (13.1 ug/l), 2014 (19.7 ug/l) and 2015 (3.8 ug/l). The lowest measurements were made in January to March (4.43 ug/l to 6.67 ug/l). The highest chlorophyll a concentration was in July (34.66 ug/l) (Figure 3). At the same time the average Trophic State Index for chlorophyll a was in 2013 (51.29, 2014 (53.8 ug/l) and 2015 (42.45 ug/l), indicating oligotrophic to mid eutrophic state (Figures 7-9 and Table 1) [19].
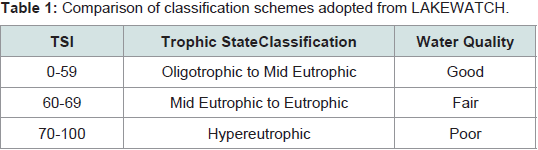
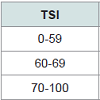
Table 1: Comparison of classification schemes adopted from LAKEWATCH.
The average phosphorous concentration measured in 2013 were (765 ug/l), 2014 (1300 ug/l) and 2015 (911.8 ug/l). The lowest phosphorous concentrations measured were in January to March (572 ug/l to 750 ug/l) and October to December (589 to 798 ug/l) (Figure 4). The highest phosphorous concentration was recorded in July of 2014 (2250 ug/l) (Figure 4) due to increased rainfall. Total phosphorous concentration was high in all months of the years.
The relatively high concentration of phosphorous in Kaw Lake during the spring could be attributed to fertilizer run off from the surrounding agricultural fields and may be from phosphorous loading in the hypolimnion layer [20]. The average Trophic State Index calculated for total phosphorous were in 2013 (99.6), 2014 (103) and 2015 (100) indicating Kaw Lake was in the hyper trophic state for phosphorous concentration (Figures 7-9).
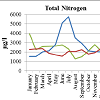
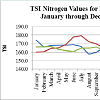
The average nitrogen concentrations measured were 2401 ug/l in 2013, 2795 ug/l in 2014 and 2046 ug/l) in 2015. The lowest nitrogen concentrations measured were in January to March (1530 ug/l to 2270 ug/l) and October to December (1786 to 2065 ug/l) (Figure 5). The highest nitrogen concentration was recorded in July of 2014 (5760 ug/l) (Figure 5). The highest concentration of total nitrogen was in May to July where we had high chlorophyll a bloom due to active photosynthetic process.
The relatively high concentration of total nitrogen in Figure 5 could be from fertilization of crop land, lawns and gardens. Decomposition of organic matters washed off into the lake could be important source of nutrient loading available to phytoplankton.Nutrient concentration also may vary with depth in a lake. Near the top of the lake, where light stimulates algae growth, total nutrient concentrations may be higher than those deeper in the Lake.
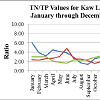
TN:TP ratios have been used as a basis for estimating which nutrient limits algal growth [21]. Low TN:TP ratios (less than about 10:1) are indicative of nitrogen limitation, whereas ratios greater than 10:1 are increasingly indicative of phosphorus limitation. However, these low ratios are typically the result of very high TP loads from point or nonpoint sources in the watershed rather than a shortage of nitrogen receiving significant amounts of sewage effluent [7].
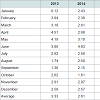
The total nitrogen to total phosphorous ratio was also calculated to determine which element had the most limiting nutrients. Average TN:TP ratios were in 2013 (3.3), 2014 (2.61) and in 2015 (2.59) (Table 2), characterizing the lake nitrogen to be the limiting nutrient. If the nitrogen concentration in the lake is < 10 mg/l and phosphorous values > 20 mg/l (Figures 4-6), then nitrogen is the limiting nutrient [14,22].
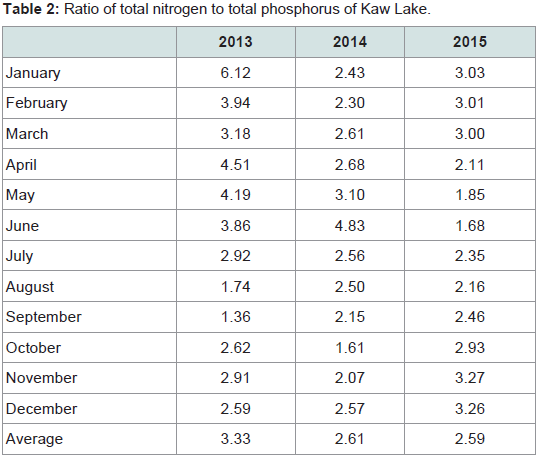
Table 2: Ratio of total nitrogen to total phosphorus of Kaw Lake.
Discussion
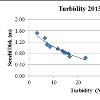
This study is based on Carlson Trophic State Index where it is assumed there exist a close relationship between total phosphorous, chlorophyll a, and secchi disk depth transparency in phosphorous limited lakes [23,24]. Total nitrogen is also used as additional trophic state variable [17,24,25].As shown in Figure 2, January to March and September to December, the secchi disk was at a shallow depth ranging from 0.5 m to 0.9 m due to high turbidity. In July the turbidity was low and the secchi disk was at 1.5 m, indicating the lake was clearer than it was before due to low rainfall amount (Figure 10). In Figure 11, as the secchi depth decreased, turbidity increased or vice versa, as the turbidity of the lake increased, the secchi depth decreased. This observation affirms that the Trophic State Index of the secchi disk (TSI-(SD)) was larger than that of the Trophic State Index (TSI-(Chla)) of chlorophyll a. The secchi disk remained above 60 TSI than the trophic state of chlorophyll a (< 60 TSI) throughout the three years of this study (Figures 7-9), indicating turbidity is dominated by runoff that emanating from the Arkansas River watershed and waste water from local municipalities than algae.
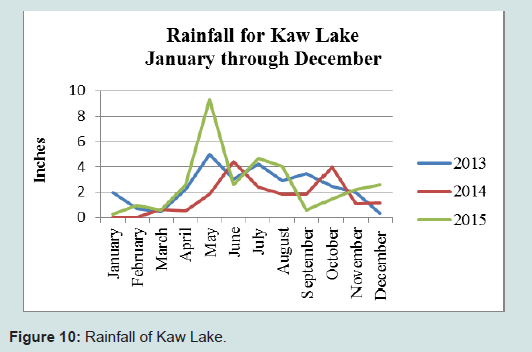
Figure 10: Rainfall of Kaw Lake.
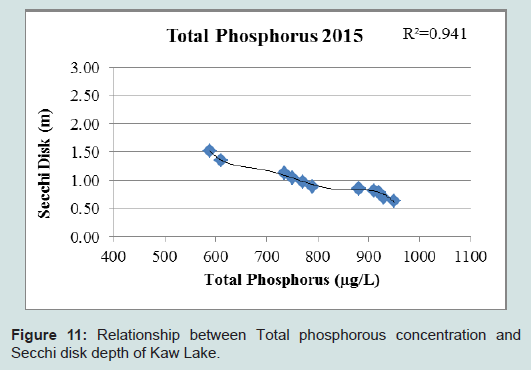
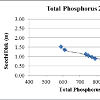
Figure 11: Relationship between Total phosphorous concentration andSecchi disk depth of Kaw Lake.
As shown in Figure 4, the total phosphorus concentration increased from 790 μg/l in April to 2250 μg/l in July of 2014 and decreased in November and December due to decrease in the rainfall distribution (Figure 12). The trophic state index of phosphorous exhibited higher trophic state probably due to the run off that comes from the Arkansas River Watershed (Figures 6-8).
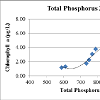
Other studies have indicated that urban development contributes to increased phosphorous load to nearby streams [27]. As shown in Figures 12-14, phosphorous concentration increased, with increase in chlorophyll a, with increase in turbidity, and decrease in secchi disk depth.
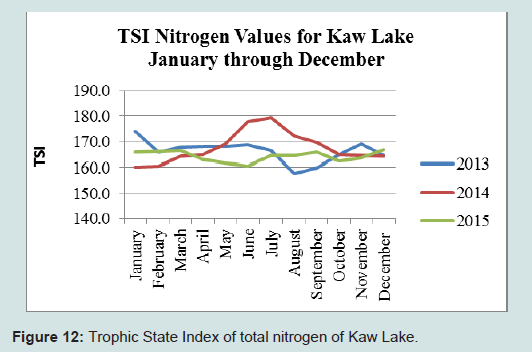
Figure 12: Trophic State Index of total nitrogen of Kaw Lake.
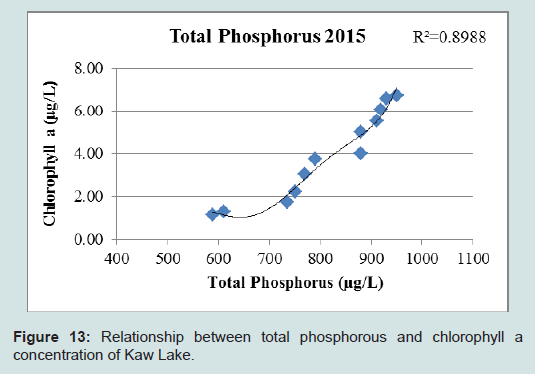
Figure 13: Relationship between total phosphorous and chlorophyll aconcentration of Kaw Lake.
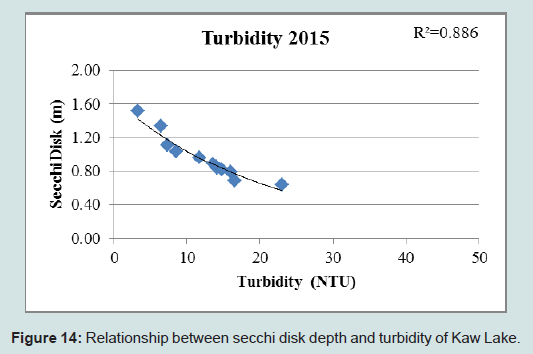
Figure 14: Relationship between secchi disk depth and turbidity of Kaw Lake.
Nitrogen is an essential plant nutrient that often correlates to water quality variables just like phosphorus. Nitrogen and phosphorus are positively correlated [31]. Most lakes are phosphorus rather than nitrogen limited, or both allow reducing lake nitrogen level and may have little effects on algal biomass [14]. Nitrogen limited lakes could find no difference in the phosphorous to chlorophyll a relationship [31]. When nitrogen actually affects algal, it is usually because either the phosphorous level is high or nutrient inputs are very low.
According to Table 2 and Figure 6, the ratio of total nitrogen and total phosphorous of Kaw Lake was evaluated to determine the limiting nutrient of the phytoplankton in the lake. Phytoplankton production in the spring and summer are limited by macronutrient [22]. Generally when the ratio of total nitrogen to total phosphorous is less than 10, nitrogen is the limiting of the two nutrients. When the ratio is greater than 20, phosphorous is the limiting nutrient [1,22]. In Kaw Lake the mean TN:TP ratio was in the range of 1.36 to 4.51 in 2013, 1.61 to 4.83 in 2014, and 1.68 to 2.93 in 2015. According to the ACE, and Alemayehu reports, Kaw Lake is possibly limited with nitrogen to primary productivity [1,2]. The relatively high concentration of phosphorous in Kaw Lake could be attributed to fertilized runoff from surrounding agricultural fields and internal phosphorous loading that occurs as a result of anoxic condition developing in the hypolimnion layer [1].
The Trophic State Index including the total nitrogen of Kaw Lake from January to December of 2013-2015 was greater than 60 TSI (Figures 2-5). But the Carlson Trophic Index was in the range of 60 to 78 TSI, indicating the lake remained to be eutrophic in most months. However, it is hard to see a clear distinction or impact of nutrient concentration months after months. The Carlson TSI works well in most lakes that are phosphorous limited, but not significant in lakes that are nitrogen limited that suffers turbidity from erosion, or experiencing extensive macrophyte problems [32]. TSI is an important aspect in lake survey, water quality and this can be used as a tool to measure trophic state where the biomass is involved. Other studies have applied Carlson‘s TSI for the assessment of trophic status of lakes and found that the systems can be very well used for the assessment of TSI of the lake [33].
According to James et al. elevated pH can also cause internal phosphorous loading when the algae are actively growing they remove carbon dioxide causing pH to increase to a value of 9.2 and phosphorous can be released from the sediment at a rates equal to or exceeding release rates under anoxia [7,14,34]. Both theories can apply to Kaw Lake.
Conclusion
Eutrophication is a leading cause of lake impairment in the aquatic ecosystem by posing a serious threat to potable drinking water sources, fisheries and recreational water bodies [35]. It is characterized by excessive concentration of nutrient, mainly nitrogen and phosphorous. Eutrophication could also occur naturally as lakes age and are filled with sediments. However, anthropogenic or cultural eutrophication activities such as agriculture, industry and sewage disposal could attribute to increased primary productivity and algal biomass.In order to regularly monitor the productivity of Kaw Lake from year to year, examining the nutrient relationship with TSI was an essential tool in the management of the ecosystem. According to the Carlson Trophic State Index calculation Kaw Lake had high concentration of nitrogen and phosphorous. These high nutrient concentrations could be inflow from the Arkansas River watershed that encompasses all agricultural farm operations that starts all the way from Wichita area to Kaw Lake.
All the industrial and sewage discharges enter into Arkansas River as a runoff carrying nutrients. These nutrients in turn enhance the growth of algae or phytoplankton. As time goes by the decayed material of the phytoplankton could lead to an anoxic (lack of dissolved oxygen in water) environmental condition of the lake.
Our study revealed that the Caslon Trophic State Index values of Kaw Lake falls in the range of 60-100, indicating the lake is in the eutrophic to hypereutrophic condition from January to December [36]. The total nitrogen to total phosphorous ratio characterizes the lake nitrogen as the limiting nutrient. This does not mean nitrogen is low in the lake. Instead, it could be from a high concentration of phosphorous entering the lake as runoff of fertilizer from the surrounding agricultural fields (non-point sources) and municipal and industrial waste water discharges (point sources) and phosphorous loading in the hypolimnion layers as described in ACE and Wetzel et al. [1,22]. The study suggests that managers and policy makers should take actions to slow down or halt eutrophication by applying best management practices of the soil and water conservation measures. Lake management practices that minimizes fertilizer use, storm water runoff, algae, septic system effluents and to some extent dredging of sediment deposition should be exercised as part of short and long term management practices [37].
Acknowledgements
We would like to thank U.S. EPA Region 6 Water Quality Division Sec. 319 Nonpoint Source Pollution Program for funding this study. The Kaw Nation Environmental Department would also like to thank Ms. Patti Kramer, Kaw Nation Chair for authorizing this study as part of the grant deliverables.Funding information
Financial support for this study was provided by U.S. Environmental Protection Agency, Water Quality Division, Region 6, Dallas, Texas.
References
- Army Corps of Engineers (ACE) (1996) Water quality report, Kaw Lake, Oklahoma. Southwestern Division, Tulsa District. Planning, Environmental and Regulatory Division.
- Alemayehu D (2006) Kaw Lake Water Quality Monitoring Report, Kaw City, OK (Unpublished).
- Oklahoma Water Resource Board (OWRB) (2009) 2008-2009 Oklahoma Lakes Report: Beneficial use monitoring program, Lake sampling, draft final report.
- Nixon SW (1995) Coastal marine eutrophication. A definition, social causes and future concerns. Ophelia 41: 199-219.
- EPA (1974) An approach to a relative trophic index system for classifying lakes and reservoirs. Working paper No. 24. National Eutrophication Survey Pacific Northwest Environmental Research Laboratory, Corvallis, Oregon.
- Carlson RE (1977) A trophic state index for lakes. Limnol Oceanogr 22: 361-369.
- EPA (2001) Ambient water quality criteria recommendations: information supporting the development of state and tribal nutrient criteria. EPA 822-B-01-010, U.S. EPA Office of Water, Washington, DC.
- Brown T, Simpson J (2001) Managing phosphorus inputs to Urban Lakes: I. Determining the trophic state of your lake. Urban Lake Manage 3: 771-781.
- Novotny V, Olem H (1994) Water quality: prevention, identification, and management of diffuse pollution. John Wiley & Sons, New York, NY.
- Chapra SC (1997) Surface water-quality modeling. Wave land Press, Inc, USA.
- Stednick JD, Hall EB (2002) Applicability of trophic status indicators to Colorado plains reservoirs. Colorado Water Resour Res Institute, Completion Report No. 195.
- Ryding SO, Rast W (1989) Control of eutrophication of lakes and reservoirs. Parthenon Publishing Group, New Jersey, pp. 314.
- Hernandez K (2002) Personal communication. EPA recommended nutrient criteria for Ecoregion V.
- North American Lake Management Society (2001) Managing lakes and reservoirs, (3rd edn). The University of Wisconsin, Madison.
- EPA (1988) The lake and reservoir restoration guidance manual, First edition. EPA 440/5-88-002, Criteria and Standards Division Nonpoint Sources Branch, Washington DC, USA.
- Chaplin JR, Mazzullo S (2010) Stratigraphic analysis of the permian chase group in northern oklahoma: outcrop analogs of reservoir rocks in the Hugoton Embayment of Northwestern Oklahoma and Southwestern Kansas. University of Oklahoma, Oklahoma.
- Kratzer CR, Brezonik PL (1981) A Carlson- type trophic state index for nitrogen in Florida Lakes. J Am Water Resour Assoc 17: 713-715.
- Lorenzen MW (1980) Use of chlorophyll-Secchi disk relationships. Limnol Oceanogr 25: 371-372.
- http://lakewatch.ifas.ufl.edu/LWcirc.html
- Wetzel RG, Likens GE (2000) Limnological analyses, Third edition. Springer, New York, NY.
- Smith VH (1982) The nitrogen and phosphorous dependence of algae biomass in lakes: an empirical and theoretical analysis. Limnol Oceanogr 27: 1101-1111.
- Wetzel RG (2001) Limnology: lake and river ecosystems, Third edition. Academic Press, San Diego.
- Mathews R, Hilles M, Pelletier G (2002) Determining trophic state in Lake Whatcom, Washington (USA), a soft water lake exhibiting seasonal nitrogen limitation. Hydrologia 468: 107-121.
- Ndungu J, Augustijn DC, Hulscher SJ, Kitaka N, Mathooko J (2013) Spatio-temporal variations in the trophic status of Lake Naivasha, Kenya. Lakes Reservoirs: Res Manage 18: 317-328.
- Carlson RE, Simpson J (1996) A Coordinator’s Guide to Volunteer Lake Monitoring Methods. North American Lake Management Society.
- Wang F, Wang X, Zhao Y, Yang Z (2012) Long term changes of water level associated with chlorophyll a concentration in Lake Baiyangian, North China. Procedia Environ Sci 13: 1227-1237.
- Becht R, Odada EO, Higgins S (2005) Lake Naivasha: experience and lessons learned brief. 277-298.
- Havens KE, Nürnberg GK (2004) The phosphorus-chlorophyll relationship in lakes: Potential influences of color and mixing regime. Lake Reservoir Manage 20: 188-196.
- Ramesh N, Krishnaiah S (2013) Scenario of water bodies (Lakes) In Urban areas- A case study on Bellandur Lake of Bangalore Metropolitan city. IOSR J Mech Civil Eng 7: 6-14.
- Devi Prasad AG, Siddaraju (2012) Carlson’s Trophic State Index for the assessment of trophic status of two lakes in Mandya district. Adv Appl Sci Res 3: 2992-2996.
- Nurenburg GK (1996) Trophic state of clear and colored, soft and hardwater lakes with special consideration of nutrients, anoxia phytoplankton and fish. Lake Reservoir Manage 12: 432-447.
- Brezonik PL (1984) Trophic state indices: rationale for multivariate approaches. Lake Reservoir Manage 1: 441-445.
- Ramesh N, Krishnaiah S (2014) Assessment of trophic status of Bellandur Lake, Bangalore, India by using USEPA technique. Int J Curr Eng Technol 4: 3467-3472.
- James WW, Barko JW, Field SJ (1996) Phosphorous mobilization from littoral sediments of an inlet region in Lake Delavan, Wisconsin. Arch Hydro Biol 138: 245-257.
- Harper D (1992) Eutrophication of freshwaters: principles, problems, and restoration. Chapman & Hall, Springer Netherlands.
- Hillbricht IA, Winsniewski RJ (1993) Trophic differentiation of lakes of the Suwalki relations in Missouri Reservoirs. J Lake Reservoir Manage 14: 1-9.
- Olem H, Flock G (1990) Lake and reservoir restoration guidance manual: Second edition. U.S. Environmental Protection Agency, Office of Water Assessment and Watershed Protection Division.