
Research Article
*Address for Correspondence: Ejikeme Ugwoha, Department of Environmental Engineering, University of Port Harcourt, P.M.B. 5323, Nigeria, Tel: 080 31181050; E-mail: ugwohaej@yahoo.com
Citation: Ugwoha E, Emete KC. Effects of Open Dumpsite Leachate on Groundwater Quality: a Case Study of Alakahia Dumpsite in Port Harcourt, Nigeria. J Environ Stud. 2015;1(1): 8.
Copyright © 2015 Ugwoha E, et al. This is an open access article distributed under the Creative Commons Attribution License, which permits unrestricted use, distribution, and reproduction in any medium, provided the original work is properly cited.
Journal of Environmental Studies | ISSN: 2471-4879 | Volume: 1, Issue: 1
Submission: 14 September 2015 | Accepted: 28 October 2015 | Published: 05 November 2015
 Sample collection
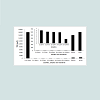
 Total dissolved solids (TDS): The TDS concentrations of the dumpsite leachate and groundwater samples as well as the FMEnv and WHO permissible limits for drinking water are shown in Figure 3. The high concentration of TDS of the dumpsite leachate (36 and 30 times greater than the FMEnv and WHO permissible limits, respectively) indicates the presence of inorganic material in the dumpsite. Despite the high concentration of TDS of the dumpsite leachate, the TDS concentrations of the groundwater samples were generally below the WHO and FMEnv standards for drinking water. The extent the concentrations went below the standards ranged 80- 253 times for FMEnv and 96-303 times for WHO, for Sample 1 (50 m from dumpsite) and Control (500 m from dumpsite), respectively. Thus, the groundwater seems unpolluted with the leachate’s TDS.
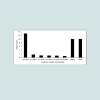
Chemical oxygen demand (COD): Figure 4 shows the COD of the dumpsite leachate and groundwater samples collected at different distances from the dumpsite. A high COD value of 1750 mg/l was detected in the leachate which indicates high organic strength [22]. However, the COD values of the groundwater samples (5.38 - 8.60 mg/l) were within the maximum permissible limit of < 10 mg/l set by WHO. This moderate COD value of the groundwater samples indicates the presence of insignificant chemically oxidizable organic contaminants in the groundwater, which implies that the groundwater may be safe for drinking. Finally, the highest COD value (8.60 mg/l) observed in Sample 1 (obtained 50 m from the dumpsite) and the lowest COD value (5.38 mg/l) detected in the Control (obtained 500 m from the dumpsite) indicates that the dumpsite leachate is contributing to the organic contaminant concentrations of the surrounding groundwater.
Nitrate (NO3): Figure 5 shows the NO3 concentrations of the dumpsite leachate and groundwater samples as well as the FMEnv and WHO permissible limits for drinking water. Moderately high concentration of NO3 was observed in the leachate. On the contrary, the concentrations of NO3 in the groundwater samples were generally low and below the WHO and FMEnv standards for drinking water, indicating that the groundwater may not pose any danger to human health. As can be seen from the Figure 5, the concentration of NO3 decreased with increasing distance from the dumpsite, indicating that the presence of NO3 in the groundwater can be attributed to leachate migration from the dumpsite to the surrounding groundwater.
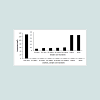
Ammonium ( 4 NH+ ): The concentrations of 4 NH+ in the dumpsite leachate and groundwater samples as well as the FMEnv and WHO permissible limits for drinking water are presented in Figure 6. A high concentration of 4 NH+ , 264 times higher than FMEnv and WHO standards (0.5 mg/l), was observed in the leachate. In contrast, the concentrations of 4 NH+ in the groundwater samples were 5-8.3 times lower than the FMEnv and WHO standards. This implies that the groundwater around the dumpsite is not polluted with 4 NH+ . As can be seen from the figure, the groundwater samples closer to the dumpsite had lower 4 NH+ concentrations than those farther away from the dumpsite. This suggests that the insignificant concentration of 4 NH+ found in the groundwater may not have originated from the dumpsite leachate but from another anthropogenic or natural source.
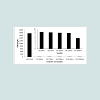
Total hardness (TH): Figure 7 presents the TH of the dumpsite leachate and groundwater samples as well as standards for drinking water. The TH of the leachate (1608 mg/l) clearly shows that the leachate is hard. The concentrations of TH in the groundwater samples ranged from 6 mg/l to 15 mg/l and are well below the WHO (120 mg/l) and FMEnv (100 mg/l) permissible limits. The concentration of TH decreased with increasing distance, implying that the slight TH of the groundwater could be ascribed to the dumpsite leachate migration. On the other hand, the TH concentration in the Control (6.0 mg/l) can be attributed to the fact that, Mg2 +, Ca2+ and HCO3- are often present at a significant concentration in natural sub-surface waters [23,24].
Heavy metals
Effects of Open Dumpsite Leachate on Groundwater Quality: a Case Study of Alakahia Dumpsite in Port Harcourt, Nigeria
Ejikeme Ugwoha*and Kewve Christabel Emete
- Department of Environmental Engineering, University of Port Harcourt, P.M.B. 5323, Nigeria
*Address for Correspondence: Ejikeme Ugwoha, Department of Environmental Engineering, University of Port Harcourt, P.M.B. 5323, Nigeria, Tel: 080 31181050; E-mail: ugwohaej@yahoo.com
Citation: Ugwoha E, Emete KC. Effects of Open Dumpsite Leachate on Groundwater Quality: a Case Study of Alakahia Dumpsite in Port Harcourt, Nigeria. J Environ Stud. 2015;1(1): 8.
Copyright © 2015 Ugwoha E, et al. This is an open access article distributed under the Creative Commons Attribution License, which permits unrestricted use, distribution, and reproduction in any medium, provided the original work is properly cited.
Journal of Environmental Studies | ISSN: 2471-4879 | Volume: 1, Issue: 1
Submission: 14 September 2015 | Accepted: 28 October 2015 | Published: 05 November 2015
Abstract
The effects of dumpsite on groundwater quality were assessed. Dumpsite leachate and groundwater samples were obtained and analysed for the following physico-chemical parameters and heavy metals: pH, Total Dissolved Solids (TDS), Chemical Oxygen Demand (COD), Nitrate (NO3), Ammonium (NH4+), Total Hardness (TH), Copper (Cu), Cadmium (Cd) and Iron (Fe). The results obtained were compared with the World Health Organisation and Federal Ministry of Environment Standards for drinking water. The concentrations of the analysed parameters for the dumpsite leachate were generally well above the Standards, indicating that the leachate could contaminate groundwater. For the groundwater samples, the pH and Cd did not meet the required standards. The pH values ranged 4.19 - 6.14, implying that the groundwater in the study area is acidic. The Cd values were < 0.05 mg/l. The COD values ranged 5.38 - 8.60 mg/l. Although the concentrations of TDS, NO3, NH4+, TH, Cu and Fe were below the standards, the computed Water Quality Index (>752 for all groundwater samples) indicates that the groundwater around the dumpsite is unsuitable for drinking. The similar WQIs for all the groundwater samples suggest that the dumpsite had negligible impact on the quality of the groundwater. Furthermore, a strong positive correlation (> +0.65) was observed for most of the analysed parameters (TDS, COD, NO3, TH, Cu and Fe), indicating that they probably have common source. Generally, the concentrations of the analysed parameters decreased with increasing distance from the dumpsite, indicating that the groundwater sources closer to the dumpsite are at higher risk of getting contaminated than those farther away from the dumpsite.Keywords
Dumpsite; Leachate; Groundwater; Contamination; Water qualityIntroduction
Open dumps have been identified as one of the major threats to groundwater sources [1-5]. Open dumping system of waste disposal is the most common method of waste disposal in Nigeria. It is a kind of system where waste is disposed of by infilling depression on land which may include valleys and excavations, without the consideration of the composition of the waste [6]. Waste disposed in an open dumpsite can be subjected to infiltration from precipitation. As water percolates through the waste, it picks up a variety of organic and inorganic compounds flowing out of the waste and accumulates at the bottom of the dumpsite [7]. The resulting contaminated water termed leachate can migrate through the soil and eventually contaminate the groundwater if not adequately managed [8]. Such contamination of groundwater resources can pose substantial health risks, including water borne diseases such as typhoid, cholera and infectious dysentery, to the local groundwater users. According to Mor et al. areas near dumpsites have greater possibilities of groundwater contamination because of the pollution potential of the leachate that originates from such dumpsites [9].In recent times, a number of studies have been conducted on the impact of dumpsite leachate on surface water and groundwater [1,3,4,8-19]. In those studies, many approaches including experimental determination of impurities and mathematical models have been used to access the level of contamination of groundwater in many parts of the world. However, no study has been done on Alakahia town in Port Harcourt, Nigeria. Considering that Alakahia is developing rapidly due to the presence of University of Port Harcourt, and that the residents depend solely on groundwater for drinking water, it becomes expedient to ascertain if the leachate from the dumpsite in Alakahia has affected the quality of the underlying groundwater.
Port Harcourt is an industrial and highly populated city located in the Niger Delta region lying along the Bonny River (an eastern distributary of the Niger River), 41 miles (66 km) upstream from the Gulf of Guinea. The city has the problems of urban migration and resource limitations. The siting and development of residential quarters near waste sites are common due to shortage of building land to cope with the increasing rate of migration and consequent population explosion [8]. The city relies on boreholes (water wells) as sources of drinking water hence poor drinking water quality may have health consequences. The uncontrolled citing of boreholes as the source of potable water in Port Harcourt as the government apparently no longer provides the populace with water has become a serious challenge due to poor waste disposal and management practices. The challenge is worsened by the fact that there are inadequately trained waste disposal personnel and equipment, poor waste collection, sorting and disposal methods, and indiscriminate location of disposal sites without regards to the local geology and hydrogeology of the area [4]. As a result of the imminent impact of waste dumpsites, it has become necessary to investigate the potential for the contamination of groundwater around a municipal waste dumpsite.
In this study, the quality of groundwater around Alakahia dumpsite in Port Harcourt was assessed. The aim was to establish whether the groundwater has been contaminated by the dumpsite leachate or not. Leachate samples from the studied dumpsite, groundwater samples around the studied dumpsite, and a control sample were collected and analysed for various physico-chemical parameters and heavy metals. The analysed parameters were compared with the World Health Organisation (WHO) and Federal Ministry of Environment (FMEnv) Standards for drinking water. Also, a correlation analysis of the analysed parameters was performed, and the water quality index of the groundwater samples was calculated [20,21].
Materials and Methods
Study areaThe study area is situated between latitudes 4o 89’ and 4o 90’ N and longitudes 6o 92’ and 6o 94’ E along Port Harcourt East West Road in Obio-Akpor Local Government Area of Rivers State, Nigeria. The Alakahia dumpsite which is approximately 6,600 square meters has been in use since 1993 and contains mainly building construction and household wastes. The area is characterized by tropical monsoon climate with lengthy and heavy rainy seasons and very short dry seasons. Only the months of December and January truly qualify as dry season months. The Harmattan, which climatically influences many cities in West Africa, is less pronounced in the area. The heaviest rainfall occurs during September with an average of 367 mm of rain. December on average is the driest month of the year; with an average rainfall of 20 mm. Temperatures throughout the year in the area are relatively constant, with average temperatures typically between 25 ºC - 28 ºC. The proximity of the aquifers to the surface, flat topography, high annual rainfall, and permeable soil media contributes to insignificant runoffs in the site, and implies that the total rainfall goes into storage. This enhances decomposition activities by bacteria and fungi and leaching of contaminants into the aquifer [4].
The area is geologically composed of various Quaternary deposits that overlie the three main stratigraphic units of Benin, Agbada and Akata. The Benin Formation is the aquiferous formation in the study area and is exploited for groundwater supplies. It consists essentially of massive and highly porous sands and gravels with a few thin clay intercalations. The uppermost section is formed by the Quaternary deposits of about 40-150 m thickness that comprise of rapidly alternating sequences of sand and silt/clay [4].
Groundwater samples 1, 2, 3 and 4 were taken at 50 m, 70 m, 100 m and 210 m from the dumpsite respectively. The Control sample was collected at 500 m from the dumpsite. The collection of groundwater samples from these points was influenced by the availability of boreholes. The Leachate sample was collected from the base of the dumpsite. All samples were collected in April when the weather was moderately wet. The water table at the study area was located at an average depth of 32 m. Figure 1 shows the study area, the dumpsite and the groundwater sample points.
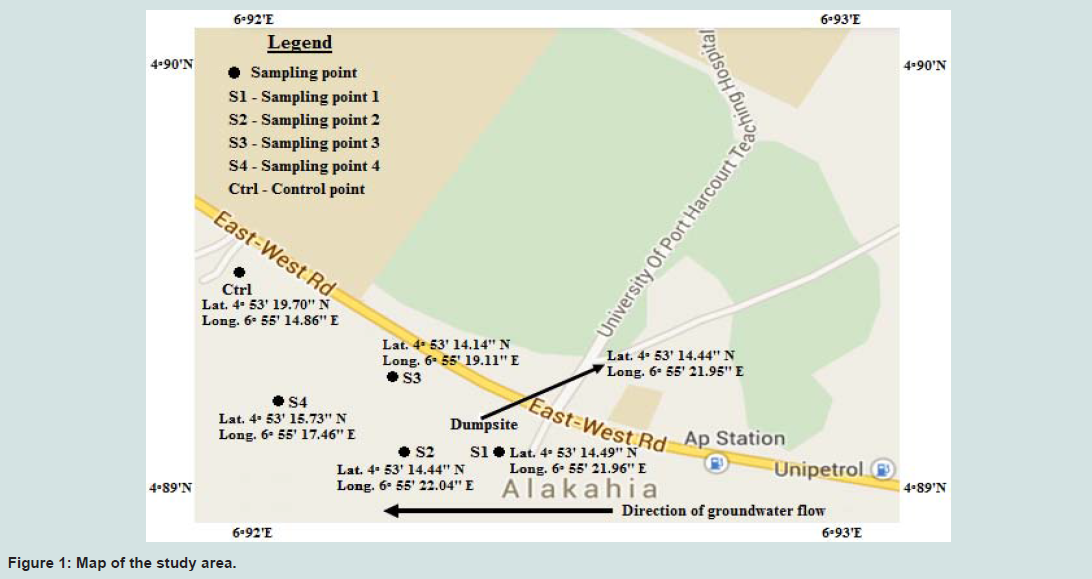
Figure 1: Map of the study area.
Groundwater samples were obtained from existing surrounding boreholes. Leachate sample was obtained from the bottom of the dumpsite. Plastic containers of 500 ml and 200 ml were used to collect the groundwater and leachate samples, respectively. Before the collection of the samples, the containers were washed with acid water in order to sterilise them, and thereafter thoroughly rinsed with distilled water. The collected samples were tightly closed and well labelled. The samples were preserved at 4 ºC and thereafter taken to the laboratory for analysis. All the samples were analysed for relevant physico-chemical parameters and heavy metals following the internationally accepted procedures, standards methods of American Public Health Association (APHA) and American Standard Testing Method (ASTM).
Sample analysis
The collected samples were analysed for physico-chemical parameters and heavy metals. The physico-chemical parameters include pH, Total Dissolved Solids (TDS), Chemical Oxygen Demand (COD), Total Hardness (TH), Nitrate and Ammonium, while the heavy metals include Copper (Cu), Cadmium (Cd) and Iron (Fe).
pH was determined using a pH meter. The pH meter was calibrated using two buffer solutions, buffer 7.0 and buffer 4.0. Thereafter, the electrodes of the meter were rinsed and dried, and pH of samples measured.
TDS was determined by Electrical conductivity method using a conductivity meter. The conductivity meter was calibrated for 25 min and then set to read in mg/l. The meter probes were immersed into a 250 ml beaker containing the sample and the TDS reading recorded.
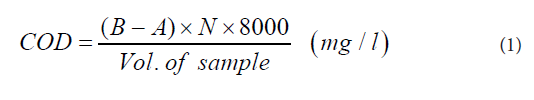
COD was determined by Open Reflux method with titration. The equipment used included heating mantle with thermostat, a reflux system, water traps, condensers, 250 ml Flat bottom flask, 250 ml Erlenmeyer flask, measuring cylinder, acid resistance gloves, retort stand and a burette. The reagents used were 0.25 N potassium dichromate solution (K2Cr2O7), 0.25 M ferrous ammonium sulphate (FAS), sulphuric reagent, ferroin indicator and distilled water. Exactly 50 ml sample was transferred into the 250 ml flat bottom flask and 25 ml 0.25 N K2Cr2O7 was added to it and swirled gently. The reflux system, water traps, condensers and the flat bottom flask were attached to the heating mantle, and 70 ml sulphuric reagent was added from the condenser through the water traps to the sample in the flat bottom flask. The heating mantle was set at a temperature of 65 ºC - 70 ºC and heated for two hours. The sample was cooled to room temperature and was titrated with 0.25 M FAS containing three drops of ferroin indicator until end point was reached and the titre value recorded. A Blank was prepared alongside the samples following the same procedure using distilled water. The COD of each sample was calculated using Eq. (1).
Where,
B = volume of FAS used for titration of blank (ml), A = volume of FAS used for titration of sample (ml), and N = normality of FAS.
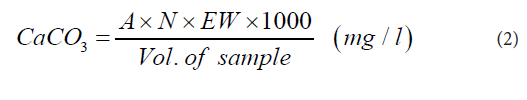
TH was determined by EDTA (di-sodium salt ethylene diaminetetracetic acid) titration method. Weighing balance, 50 ml measuring cylinder, 125 ml Erlenmeyer flask, spatula, 5 ml beaker, retort stand and a burette were the equipment used. The reagents were EDTA solution (0.01 M), 50% Hydrochloric acid (HCl) and solo chrome black-T indicator. Exactly 50 ml sample was placed in the 125 ml Erlenmeyer flask. The pH of the sample was adjusted to 7-8 with 1 ml of 50% HCl. Exactly 0.2 g solo chrome black-T indicator was added to the sample and a colour change observed. The sample was titrated with 0.01 M EDTA until an end point was reached and the titre value recorded. Hardness as CaCO3 for each sample was calculated using Eq. (2).
Where
A = volume of EDTA used for titration, N = normality of EDTA, and EW = equivalent weight of CaCO3.
Nitrate concentration was determined using the Cadmium reduction method. The equipment used included ultraviolet spectrophotometer, 25 ml cuvette, stop watch and measuring cylinder. The reagent used was Nitra-ver 5 reagent powder. Two sample cells (cuvette) were filled with 10 ml sample and distilled water, respectively. The cell containing distilled water served as the blank. Nitra-ver 5 reagent powder was added to the sample and the content vigorously shaken for 1 min and then allowed for 5 min. The blank was placed in the ultraviolet spectrophotometer until the display showed 0.00 mg/l No3 -N. Thereafter the sample was placed in the ultraviolet spectrophotometer and closed tightly until the concentration in mg/l displayed.
Ammonium concentration was determined using Colorimetric method. The equipment used includes spectrophotometer, 25 ml test tubes, stop watch and measuring cylinder. The reagents used were phenol-alcohol (10 g of phenol in 95% ethyl alcohol to a final volume of 100 ml), nitroferricyanide (1 g in deionized water to a final volume of 200 ml), alkaline complexing (100g of trisodium citrate and 5 g of sodium hydroxide in deionized water to a final volume of 500 ml), sodium hypochlorite, and oxidizing solution (100 ml alkaline solution to 25 ml sodium hypochlorite). Test tubes were filled with 10 ml sample and deionized water, respectively. The test tubes containing deionized water served as the standards. Exactly 0.4 ml phenol solution, 0.4 ml nitroferricyanide and 1ml oxidizing solution were added to all test tubes and the contents mixed very well and then allowed for 3 hours. The absorbance of standards and samples were read from the spectrophotometer set to 630 nm. The absorbance values of standards were used to generate a standard curve with which ammonium concentrations in samples were calculated.
The concentrations of the heavy metals (Cu, Cd and Fe) were analysed using the Atomic Absorption Spectroscopic method. The equipment used included 250 ml beaker, a set of computer, Atomic absorption spectrophotometer (AAS) and AAS wizard (software). The reagent used was 1:1 nitric acid to water. The reagent was added to the samples and swirled gently. The AAS nozzle was inserted in a beaker containing distilled water which served as blank. The nozzle was left in the blank for about 10 min in order to flush the burner system and Auto-zero the equipment before measurement. The nozzle was inserted in the sample for about 20-30 sec until the concentration displayed on the computer screen.
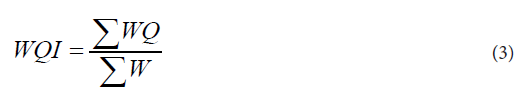
Calculation of water quality index (WQI)
The WQI, representing the overall water quality of a groundwater sample, was estimated using Eq. (3).
Where 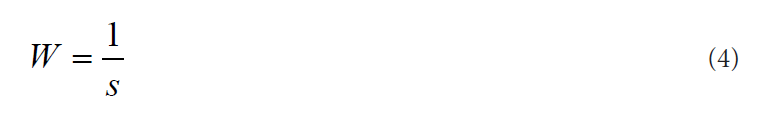
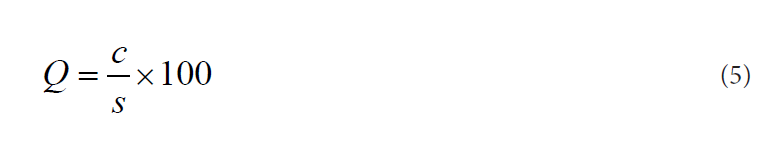
W = unit weight, and Q = quality rating scale. W and Q were calculated using Eqs. (4) and (5), respectively.
Where
s = standard values (mg/l) and c = measured concentrations (mg/l).
Results and Discussion
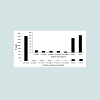
Physico-chemical parameterspH: Figure 2 shows the pH of the dumpsite leachate and groundwater samples as well as the FMEnv and WHO permissible limits of pH for drinking water. The pH of the leachate and groundwater samples were lower than the FMEnv and WHO permissible lower limit for drinking water (pH of 6.5), indicating that they are acidic. The acidity of the groundwater samples decreased with increasing distance from the dumpsite, with Sample 1 (50 m from the dumpsite) having the highest acidity (pH of 4.19) and the Control (500 m from the dumpsite) has the lowest acidity (pH of 6.14). The pH of the Control (6.14) falls within the normal pH range for groundwater (6 - 8.5), indicating that the groundwater samples closer to the dumpsite with high acidity were polluted by the dumpsite leachate which may have contained metal ions such as iron, manganese, copper, lead and zinc. One major implication of using acidic groundwater is the corrosion of plumbing materials. Another major implication is that it could cause or worsen skin irritation.
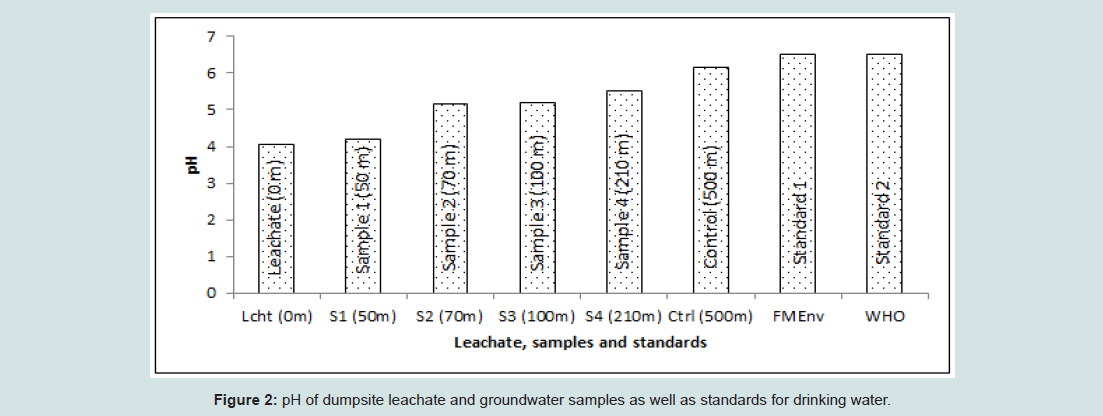
Figure 2: pH of dumpsite leachate and groundwater samples as well as standards for drinking water.
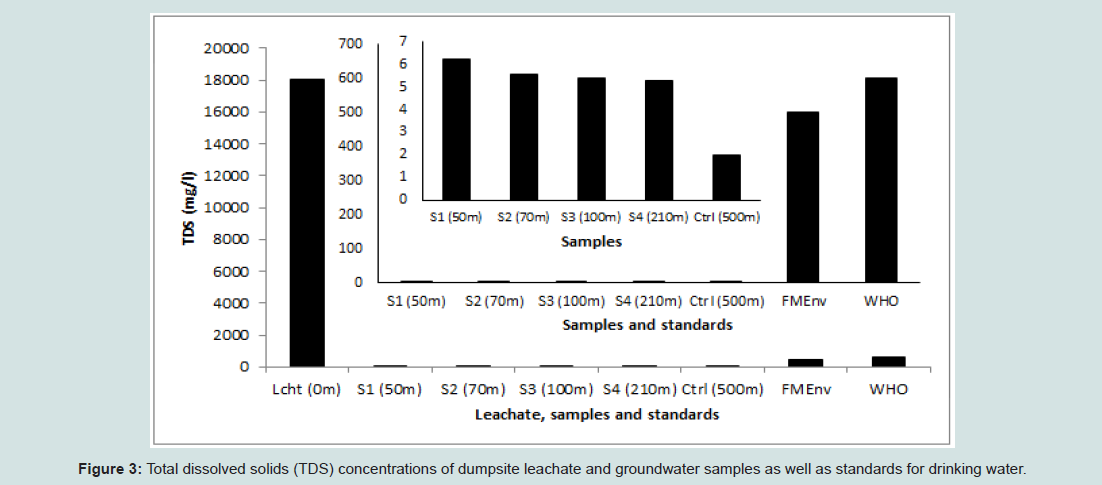
Figure 3: Total dissolved solids (TDS) concentrations of dumpsite leachate and groundwater samples as well as standards for drinking water.
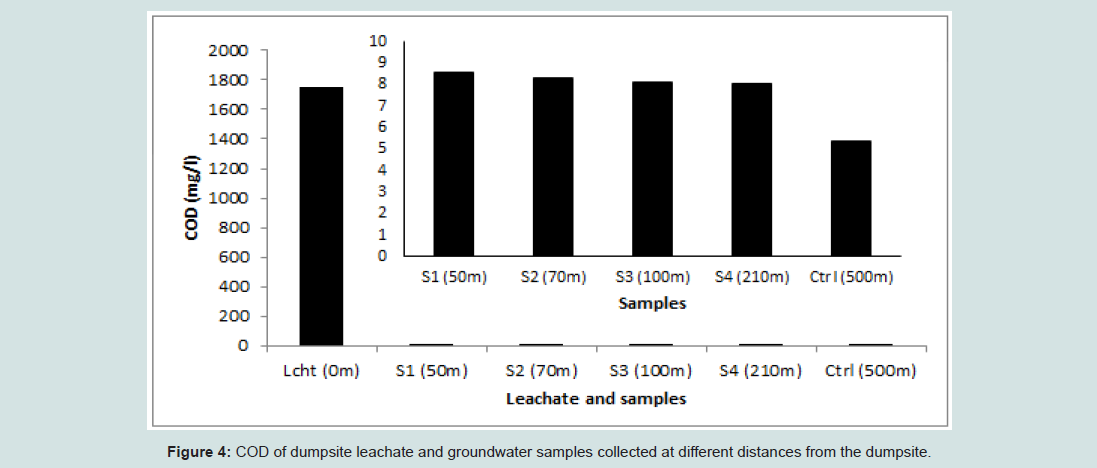
Figure 4: COD of dumpsite leachate and groundwater samples collected at different distances from the dumpsite.
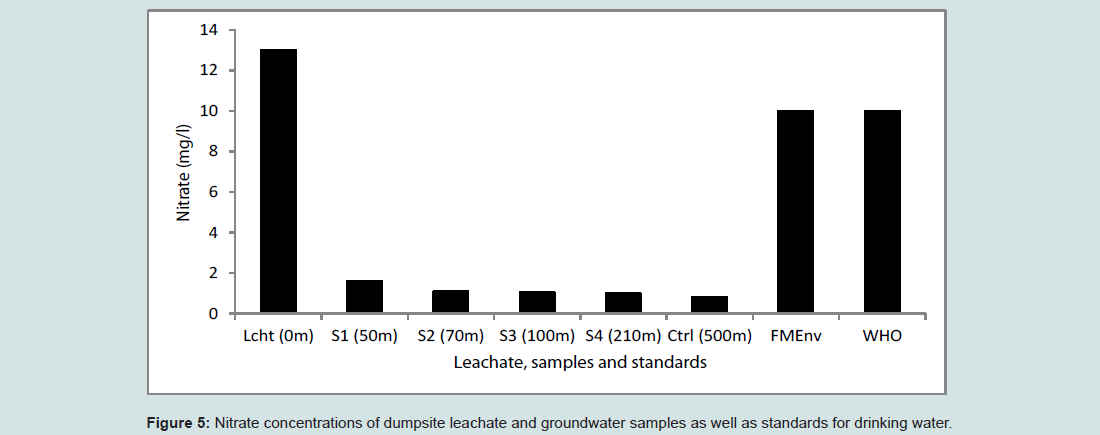
Figure 5: Nitrate concentrations of dumpsite leachate and groundwater samples as well as standards for drinking water.
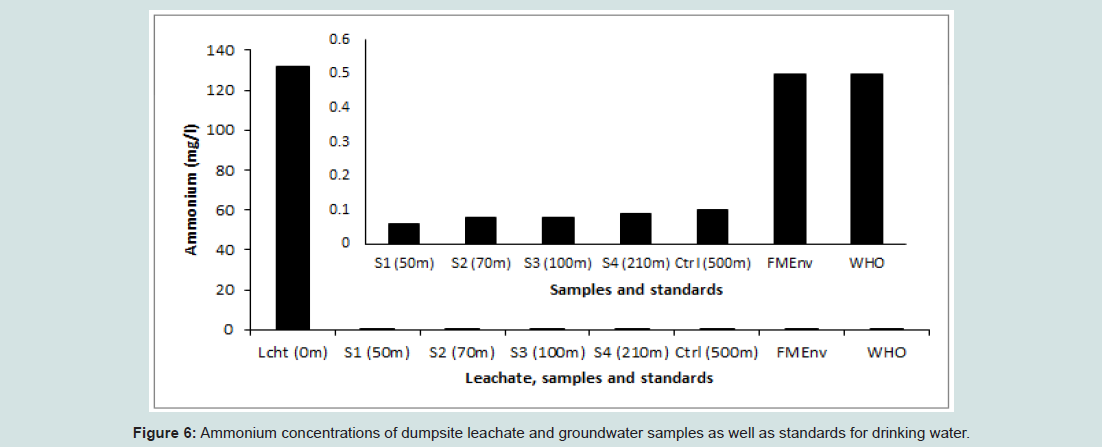
Figure 6: Ammonium concentrations of dumpsite leachate and groundwater samples as well as standards for drinking water.
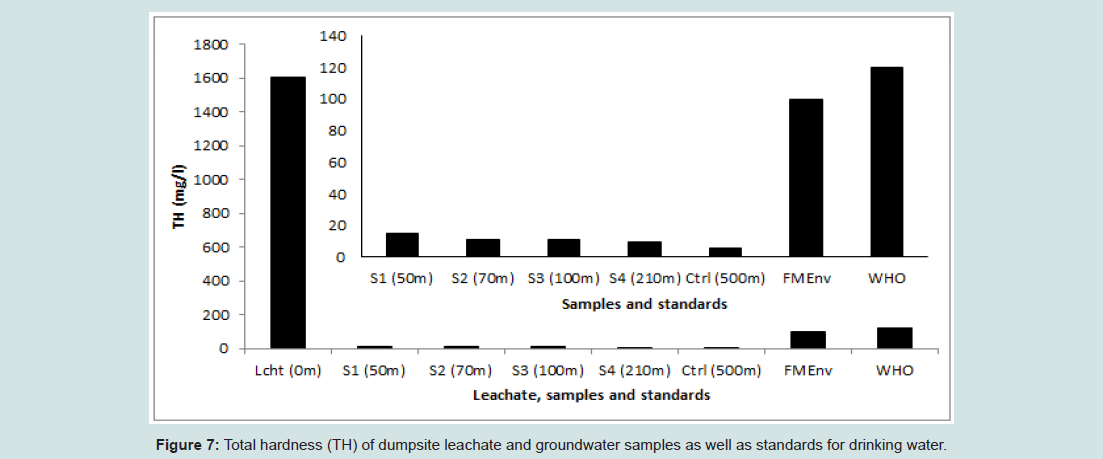
Figure 7: Total hardness (TH) of dumpsite leachate and groundwater samples as well as standards for drinking water.
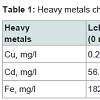
The concentrations of heavy metals in the dumpsite leachate and groundwater samples as well as WHO and FMEnv permissible limits are summarized in Table 1. The concentration of Cu in the leachate was quite low (0.28 mg/l) and below the WHO and FMEnv standards (1 mg/l). According to Mor et al. the presence of Cu in the leachate shows that various kinds of wastes including chemicals for photograph processing and pipes may have been disposed in the dumpsite [25]. The concentration of Cd in the dumpsite leachate exceeded the permissible limit as recommended by WHO and FMEnv. The high value of Cd in the leachate may be an indicator of the presence of dry cell batteries, paint cans, electronic equipment, used lubricants and ceramic waste in the dumpsite. The high level of Fe (182 mg/l) in the leachate indicates that iron and steel scraps may have been disposed in the dumpsite. For all the groundwater samples, including the control, the concentrations of heavy metals were below the WHO and FMEnv permissible limits. The observed high concentrations of Cd and Fe in the dumpsite leachate and their negligible concentrations in all the groundwater samples can be attributed to the sub-surface geology of the site which consists of clay. These metals have the affinity to be absorbed by clayey soil [25,26].
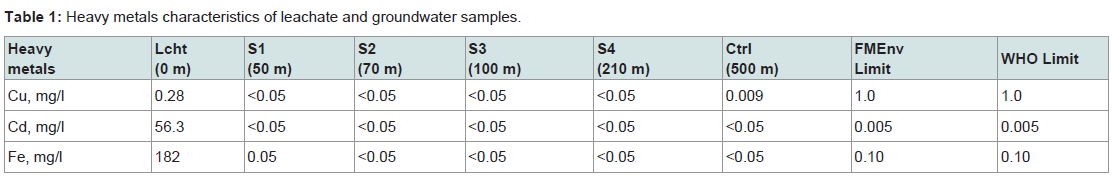
Table 1: Heavy metals characteristics of leachate and groundwater samples.
Water Quality Index (WQI)
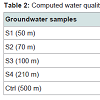
Table 2 summarizes the computed WQI of the collected groundwater samples. WQI was calculated in order to know the quality of each groundwater sample. Similar WQIs were calculated for all the groundwater samples. The calculated WQIs were compared with the WQI-based water quality classification and found to fall within the category ‘unsuitable’ for drinking class. The similar WQI for all the groundwater samples indicates that the dumpsite leachate had negligible impact on the quality of the groundwater.
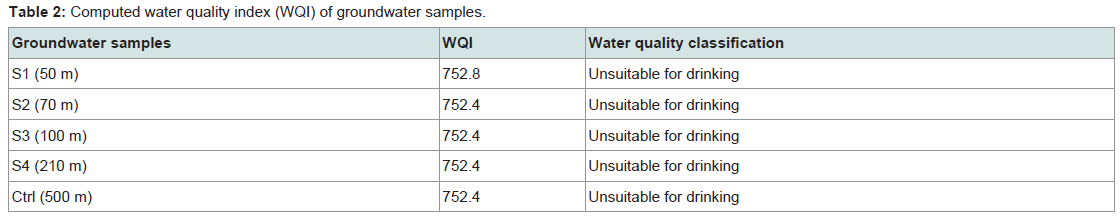
Table 2: Computed water quality index (WQI) of groundwater samples.
Correlation analysis
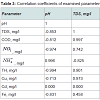
Table 3 displays the result of the correlation analysis of the examined groundwater parameters. This analysis was carried out in order to know the relationships that exist between the different parameters. The result obtained shows that positive, negative and zero correlations exist between the examined parameters. Statistically, a high positive correlation (> +0.65) indicates that a change in one parameter will cause a similar change in the other parameter. A high negative correlation (< -0.65) indicates that a change in one parameter will cause a change in the other parameter but in the opposite direction. And a zero correlation suggests no relationship between the two parameters i.e. change in one parameter will not affect the other parameter. Consequently, an increase in pH will cause an increase in 4 NH+ but decrease in TDS, COD, NO3, TH, Cu and Fe, and vice versa. No correlation was found between Cd and the other parameters i.e. increase in Cd will have no effect on any of the parameters. This suggests that (pH and 4 NH+ ), (TDS, COD, NO3, TH, Cu and Fe) and (Cd) respectively have common source.
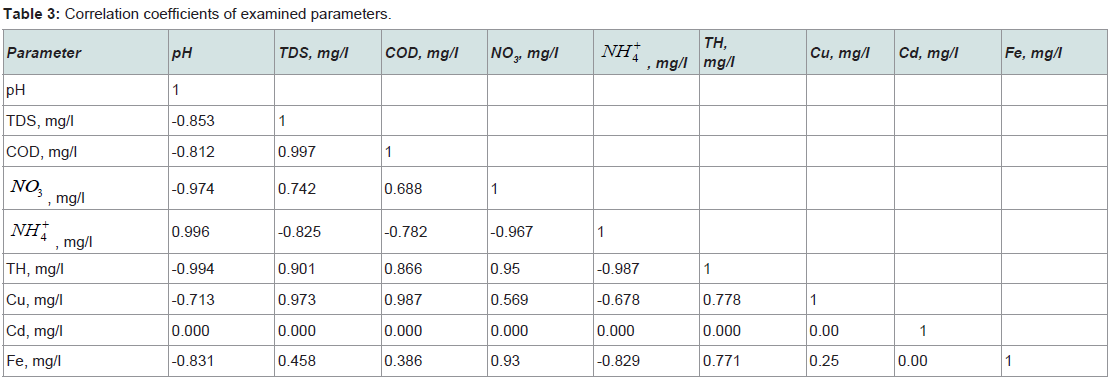
Table 3: Correlation coefficients of examined parameters.
Conclusions
The effect of open dumpsite on groundwater quality has been examined using Alakahia dumpsite as a case study. The results obtained for the dumpsite leachate and groundwater samples were compared with the World Health Organisation and Federal Ministry of Environment Standards for drinking water. The physico-chemical parameters and heavy metal concentrations for the dumpsite leachate were generally well above the Standards, indicating that the leachate could contaminate groundwater. The pH and Cd of the groundwater samples did not meet the required standards. The pH values ranged from 4.19 - 6.14, implying that the groundwater in the study area is acidic. The Cd values were < 0.05 mg/l. The COD values ranged 5.38 - 8.60 mg/l. Although the concentrations of TDS, NO3, NH4 +, TH, Cu and Fe were below the standards, the computed Water Quality Index (>752 for all samples) indicates that the groundwater around the dumpsite is unsuitable for drinking. The similar WQIs for all the groundwater samples suggest that the dumpsite leachate had negligible impact on the quality of the groundwater. Most of the parameters analysed (TDS, COD, NO3, TH, Cu and Fe) maintained strong positive correlation (> +0.65), showing that they probably have common source. Generally, the concentrations of the analysed parameters decreased with increasing distance from the dumpsite, indicating that the groundwater sources closer to the dumpsite are at higher risk of getting contaminated than those farther away from the dumpsite.Acknowledgement
The Authors wish to thank the University of Port Harcourt for providing the laboratory where the research was carried out.References
- Fatta D, Papadopoulos A, Loizidou M (1999) A study on the landfill leachate and its impact on the groundwater quality of the greater area. Environ Geochem Health 21: 175-190.
- Abdus-Salam N, Ibrahim MS, Fatoyinbo FT (2011) Dumpsites in Lokoja, Nigeria: A silent pollution zone for underground water. Waste Manag Bioresour Technol 1: 21-30.
- Bayode S, Olorunfemi MO, Ojo JS (2012) Assessment of impact of some waste dumpsites on the groundwater quality in parts of Akure Metropolis, Southwestern Nigeria. Pacific J Sci Technol 13: 528-536.
- Ekeocha NE, Okereke ID, Okonkwo SE (2012) Electrical resistivity investigation of solid waste dumpsite at Rumuekpolu in Obio Akpor L.G.A., Rivers State, Nigeria. Int J Sci Technol 1: 631-637.
- Charles OA, Olabanji OA, Abimbola AJ, Olamide AO (2013) Assessing the effect of a dumpsite on groundwater quality: a case study of Aduramigba estate within Osogbo metropolis. J Environ Earth Sci 3: 120-130.
- Chopra AK, Pathak C, Prasad G (2009) Scenario of heavy metal contamination in agricultural soil and its management. J Appl Nat Sci 1: 99-108.
- Aderemi AO, Oriaku AV, Adewumi GA, Otitoloju AA (2011) Assessment of groundwater contamination by leachate near a municipal solid waste landfill. Afr J Environ Sci Technol 5: 933-940.
- Ikem A, Osibanjo O, Sridhar MK, Sobande A (2002) Evaluation of groundwater quality characteristics near two waste sites in Ibadan and Lagos, Nigeria. Water Air Soil Pollut 140: 307-333.
- Mor S, Ravindra K, De Vischher A, Dahiya RP, Chandra A (2006) Municipal solid waste characterisation and its assessment for potential methane generation: a case study. Sci Total Environ 371: 1-10.
- McBean EA, Rovers FA, Farquhar GJ (1995) Solid waste landfill engineering and design. Prentice Hall PTR.
- Abu-Rukah Y, Al-Kofahi O (2001) The assessment of the effect of landfill leachate on ground-water quality-a case study. El-Akader landfill site-north Jordan. J Arid Environ 49: 615-630.
- Christensen TH, Kjeldsen P, Bjerg PL, Jensen DL, Christensen JB, et al. (2001) Biogeochemistry of landfill leachate plumes. App Geochem 16: 659-718.
- Jagloo K (2002) Groundwater risk analysis in the vicinity of a landfill: a case study in Mauritius. Royal Institute of Technology.
- Majolagbe AO, Kasali AA, Ghaniyu LO (2011) Quality assessment of groundwater in the vicinity of dumpsites in Ifo and Lagos, Southwestern Nigeria. Adv Appl Sci Res 2: 289-298.
- Oyelami AC, Aladejana JA, Agbede OO (2013) Assessment of the impact of open waste dumpsites on groundwater quality: a case study of the Onibu-Eja dumpsite, Southwestern Nigeria. Procedia Earth Planetary Sci 7: 648-651.
- Adeyi AA, Majolagbe AO (2014) Assessment of groundwater quality around two major active dumpsites in Lagos, Nigeria. Global J Sci Frontier Res 14.
- Badmus BS, Ozebo VC, Idowu OA, Ganiyu SA, Olurin OT (2014) Groundwater assessment of hand dug wells around open landfill in Ibadan Metropolis for domestic and irrigation purposes. J Water Resour Prot 6: 1412-1424.
- Bashir I, Udiba U, Hamza A, Garko BI, Fagge KA, et al. (2014) Impact of Gyadi-Gyadi solid waste dumping site on the quality of groundwater of the neighbouring environment. Int J Sci Technol Res 3: 106-108.
- Salami L, Fadayini MO, Madu C (2014) Assessment of a closed dumpsite and its impact on surface and groundwater integrity: a case of Oke Afa dumpsite, Lagos, Nigeria. Int J Res Rev Appl Sci 18: 222-230.
- WHO (1996) Health criteria and other supporting information. In: Guidelines for drinking-water quality, (2nd edn), World Health Organization, Geneva, 2: 940-949.
- WHO (2004) Trihalomethanes in Drinking Water: background document for development of WHO guidelines for drinking-water quality. World Health Organization.
- Tatsi AA, Zouboulis AI (2002) A field investigation of the quantity and quality of leachate from a municipal solid waste landfill in a Mediterranean climate (Thessaloniki, Greece). Adv Environ Res 6: 207-219.
- Punmia BC, Jain AK, Jain AK (1995) Water supply engineering. (2nd edn), Laxmi Publication (P) Ltd., New Delhi.
- Kiely G (2007) Environmental engineering. Tata McGraw Hill Publishing Company Limited, New Delhi.
- Mor S, Ravindra K, Dahiya RP, Chandra A (2006) Leachate characterisation and assessment of groundwater pollution near municipal solid waste landfill site. Environ Monitor Asses 118: 435-456.
- Longe EO, Enekwechi LO (2007) Investigation of potential groundwater impacts and influence of local hydrogeology on natural attenuation of leachate at a municipal landfill. Int J Environ Sci Technol 4: 133-140.