Abstract
In this report, we present a novel histone deacetylase inhibitor (HDACi) (N-Hydroxy-6-(5-nitro-naphtalimide)-hexanamide: ES8) that efficiently inhibits angiogenesis in relevant ex vivo models (Human umbilical vein endothelial cells (HUVEC), 3D aortic ring assay) and in vivo (chick chorioallantoic membrane (CAM), Zebrafish). Transcriptomic profiling reveals a set of ES8 specific genes that are not affected by the prototypical HDACi suberoylanilide hydroxamic acid (SAHA). Finally, ES8 also reduced tumor growth in mouse models of small cell lung cancer. Availability of a novel compound not centered exclusively on inhibition of angiogenic factors and inducing a characteristic transcription profile may be of interest to overcome resistance to currently used chemotherapies.
Keywords
Lysine acetylation; Cytosine methylation; Angiogenesis inhibitor
Introduction
Angiogenesis is the formation of new blood vessels from preexisting vessels either by sprouting (sprouting angiogenesis) or splitting (intussusceptions) [
1]. This growth of new capillary blood vessels is needed mainly for embryonic development but also contributes to organ growth after birth. Although most blood vessels remain quiescent during adulthood, angiogenesis occurs in the cycling ovary and in the placenta during pregnancy [
2]. The complex and highly orchestrated process of angiogenesis is regulated by producing a finely tuned balance of stimulatory and inhibitory factors [
3]. Unregulated angiogenesis may result in different pathologies including cancer. Although angiogenesis does not initiate malignancy, it has the potential to promote tumor growth and metastasis [
4]. Consistently, targeting angiogenesis has therapeutic value and may even offer several advantages. First, unlike tumor cells, endothelial cells (ECs) are genomically stable, homogenous and could be ideal therapeutic targets that would not become resistant to anti-angiogenic therapy [
5]. Second, turnover of tumor ECs is up to 50 times higher than that of endothelium in normal quiescent tissues [
6]. Third, since anti-angiogenic therapy is directed at activated ECs, target would be easily accessible by systemic administration [
6]. However, different mechanisms of acquired resistance to anti-angiogenic agents (e.g. VEGF antagonists) have been reported more recently.
Emerging evidence indicates that using a single angiogenesis inhibitor may not suffice to combat the myriad of angiogenic factors produced by cancer cells [
7]. Furthermore, inhibition of a single target leads to up regulation of additional angiogenic factors [
8]. Therefore,it has become paramount challenge for antiangiogenic therapy to design combination protocols that can counteract the diverse angiogenic stimuli produced by the tumor and its microenvironment. In this perspective, addition of antiangiogenic agents to conventional therapeutic strategies, e.g., chemotherapy [
9,10], radiation [
11,12] or other tumor-targeting agents [
13] is expected to increase clinical efficacy [
14]. Thus, although the combination therapy and overcoming resistance to anti-angiogenic agents are distinct issues, both mechanisms are related. Besides anti-angiogenic agents, epigenetic modulators offer an alternative promising approach for modulation of angiogenesis and improve therapy outcome. By targeting multiple genes and pathways in ECs, epigenetic agents indeed decrease the development of resistance to current chemo- and angiostatic therapies [
15]. Instead of a direct targeting of angiogenic factors, epigenetic modulators affect angiogenesis through regulation of gene expression at the epigenetic level.
Post-translational histone modifications and DNA methylation are two essential mechanisms of epigenetic regulation of gene expression [
16]. Histone deacetylase inhibitors (HDACi) directly inhibit ECs growth and tumor angiogenesis by modifying the balance between pro- and anti-angiogenic factors [
15,
17-20]. Despite widespread distribution of histone deacetylases (HDACs) in chromatin, expression profiling studies has shown that HDACi alter the expression of only 2-10% of genes in cultured transformed cells [
21-23]. Importantly, recent evidence suggests that closely related inhibitors yield very characteristic transcription profiles [
24]. This pattern may be of particular interest for designing optimal combinations in terms of synergism or toxicity in therapeutictreatments. In this study, we present a novel hydroxamic acid based HDACi that potently inhibits angiogenesis and that induces a unique transcriptional profile not shared by two other reference inhibitors.
Materials and Methods
Cells and reagents
Human umbilical vein endothelial cells (HUVEC) purchased from Lonza were cultured in EBM-2 medium supplemented with 2% fetal bovine serum (FBS), 0.04% hydrocortisone, 0.4% human fibroblast growth factor-basic (hFGF-B), 0.1% vascular endothelial growth factor (VEGF), 0.1% revitropin IGF-1 long R3 (R3-IGF-1), 0.1% ascorbic acid, human epidermal growth factor (hEGF), 0.1% gentamicin and amphotericin-B (GA-1000) and 0.1% heparin. For all experimental purposes, cells were grown to less than 5 passages. Suberoylanilide hydroxamic acid (SAHA) (Merck), 5-Aza-2′-deoxycytidine (DAC) (Sigma-Aldrich) and ES8 (N-Hydroxy-6-(5-nitro-naphtalimide)-hexanamide) [
25] were dissolved in 0.1% of dimethyl sulfoxide. Small cell lung cancer (SCLC) cell lines N417, H69 and H146 were cultured in RPMI 1640 medium supplemented with 10% (5% for BKT) fetal calf serum (FCS), 2 mM L-glutamine, 100 U/ml of penicillin and 1001 g/ml of streptomycin and maintained at 37 °C in a humidified atmosphere with 5% CO
2.
Cell viability
Cell viability was assessed using the CellTiter 96 AQueous One Solution Cell Proliferation Assay (Promega) containing the tetrazolium compound MTS [3-(4,5-dimethylthiazol-2-yl)-5-(3-carboxymethoxyphenyl)-2-(4 sulfophenyl)-2H-tetrazolium, innersalt]. HUVEC (104 cells per well) were seeded into 96-well micro titer plates and incubated in EGM-2 culture medium (100 μL) containing serial dilutions of ES8. After 48 hours, 20 μL MTS reagent was added and the plate was incubated for 1 hr at 37 ºC. Reduction of MTS into a colored formazan product was measured by the absorbance at 490 nm using a Wallac 1420 victor2 multiwell reader (Perkin Elmer). After subtracting background absorbance, results were expressed as percentage of control (0.1% DMSO).
Apoptosis assay
Apoptotic cells were labeled with the PE Annexin V Apoptosis Detection Kit I (BD Pharmingen™) following the manufacturer’s instructions. A total of ten thousand events were collected by flow cytometry (FACSCanto II, BD Biosciences). Results are represented in percentages of early (Annexin V positive and 7-AAD negative) and late (Annexin V positive and 7-AAD positive) apoptotic cells.
Cell migration assay
Migration of HUVEC was determined after 48 h of culture using the scratch-wound assay. Confluent monolayers (105 cells per well in 48-well plates) were scratched with a sterile plastic pipette tip to strip off cells. After washing with PBS, cells were cultivated in supplemented EBM-2 medium in the absence or presence of inhibitor. The size of the gap was determined at time zero (0 h) and set to 100%. The distance between the two sides of the wound was measured after 4 h and 8 h of incubation using a graduated ocular lens coupled with an Olympus CKX41 microscope (Olympus) at a 4-fold magnification. The rate of cell migration was calculated by measuring the difference between wound width at 0 h and 4 h or 8 h in distinct border zones.
Endothelial cell capillary-like network formation
HUVEC (250 μL, 4x10⁴ cells per well) were seeded in a 48-well plate pre-coated with 125 μL Matrigel (BD Biosciences) per well. The cells were incubated in supplemented EBM-2 medium with or without the inhibitor for 16 h at 37 ºC and fixed with 4% para-formaldehyde. Phase contrast images were taken with a Nikon microscope (NikonEclipse 90i) equipped with a digital camera (Nikon Digital Camera DXM1200C). The total tubule length (μm) was quantified with the Image J software in five different fields for each condition and averaged from three independent experiments. Tube formation was also visualized by confocal microscopy (Olympus) at a magnification of 10X on cells stained with 8 μM Calcein AM (Sigma-Aldrich) for 30 min.
Aortic ring assay
Aortic explants were cultured in three-dimensional matrix gels according to the procedure previously described [
26]. Thoracic aortas removed from 8 to 12 week old female Fisher-344 rats were immediately transferred to a culture dish containing cold serum-free complete DMEM (DMEM, 1% glutamine, 100 units/ml penicillin and 100 μg/ml streptomycin from Life Technologies). The peri-aortic fibro adipose tissue was carefully removed with fine micro dissecting forceps and iridectomy scissors paying special attention not to damage the aortic wall. Aortic rings (1 mm-long) were sectioned and extensively rinsed in consecutive washes of complete DMEM medium. Ring-shaped explants of rat aorta were then embedded in gels of rat tail interstitial collagen as previously described [
26]. The collagen gel cultures [7.5 volumes of collagen (2 mg/ml) (Collagen R, Serva) with one volume of 10 X DMEM, 1.5 volumes of NaHCO
3 (15.6 mg/ml) and approximately 0.1 volume NaOH (1 M) to adjust the pH to 7.4] were first prepared in cylindrical agarose wells [
27] and kept in triplicates at 37 ºC in 60 mm diameter Petri dishes (Bacteriological polystyrene, Falcon, Becton Dickinson). Each dish contained 6 ml of complete MCDB131 [MCDB131 (Life Technologies) supplemented with 25 mM NaHCO
3, 1% glutamine, 100 units/ml penicillin, and 100 μg/ml streptomycin] and different concentrations of the ES8. The cultures were kept at 37 ºC in a humidified environment for 1 week and examined every other day by phase contrast microscopy with an Olympus microscope at an appropriate magnification. Computer assisted quantification of the total number of intersections of micro vessels in function to the distance to the aortic ring was performed as described previously [
26].
Chick chorioallantoic membrane (CAM) ex ovo assay
A circular window (10-15 mm in diameter) was cut into the air pocket of fertilized chicken eggs at 3.5 days of development. The embryos were collected and maintained on plastic weight boats covered with square Petri dishes in an incubator at 38 °C with 80% of humidity for 5 days. Then, up to six plastic rings were placed on the surface of the CAM and from day 8 to 11, inhibitors and control solvents (0.1% DMSO) were added daily inside the rings. Photographs of at least 10 CAMs per experimental condition were taken using a stereomicroscope (Leica) at a magnification of 20X. Computerassisted quantification of vascularization considering vessel-length,-number and -branching per unit area was performed as previously described [
28].
Zebrafish model
Zebrafish (
Danio rerio) EGFP transgenic embryos [TG (flk1:EGFP) s843] were collected in 24-well plates and soaked in a solution of 0.57 mM NaCl, 0.17 mM KCl, 0.32 mM CaCl
2, 0.33 mM MgSO
4, 0.0001% methylene blue (so called embryo water). Embryos were raised at 28 ºC under standard laboratory conditions and staged as described [
29]. At 24 h post-fertilization, embryos were manually dechorionated with forceps and the embryo water was replaced every day with fresh compound supplemented with 0,197 mM 1-phenyl-2-thiourea (PTU) to inhibit pigment formation [
30]. This treatment regimen did not have a significant effect on vascular development. Embryos (n=15 per condition) treated for 7 days with the different concentrations of inhibitor or control solvent (0.1% DMSO) were analyzed daily with a Nikon fluorescent microscope (Nikon Eclipse 90i) equipped with a digital camera (Nikon Digital Camera DXM1200C). Blood flow in dorsal aorta (DA), in posterior cardinal vein (PCV) as well as in intersegmental vessels (ISVs) was recorded. The number of embryos with ISV defects versus control was determined. Embryos were fixed in 2% paraformaldeyde with 0.1 M PIPES, 1 mM MgSO
4 and 2 mM EGTA overnight at 4 ºC. After washing thrice with PBSTr 0.3 (PBS with 0.3% Triton X-100) and once with milli Q water, the embryos were permeabilized in acetone at -20 ºC for 12 min after two washes with PBSTr 0.3, a portion of the yolk-sac was then taken off to facilitate the entry of the antibody. After two additional washes with PBSTr 0.3 and blocking for 2 h at room temperature with PBSTr 0.3 containing BSA 4%, embryos were incubated with anti-GFP chicken polyclonal primary antibody (1:200; Aves labs Inc) at 4 ºC overnight. After three washes with PBSTr 0.3 during 30 min and blocking for 1 h at room temperature with PBSTr 0.3 supplemented with BSA 4%, Embryos were stained with Alexa fluor 488 goat anti-chicken secondary antibodies (1:500, Invitrogen) overnight at 4 ºC. After three washes with PBSTr 0.3 for 30 min, embryos were mounted with Vectashield mounting medium (Vector Laboratories) and analyzed with an Olympus Fluoview FV1000 laser scanning confocal microscope.
Protein extraction and western immunoblotting
HUVEC (3x10⁵ cells) were disrupted with lysis buffer (50 mM Tris-HCl pH 7.5, 1 M NaCl, 1% NP-40, 0.5% sodium deoxycholate, 0.1% SDS) supplemented with a mixture of protease inhibitors (Complete, Roche Diagnostics). After 15 min of shaking at 4 ºC, cell lysates were briefly sonicated on ice, collected in receiver columns (20 μm; Macherey-Nagel) and centrifuged 2 min at 13000 g. Proteins were recovered in salt-free lysis buffer (50 mM Tris-HCl pH 7.5, 1% NP-40, 0.5% sodium deoxycholate, 0.1% SDS) to dilute the NaCl content before processing. Protein concentration was determined by using BCA Protein Assay Kit (Thermo Scientific) according to the manufacturer’s protocol. Equivalent amounts of proteins (10 μg) were size fractionated by SDS-PAGE (15%) in reducing condition (2% β-mercaptoethanol). Proteins on the gels were transferred onto nitrocellulose membranes (Whatman Protran nitrocellulose membrane, 0.45 μm; Sigma-Aldrich) and blocked with BSA 5% in PBS. The membranes were incubated with anti-acetyl-histone H3 rabbit polyclonal primary antibody (1:1000; Millipore) or anti-actin N-terminal rabbit primary antibody (1:1000; Sigma) at 4 °C overnight with rocking. After washing three times with PBS-0.05% Tween 20, membranes were incubated with a polyclonal swine anti-rabbit immunoglobulins/HRP secondary antibody (1:10000; Dako) diluted in PBS-3% BSA at room temperature for 1 h. After three washes with PBS-0.05% Tween 20 during 15 min, labelled proteins were revealed using a chemiluminescent detection system (Pierce ECL Western Blotting Substrate; Thermo Scientific). Images were acquired through an imaging device equipped with a camera (Image Quant LAS 4000; GE Healthcare). Fluorescence intensity per mm² was quantified with the Quantity One 1-D Analysis Software (BioRad Laboratories). Actin was used as internal control for loading normalization. The results are represented as normalized densities versus solvent control (0.1% DMSO).
Confocal microscopy
HUVEC (4x10⁴ cells per well) were cultivated for 48 h onto coverslips in presence of different concentrations of ES8. Cells were washed with PBS and fixed in 4% paraformaldehyde for 20 min. HUVEC were then permeabilized with 0.3% Triton X -100 BSA 1% for 45 min and incubated for 1 hr with anti-acetyl-histone H3 rabbit polyclonal primary antibody (1:300; Millipore) at room temperature. After three washes with PBS, coverslips were incubated with Alexafluor 488 goat anti-rabbit secondary antibodies (1:600, Invitrogen) and mounted in Vectashield medium containing DAPI (Vector Laboratories). Z-stack images were acquired at a magnification of 63X with a laser scanning confocal microscope (Olympus Fluoview 1000). Fluorescence intensities were quantified as follows. First, blue fluorescence images in which nuclei appear very well contrasted were first binarized using an appropriate threshold (pixels belonging to cells have a value equal to 1 whereas pixels from the background take a value equal to 0). Pixels scoring 1 were summed up and the total area occupied by all nuclei in the image was calculated. The green fluorescence (corresponding to acetylated histone H3) values were multiplied pixel by pixel by the corresponding binarised blue fluorescent images. By this operation, background pixels on the green component image take the value 0. Thereafter, the total intensity of filtered images was straightforwardly determined by adding the green component pixels. Finally, the resulting value was divided by the total area previously calculated from the blue component images.
Microarray analyses of gene expression
Gene expression profiles were analyzed using the HumanHT-12 v3 Expression BeadChip (Illumina). HUVEC (3x10
5 cells per dish) were cultivated with subtoxic doses of inhibitors [ES8 (5 μM), SAHA (2 μM) and DAC (0.2 μM)] during 96 h, washed with PBS and lysed in RLT Plus lysis solution (400 μL per condition; Qiagen). Nucleic acid extraction and microarray hybridizations were performed by AROS Applied Biotechnology. Gene ontology was analyzed using the Ingenuity Pathway Analysis (IPA) software (Ingenuity® Systems, www.ingenuity.com). Genes involved in angiogenesis were retrieved using Fast Automated Biomedical Literature Extraction (FABLE; fable.chop.edu) [
31] and Ingenuity database. Angiogenic gene profiles associated with SAHA, DAC and ES8 were used to construct Venn diagrams (bioinfogp.cnb.csic.es/tools/venny/index.html). Global functional analysis was performed using IPA to find the top 5 significantly influenced molecular and cellular functions along with physiological system development and function at organism level. Results are presented as p-value which is a measure of likelihood that the association between a set of focus genes in experiment and a given function is due to random chance. Ingenuity database was used to generate lists of genes involved in EC neovascularization mechanisms. Microarray output was overlaid with these lists to identify processes affected. Results of top categories influenced by ES8 are expressed as the percentage of total genes affected. Lists of major angiogenic signaling pathways genes available over ingenuity database and SABiosciences (www. sabiosciences.com/ArrayList.php) were generated. These lists were overlaid with microarray data to find out the modified genes.
Quantitative real-time PCR analysis of gene expression
RNAs were extracted with the miRNeasy kit (Qiagen) according to the manufacturer’s protocol. cDNA synthesis was performed with 200 ng total RNA using the Reverse Transcriptase Core kit (Eurogentec). Resulting cDNAs were used for quantitative realtime PCR (qRT-PCR) using MESA Green qPCR Master Mix for SYBR Assay dTTP; Eurogentec). Thermal cycling was performed on an ABI Prism 7000 HT Sequence Detection System (Applied Biosystems). The relative transcript level of each gene was obtained by the ΔΔCt method and normalized with respect to the hypoxanthine phosphoribosyl transferase (HPRT) housekeeping gene. Primers were designed with the NCBI Primer Blast software (www.ncbi.nlm.nih.gov/tools/primer-blast) and selected so as to span exonexon junctions and avoid detection of genomic DNA. All data are expressed as fold change versus control ± SEM.
Evaluation of apoptosis in cancer cell lines
Two small cell lung cancer (SCLC) cell lines (N417 and H69) were cultivated in the presence of different concentrations of ES8 (1 to 10 μM) during 24 h. After ethanol fixation and labeling with propidium iodide, cells in sub-G1 having undergone DNA fragmentation were counted by flow cytometry.
Antitumor effect in mouse models
Two SCLC cell lines H146 and H69 were injected subcutaneously in severe combined immunodeficiency (SCID) mice in presence of 50% matrigel. The schedule of ES8 injections was first determined in preliminary dose response experiments. When tumors reached a volume of 300 to 400 mm³, intravenous injections of ES8 (3.5 mg/kg) were performed twice a week. Tumor volumes were calculated atregular intervals of time (days) using the formula: 1/6 × π × D × d² with D and d being the largest and the smallest diameters, respectively. Groups of at least 5 mice were tested in each experimental condition.
Statistics
Results of viability, apoptosis, cell migration, EC capillary-like network formation assay, western blotting and quantitative real-time PCR analysis were assessed by paired Student’s t-test. Significance of image measurements performed on the aortic ring and CAM assays were analyzed using non-parametric Wilcoxon test. Significance of the data from zebrafish model was assessed by Fisher’s exact test and Student’s t-test was employed to analyze results of immune fluoroscent staining of histone H3.
Data from microarray was analyzed using Illumina Genome Studio Gene Expression Module. Using quantile algorithm for normalization, differential expression was assessed by Illumina custom model. Correction for the false discovery rate was done by applying multiple testing corrections using Benjamini and Hochberg method [
32]. Comparison of fold changes of technical duplicates of every treatment with control generated four possible combinations. Mean of these four combinations was computed and genes with mean fold change of >1.5 or <-1.5 in up and down regulated gene lists respectively were sorted. Finally, among the sorted genes, only those whose standard deviation/mean ratio was < 0.1 in upregulated and >-0.1 in downregulated gene lists respectively were considered for further analysis. Right-tailed Fischer’s exact test was used in IPA for global functional analysis. Statistical significance was evaluated by the Mann-Whitney test.
Results
Hydroxamic acid-based HDACi are designed to complex the Zn
2+ ion located in the HDAC catalytic pocket. Besides the inhibitory arm, the rest of the compound helps in stabilizing the enzyme-inhibitor complex and may provide some specificity. We designed a compound called ES8 in which the hydroxamic acid is fused to a 5-nitro naphtalimide via a 5-carbon arm: i.e. N-Hydroxy-6-(5-nitronaphtalimide)-hexanamide ([
25] and manuscript in preparation). ES8 inhibits HDAC8 with an IC50 of 0.8 μM
in vitro and also displays a weak DNA methyl transferase (DNMT) inhibitory activity (37% at 500 μM).
ES8 affects viability and induces apoptosis in HUVEC
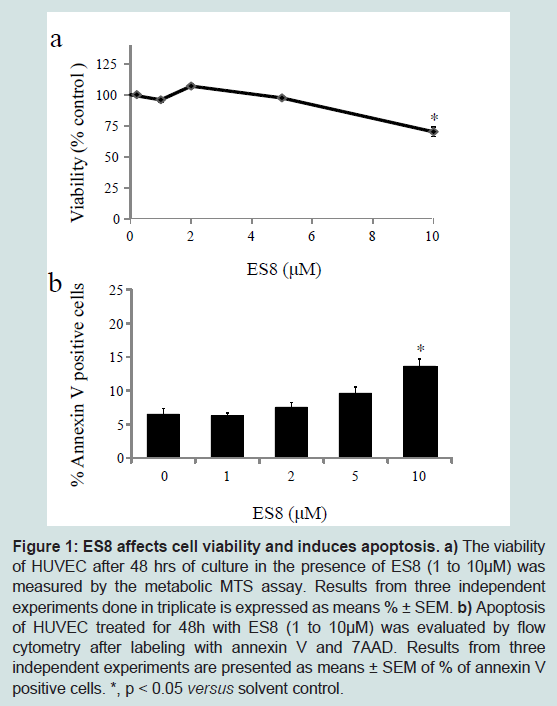
To determine whether ES8 affects cell viability, the metabolic activity of HUVEC was evaluated with the MTS assay (
Figure 1a). Micromolar doses of ES8 ranging between 1 and 5 μM did not induce cytotoxicity up to 4 days of treatment (Figure S1). Only a high concentration of 10 μM reduced viability significantly. To evaluate the effect of ES8 on apoptosis, HUVEC were labeled with Annexin V-7AAD and analyzed by flow cytometry. ES8 at 10 μM was proapoptotic in HUVEC after 48 h of culture (
Figure 1b). This interpretation was confirmed by a 2.2 increase in caspase activity at 10 μM.Based on these antimetabolic and proapoptotic activities, doses ranging between 1-5 micromolar of ES8 were chosen for further experiments in HUVEC.
a) The viability of HUVEC after 48 hrs of culture in the presence of ES8 (1 to 10 μM) was measured by the metabolic MTS assay. Results from three independent experiments done in triplicate is expressed as means % ± SEM.b) Apoptosis of HUVEC treated for 48h with ES8 (1 to 10 μM) was evaluated by flow cytometry after labeling with annexin V and 7AAD. Results from three independent experiments are presented as means ± SEM of % of annexin V positive cells. *, p < 0.05 versus solvent control.
Subtoxic doses of ES8 impede cell migration and tubulogenesis
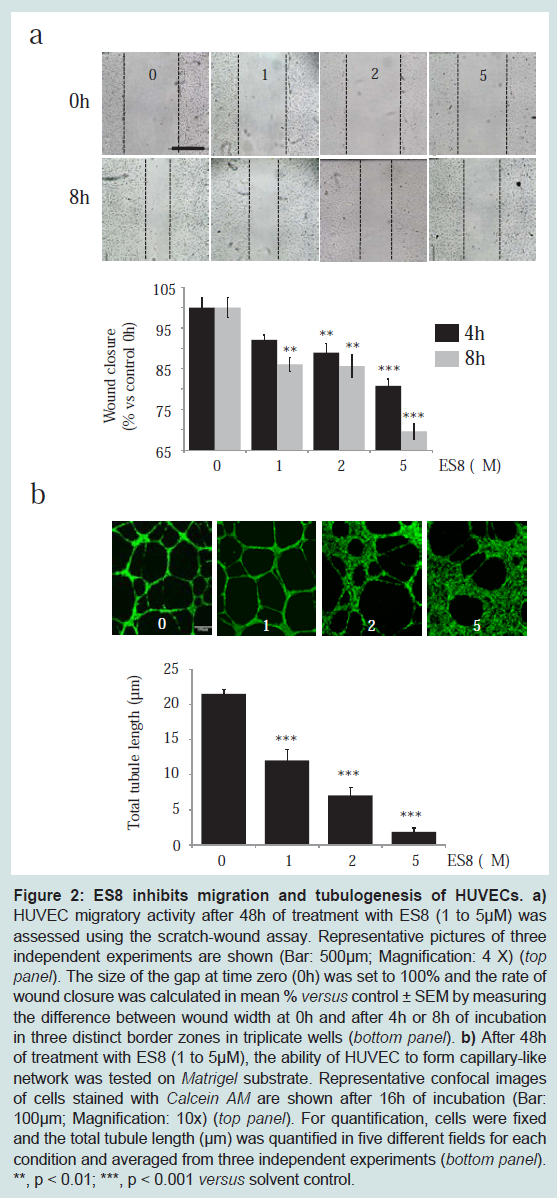
To test whether ES8 interferes with cell migration, scratch assays were carried out with HUVEC after 48 h of treatment, followed by the quantification of wound closure after 4 h and 8 h of culture (
Figure 2a). ES8 induced a dose-dependent inhibition of cell migration between 1 and 5 μM. A subtoxic concentration of 1 μM of the compound was thus sufficient to significantly inhibit movement of HUVEC.
a) HUVEC migratory activity after 48 h of treatment with ES8 (1 to 5 μM) was assessed using the scratch-wound assay. Representative pictures of three independent experiments are shown (Bar: 500μm; Magnification: 4 X) (top panel). The size of the gap at time zero (0 h) was set to 100% and the rate of wound closure was calculated in mean % versus control ± SEM by measuring the difference between wound width at 0h and after 4 h or 8 h of incubation in three distinct border zones in triplicate wells (bottom panel). b) After 48 h of treatment with ES8 (1 to 5 μM), the ability of HUVEC to form capillary-like network was tested on Matrigel substrate. Representative confocal images of cells stained with Calcein AM are shown after 16 h of incubation (Bar: 100 μm; Magnification: 10x) (top panel). For quantification, cells were fixed and the total tubule length (μm) was quantified in five different fields for each condition and averaged from three independent experiments (bottom panel). **, p < 0.01; ***, p < 0.001 versus solvent control.
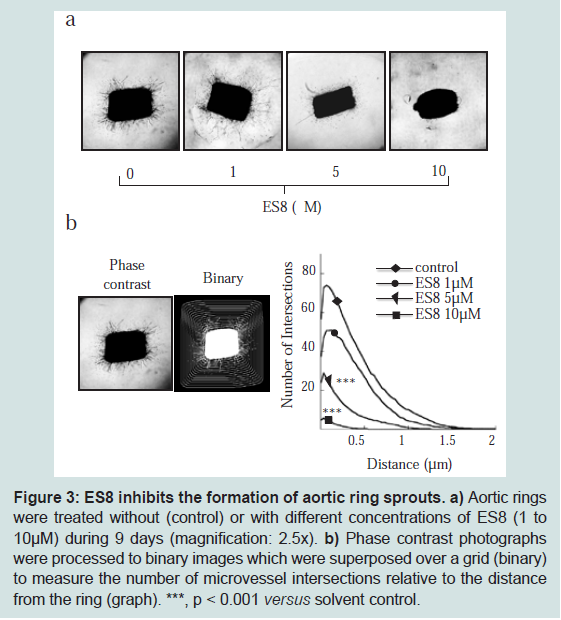
Next, we addressed the question whether the formation of EC capillary-like network on Matrigel substrate was affected by ES8. After 16 h of incubation with ES8, HUVEC underscored a dose dependent perturbation in tubular organization (Figure 2b).We conclude that ES8 at subtoxic doses inhibits HUVEC migration and formation of tubule-like structures, two mechanisms involved in angiogenesis.ES8 represses vessel sprouting in aortic ringsThe anti-angiogenic effect of ES8 was then examined in a more complex model which takes perivascular cells and their interactions with EC into account: the tridimensional culture of rat aortic rings. Increasing concentrations of ES8 (1-10 μM) progressively inhibited the outgrowth of microvessels (Figure 3a). Computer-assisted quantification of the microvascular network complexity, taking into account the total number of intersections of microvessels and the distance to the aortic ring [26], revealed a dose dependent decrease in vessel sprouting (Figure 3b).
a) Aortic rings were treated without (control) or with different concentrations of ES8 (1 to 10 μM) during 9 days (magnification: 2.5 x). b) Phase contrast photographs were processed to binary images which were superposed over a grid (binary) to measure the number of microvessel intersections relative to the distance from the ring (graph). ***, p < 0.001 versus solvent control.
ES8 inhibits angiogenesis in CAMs
We next evaluated the anti-angiogenic activity of ES8 in the
ex ovo CAM assay which has embryonic EC that resemble more closely the microvascular or activated EC associated with angiogenic reactions [
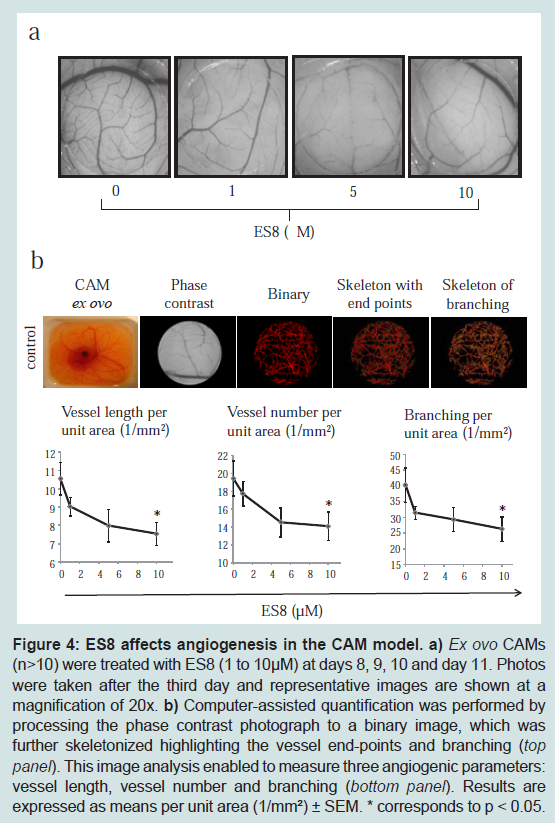
33]. The CAMs were treated daily with different concentrations of ES8 (1-10 μM) during 3 days (
Figure 4a). Computer-assisted image quantification (n>10) [
28] yielded three angiogenic parameters: vessel lengths, vessel number and branching (
Figure 4b). As illustrated on the lower panels of (
Figure 4), ES8 significantly inhibited neovascularization in a dose dependent manner, without any visible change in embryo’s viability.
a) Ex ovo CAMs (n>10) were treated with ES8 (1 to 10 μM) at days 8, 9, 10 and day 11. Photos were taken after the third day and representative images are shown at a magnification of 20x. b) Computer-assisted quantification was performed by processing the phase contrast photograph to a binary image, which was further skeletonized highlighting the vessel end-points and branching (top panel). This image analysis enabled to measure three angiogenic parameters: vessel length, vessel number and branching (bottom panel). Results are expressed as means per unit area (1/mm²) ± SEM. * corresponds to p < 0.05.
ES8 interferes with vessel formation in zebrafish embryos
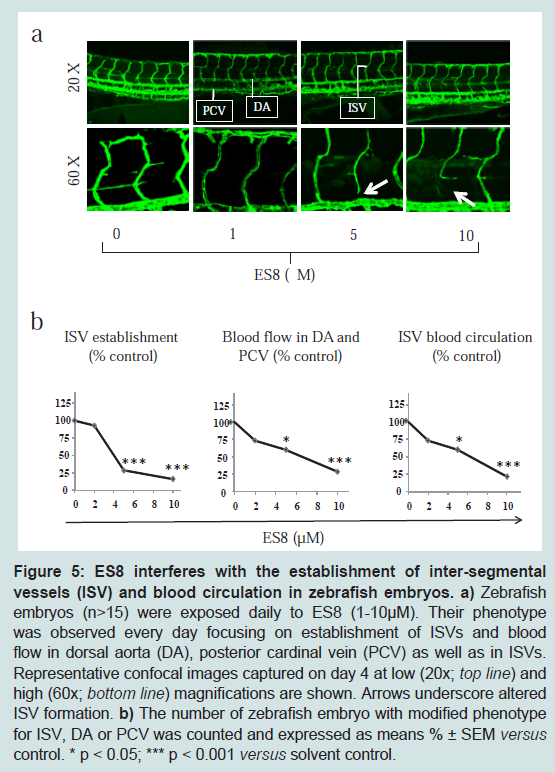
The anti-angiogenic impact of ES8 was then investigated in the zebrafish model where development of blood vessels can be closely observed up to single cell resolution. First embryonic vessels to appear in zebrafish, the dorsal aorta (DA) and the posterior cardinal vein (PCV), which traverse along the axis of the embryo, are vasculogenic vessels, whereas sprouts emerging from the axial vessels represent the angiogenic inter-segmental vessels (ISVs). To monitor the impact of ES8 on vasculogenesis and angiogenesis, zebrafish embryos (n>15) were treated daily with different concentrations of ES8. In ES8- treated embryos, vasculogenesis was preserved as both the DA and PCV remained unaffected (
Figure 5a). In contrast, distortions in the formation of ISV were observed in the same embryonic region (
Figure 5a, arrows). Enumeration of embryos with ISV defects versus control using confocal imaging revealed that ES8 at doses above 5 μM significantly altered the establishment of ISVs after 4 days of treatment (
Figure 5b left panel). Concomitantly, bright field microscopic observations underscored that blood flow in DA, PCV as well as in ISVs was also notably affected at 5 μM of ES8 (
Figure 5b middle and right panel). Dose-dependent disruption of angiogenesis and reduction in blood circulation were maintained over 7 days of embryo development without affecting their viability (data not shown).It thus appears that ES8 displays an anti-angiogenic effect in three relevant and complex models:
ex vivo cultures of aortic rings as well as
in vivo assays of CAM and zebrafish.
a) Zebrafish embryos (n>15) were exposed daily to ES8 (1-10 μM). Their phenotype was observed every day focusing on establishment of ISVs and blood flow in dorsal aorta (DA), posterior cardinal vein (PCV) as well as in ISVs. Representative confocal images captured on day 4 at low (20x; top line) and high (60x; bottom line) magnifications are shown. Arrows underscore altered ISV formation. b) The number of zebrafish embryo with modified phenotype for ISV, DA or PCV was counted and expressed as means % ± SEM versus control. * p < 0.05; *** p < 0.001 versus solvent control.
ES8 treatment correlates with global histone H3 acetylation
To dissect the mechanisms involved, we next investigated the levels of histone acetylation in the presence of ES8. Therefore, HUVEC were exposed to ES8, lysed and analyzed by western blot using a panacetlyated histone H3 antibody (
Figure 6a). In the presence of ES8, histone H3 acetylation was increased in a dose dependent manner (1 to 5 μM) (
Figure 6b). Confocal microscopy confirmed the ES8- induced hyperacetylation (
Figure 6c and
Figure 6d), which was maintained over at least 3 days (Figure S2). Similar conclusions were obtained in the aortic ring model (Figure S3).
a) To monitor changes in histone acetylation upon treatment, HUVEC were exposed during 48 h to ES8 (1 to 5 μM) or control (0.1% DMSO). After culture, cell lysates were analyzed by western blot using antibody directed against acetylated histone H3 or actin used as loading control. b) Western blots signal intensities were quantified, normalized to actin and arbitrarily set to 1 (control). HUVEC were treated with ES8 for 48h and labeled using a panacetylated histone H3 antibody and an Alexa fluor 488 conjugate. Cell nuclei were stained with DAPI. c) Representative confocal images. d) Computer assisted quantification of acetylated histone H3 immunofluorescence. Data is expressed as mean signal intensities per cell area (μm²) ± SEM of 15 images obtained from three independent experiments. * p < 0.05 versus solvent control (0.1% DMSO).
ES8 affects expression of genes involved in angiogenesis with a characteristic transcriptomic pattern
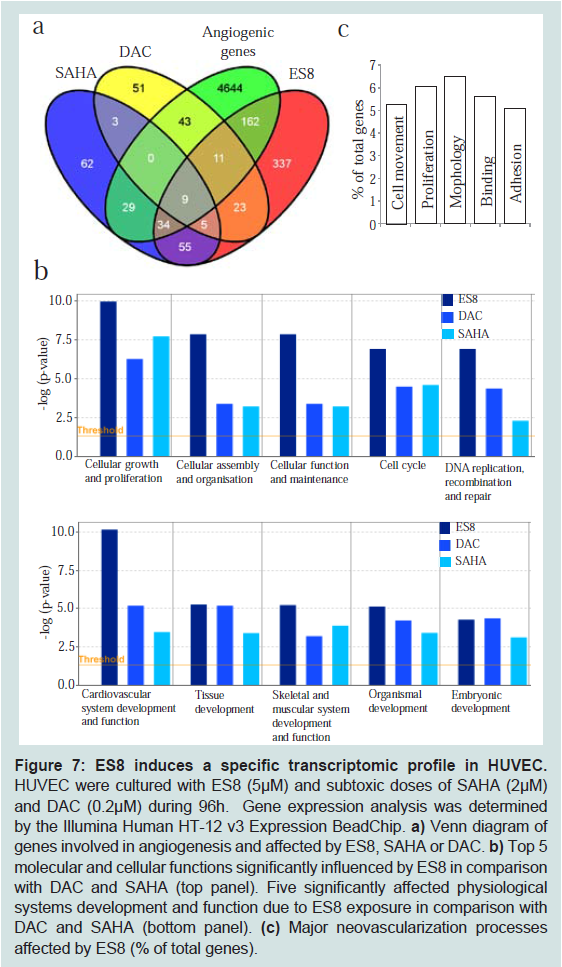
To further characterize the anti-angiogenic mechanisms, we analyzed the transcriptome of HUVEC cultivated during 4 days in the presence of ES8. As reference, the same experiment was performed in parallel with another hydroxamic acid based HDACi sharing similarity with ES8 (SAHA) and a DNMT inhibitor (DAC) at subtoxic doses (2 μM and 0.2 μM, respectively). RNAs were isolated and hybridized to Illumina Human HT-12 v3 Expression Bead Chip. Statistical and bioinformatic analyses were performed by means of the Illumina’s Genome Studio Gene Expression Module. After setting a threshold of 1.5 fold, genes modulated by each treatment were imported into the IPA software. Expression of 636 genes was affected by ES8 among which 216 (i.e. 162+11+9+34) are involved in angiogenesis (
Figure 7a). As expected, ES8 and SAHA shared a significant proportion of genes involved in angiogenesis [n=43 (9+34)] (Table S1). Interestingly, ES8 and DAC modulated expression of 11 angiogenic genes that were unaffected by SAHA (Table S2). Only 9 angiogenesis associated genes were affected by all 3 inhibitors (Table S3). Finally, 162 angiogenic genes were specific to ES8 (Table S4).
To find out the molecular and cellular functions most significantly influenced by ES8 in comparison to DAC and SAHA, the data set was inspected using IPA. The analysis revealed cellular growth and proliferation, cellular assembly and organization, cellular function and maintenance, cell cycle and DNA replication, recombination and repair as the top five significantly affected functions. ES8 influenced these functions more significantly as compared to SAHA and DAC (
Figure 7b top panel). Interestingly, among the various physiological systems development and function analysed, the most significantly influenced system with ES8 exposure is cardiovascular (
Figure 7b bottom panel). In addition, among the 7 major angiogenic signaling pathways analyzed (VEGF, FGF, Netrin, Notch, Semaphorin, Hedgehog, Ephrin), except Netrin, genes in other six pathways were influenced by ES8 (Table S5). To further investigate the mechanisms involved in inhibiting angiogenesis, the subset of angiogenic genes modulated by ES8 was analyzed for their implication in various processes of neovascularization. Analysis by IPA indicated that cell movement, proliferation, morphology, binding and adhesion of EC are the most relevant parameters (
Figure 7c).
Figure 7: ES8 induces a specific transcriptomic profile in HUVEC.
HUVEC were cultured with ES8 (5 μM) and subtoxic doses of SAHA (2 μM) and DAC (0.2 μM) during 96h. Gene expression analysis was determined by the Illumina Human HT-12 v3 Expression BeadChip.a) Venn diagram of genes involved in angiogenesis and affected by ES8, SAHA or DAC. b) Top 5 molecular and cellular functions significantly influenced by ES8 in comparison with DAC and SAHA (top panel). Five significantly affected physiological systems development and function due to ES8 exposure in comparison with DAC and SAHA (bottom panel). (c) Major neovascularization processes affected by ES8 (% of total genes).
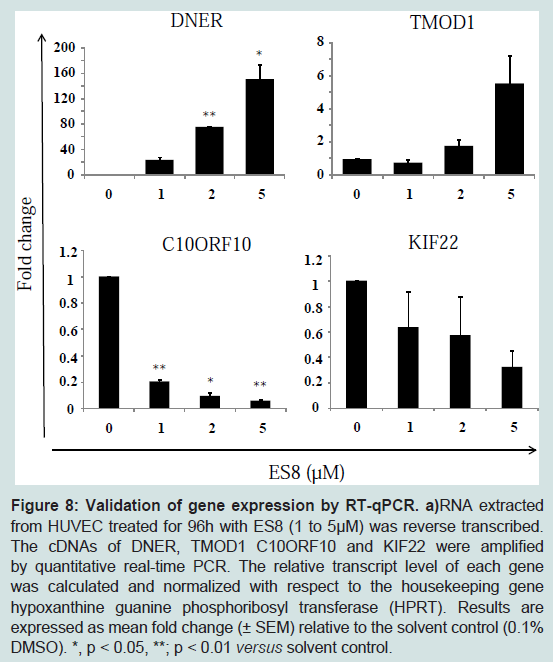
As control, expression profiling data were validated by qRT-PCR for 4 arbitarily chosen genes among the top most regulated genes. As shown in (
Figure 8), the expression levels of two up-regulated, DNER (Delta/Notch-like EGF-related receptor) and TMOD1 (tropomodulin 1) and two down-regulated, C10ORF10 (chromosome 10 open reading frame 10/DEPP) and KIF22 (kinesin family member 22) genes were in accordance with the microarray results.
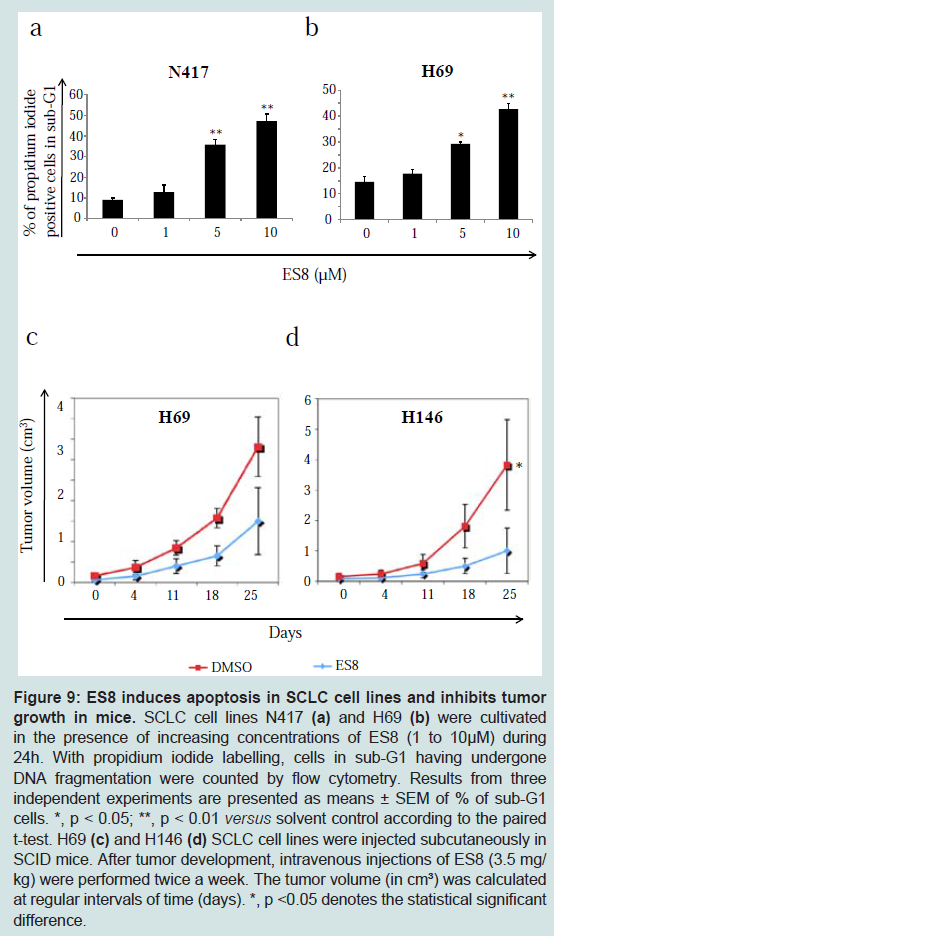
ES8 induces apoptosis in cancer cell lines and inhibits tumor growth in mice
Finally, the anticancer activity of ES8 was evaluated in SCLC cell lines. (
Figure 9) (panels a and b) shows that ES8 at 5 μM induced DNA fragmentation in two cell lines (N417 and H69), indicating onset of apoptosis. ES8 also inhibited tumor growth in two SCID mouse models engrafted with human SCLC cells. When tumors reached a volume of 300-400 mm³, mice were injected intravenously with ES8 twice-weekly. Administration of 3.5 mg/kg of ES8 was able to significantly inhibit tumor growth (* p<0.05 for H146 according to the Mann-Whitney test, (
Figure 9c and
Figure 9d) and did not induce major toxicities in mice. We conclude that ES8 has antitumor potential in two mouse models of SCLC.
Discussion
Due to tissue heterogeneity and molecular complexity, a single assay is not sufficient to assess an angiogenic response [
34]. We have therefore demonstrated that ES8 potently inhibits angiogenesis in diverse yet relevant models with various complexities: (i) HUVEC cultures, (ii) aortic rings that include perivascular cells and mimic the sprouting of EC that are not in a proliferative state [
35], (iii) CAMs that involve both sprouting and intussusceptive microvascular growth in coordination with connective tissue elements [
36] and (iv) Zebrafish having a fully functional cardiovascular system. These results are supported by IPA analyzes of microarray output with cardiovascular system as the most significantly influenced physiological system development and function by ES8 (
Figure 7b bottom panel).
ES8 was initially designed by fusing a hydroxamic acid to a 5-nitro naphtalimide in order to concomitantly affect lysine acetylation and cytosine methylation [
25]. In fact, the 5-nitro naphtalimide group of ES8 interacts with the catalytic pocket of DNA methyltransferases as shown by docking simulations. Furthermore, the ability of ES8 to decrease methyltransferase activity
in vitro is similar to that of another reversible DNMT inhibitor called RG108 (Boittiaux et al. unpublished results). Due to induction of apoptosis, ES8 does not significantly reduce DNA methylation in HUVEC as measured by an enzymatic assay (Super SenseTM Methylated DNA Quantification Kit from Epigentek) and Illumina (Illumina Infinium Bead Chip Methylation27 v1) microarrays (data not shown). Although ES8 does not act as an efficient DNMT inhibitor, our data shows that it affects expression of genes also modulated by DAC, a prototypica DNA methylation inhibitor. Whether the ability of ES8 to affect gene transcription is linked to DNMT or HDAC inhibition remains to be determined experimentally. However, since DNMTs and HDACs form functional and interdependent complexes, dissociation of both activities will be challenging.
In this context, transcriptomic profiling revealed to be quite informative (
Figure 7a, Table S1, S2, S3 and S4). First, both ES8 and SAHA significantly modify the expression of 43 genes involved in angiogenesis, likely through their HDAC inhibitory activity. Among these, inhibition of CCL14 (C-C motif chemokine ligand 14) is known to be associated with suppression of angiogenesis and metastasis of breast cancer [
37]. SAHA and ES8 decrease expression of BIRC5 (survivin), a member of the inhibitor of apoptosis (IAP) family that upregulates VEGF and bFGF [
38]. Both HDAC inhibitors also activate PTX3 (Pentraxin 3), an inhibitor of FGF2 dependent EC proliferation [
39]. Another common target of ES8 and SAHA is IL8, a chemokine that potently promotes angiogenesis. BMP-2 (Bone morphogenetic protein-2) stimulates in EC Smad 1/5, Erk 1/2, and Id1 expression which are associated with an increase in tube formation and proliferation.
The fact that ES8 and SAHA modify the expression of identical genes is expected based on their predicted mechanism of HDAC inhibition through hydroxamic acid arms. What is more surprising is that these two related inhibitors also affect angiogenic genes differently: i.e. 29 are modulated only by SAHA but not ES8 and 162+11 by ES8 but not SAHA (
Figure 7a). In contrast to SAHA, ES8 down regulates Rasip1 (Ras interacting protein 1) essential for EC migration and assembly [
40]. ES8, but not SAHA, mitigates cav-1 (caveolin-1) that is critical for VEGF and eNOS activation [
41]. Inhibition of cav-1 significantly reduces basal and VEGF-stimulated phosphorylation of VEGFR2, PLCγ1 and Akt thereby affecting VEGF induced tubule formation [
42]. ES8, but not SAHA, up regulates TXNIP (thioredoxin-interacting protein), whose silencing stimulates thioredoxin activity and EC migration [
43]. Conversely, SAHAaffects genes not targeted by ES8, such as ANXA3 (annexin A3) that induces VEGF production through the HIF-1 pathway [
44]. SAHA also downregulates FABP5 (fatty acid binding protein 5) known to induce expression of VEGF [45]. Although microarray profiling was performed with HUVEC treated with different subtoxic doses of inhibitors (i.e. ES8 5 μM and SAHA 2 μM), RT-qPCR validated differential gene expression levels (
Figure 8).
a)RNA extracted from HUVEC treated for 96h with ES8 (1 to 5 μM) was reverse transcribed. The cDNAs of DNER, TMOD1 C10ORF10 and KIF22 were amplified by quantitative real-time PCR. The relative transcript level of each gene was calculated and normalized with respect to the housekeeping gene hypoxanthine guanine phosphoribosyl transferase (HPRT). Results are expressed as mean fold change (± SEM) relative to the solvent control (0.1% DMSO). *, p < 0.05, **; p < 0.01 versus solvent control.
Interestingly, ES8 and DAC modulate expression of 11 angiogenic genes that are unaffected by SAHA (Table S2). In particular, DAC and ES8 upregulate TGFBI (transforming growth factor, beta-induced) that interacts with αvβ3 integrin and effectively inhibits angiogenesis [
46]. Another gene concomitantly upregulated by DAC and ES8 is TFPI2 (tissue factor pathway inhibitor 2), an inhibitor of plasmin and MMPs activity that affects EC migration and capillary tube formation [
47]. Concomitant modulation of these genes by ES8 and DAC may reveal a mechanism of DNMT inhibition by the 5-nitro naphtalimide group.
It is remarkable that only a series of 9 angiogenesis-associated genes is affected by all 3 inhibitors (Table S3). This list contains NFkB regulators (BST2 and ESM1), cell signaling modulators (IGFBP7, SULF2 and SGK1) and genes involved in metabolism (thymidylate synthetase and glucose-6-phosphate isomerase). Further investigations, for example by RNA interference, will be required to validate a functional link between regulation of angiogenesis and expression of these genes or of their combination. The fact that these genes are concomitantly affected by 3 different epigenetic inhibitors does indeed not prove their functional implication in angiogenesis. If involved, these genes may constitute candidates for novel therapeutic targets.
Although, ES8 does not significantly modulate the expression of key angiogenic growth factors or its receptors directly (Table S1, S2, S3 and S4), it affects genes involved in their signaling pathways (Table S5). In particular, a series of angiogenic genes (n=162) are specific to ES8 (Table S4). Among the ES8 modulated genes, four of the top regulated genes (DNER, TMOD1, C10ORF10 and KIF22) were used to validate the microarrays by RTqPCR (
Figure 8). In particular, DNER is homologous to Notch family proteins (e.g. jagged-1, delta, serrate) but carries no intracellular carboxyl-terminal domain. DNER acts as a ligand of Notch and mediates neuron-glia trans interaction during astrocytogenesis [
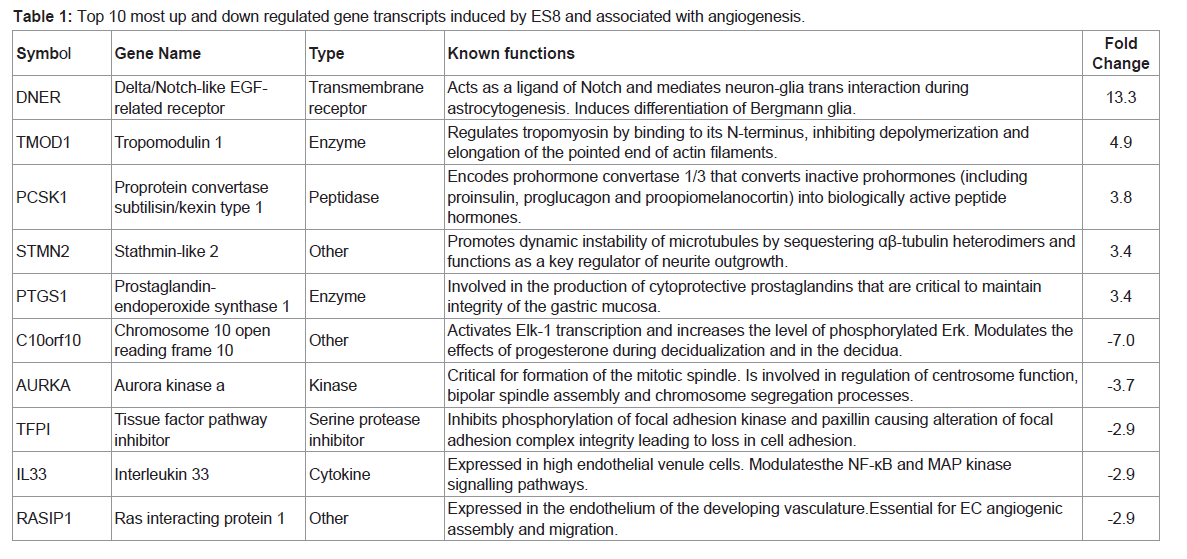
48]. Expression of DNER in Purkinje cell dendrites instructively induces process extension and differentiation of Bergmann glia. In fact, Notch signaling functions as a negative feedback mechanism downstream of the VEGF pathway that acts to finely shape the vascular network. Our preliminary observations indicate that DNER and TMOD1, an actin-capping protein that interacts with tropomyosin that is one of the top upregulated gene (
Table 1), are indeed required for HUVEC tubulogenesis (manuscript in preparation).
Together, our observations thus reveal that compounds modulating different epigenetic processes (lysine acetylation and cytosine methylation) inhibit angiogenesis in different models, thereby confirming previous reports [
16,
49]. What is more surprising is that closely related HDACs (ES8 and SAHA) affect quite different gene sets and achieve the same outcome on angiogenesis. Notwithstanding, it is possible that their impact on angiogenesis is independent of regulation of gene expression, for example through regulation of DNA replication or induction of reactive oxygen species [
50]. It is noteworthy that ES8 also triggers other histone modifications (i.e. H3K27, a repressive marker associated with transcription silencing; data not shown) and could further more target non-histone proteins. Importantly, ES8 which induces significant DNA fragmentation in small cell lung cancer cell lines N417 and H69 is well tolerated in mice in the micromolar dose range and represses tumor growth (
Figure 9).
SCLC cell lines N417 (a) and H69 (b) were cultivated in the presence of increasing concentrations of ES8 (1 to 10 μM) during 24 h. With propidium iodide labelling, cells in sub-G1 having undergone DNA fragmentation were counted by flow cytometry. Results from three independent experiments are presented as means ± SEM of % of sub-G1 cells. *, p < 0.05; **, p < 0.01 versus solvent control according to the paired t-test. H69 (c) and H146 (d) SCLC cell lines were injected subcutaneously in SCID mice. After tumor development, intravenous injections of ES8 (3.5 mg/kg) were performed twice a week. The tumor volume (in cm³) was calculated at regular intervals of time (days). *, p <0.05 denotes the statistical significant difference.
In conclusion, we have designed a novel hydroxamic-based lysine deacetylase inhibitor bound to a 5-nitro naphtalimide platform (ES8) affecting angiogenesis in different models
in vitro,
ex ovo and
in vivo. The transcriptome modulated by ES8 in HUVEC partly overlaps but differs from those associated with SAHA and DAC. The availability of closely related compounds broadens the different therapeutic options to interfere with diseases due to exacerbation of angiogenesis.
Acknowledgements
This work was supported by the “Fonds National de la Recherche Scientifique” (FNRS), the Télévie, the Belgian Foundation against Cancer (FBC), the Sixth Research Framework Programme of the European Union (project INCA LSHC-CT-2005-018704), the “Neoangio” excellence program and the “Partenariat Public Privé” PPP INCA of the “Direction générale des Technologies, de la Recherche et de l’Energie/DG06” of the Walloon government, the “Action de Recherche Concertée Glyvir” of the “Communauté française de Belgique”, the “Centre anticancéreux près ULg” (CAC), the “Agricultureislife” and “Synbiofor” projects of GxABT, the “ULg Fonds Spéciaux pour la Recherche”, the “Plan Cancer” of the “Service Public Fédéral,” and BELVIR Inter university Attraction Poles Program 7/45 initiated by the Belgian Science Policy Office. We thank the GIGA technology platforms and more particularly Olivier Nivelles for helping in experiments involving zebrafish. TVSS is a PhD fellow of the FBC and LW is Research Director of the FNRS.
Ethical standards
All experiments were approved by the university ethic committees and were performed in accordance with the legal national and European regulations.
References
- Beets K, Huylebroeck D, Moya IM, Umans L, Zwijsen A (2013) Robustness in angiogenesis: notch and BMP shaping waves. Trends Genet 29: 140-9.
- Carmeliet P (2005) Angiogenesis in life, disease and medicine. Nature 438: 932-936.
- Mariotti M, Maier JAM (2006) Angiogenesis: An Overview. In: Forough R, editor. New Frontiers in Angiogenesis: Springer Netherlands pp. 1-29.
- Avraamides CJ, Garmy-Susini B, Varner JA (2008) Integrins in angiogenesis and lymphangiogenesis. Nat Rev Cancer 8: 604-617.
- Oronsky BT, Scicinski JJ, Reid T, Knox S (2012) Beyond antiangiogenesis: vascular modulation as an anticancer therapy-a review. Transl Oncol 5: 133-140.
- Kalra M, Rao N, Nanda K, Rehman F, Girish KL, et al. (2012) The role of mast cells on angiogenesis in oral squamous cell carcinoma. Med Oral Patol Oral Cir Bucal 17: e190-e196.
- Bergers G, Hanahan D (2008) Modes of resistance to anti-angiogenic therapy. Nat Rev Cancer 8: 592-603.
- Ellis LM, Hicklin DJ (2009) Resistance to targeted therapies: refining anticancer therapy in the era of molecular oncology. Clin Cancer Res 15: 7471-7478.
- Ma J, Waxman DJ (2008) Combination of antiangiogenesis with chemotherapy for more effective cancer treatment. Mol Cancer Ther 7: 3670-3684.
- Herbst RS, Madden TL, Tran HT, Blumenschein GR Jr, Meyers CA, et al. (2002) Safety and pharmacokinetic effects of TNP-470, an angiogenesis inhibitor, combined with paclitaxel in patients with solid tumors: evidence for activity in non-small-cell lung cancer. J Clin Oncol 20: 4440-4447.
- Khan MK, Miller MW, Taylor J, Gill NK, Dick RD, et al. (2002) Radiotherapy and antiangiogenic TM in lung cancer. Neoplasia 4: 164-170.
- Mauceri HJ, Hanna NN, Beckett MA, Gorski DH, Staba MJ, et al. (1998) Combined effects of angiostatin and ionizing radiation in antitumour therapy. Nature 394: 287-291.
- Baker CH, Solorzano CC, Fidler IJ (2002) Blockade of vascular endothelial growth factor receptor and epidermal growth factor receptor signaling for therapy of metastatic human pancreatic cancer. Cancer Res 62: 1996-2003.
- Huang SF, Kim SJ, Lee AT, Karashima T, Bucana C, et al. (2002) Inhibition of growth and metastasis of orthotopic human prostate cancer in athymic mice by combination therapy with pegylated interferon-alpha-2b and docetaxel. Cancer Res 62: 5720-5726.
- Hellebrekers DM, Griffioen AW, van Engeland M (2007) Dual targeting of epigenetic therapy in cancer. Biochim Biophys Acta 1775: 76-91.
- Sahin M, Sahin E, Gumuslu S, Erdogan A, Gultekin M (2010) DNA methylation or histone modification status in metastasis and angiogenesis-related genes: a new hypothesis on usage of DNMT inhibitors and S-adenosylmethionine for genome stability. Cancer Metastasis Rev 29: 655-676.
- Kim MS, Kwon HJ, Lee YM, Baek JH, Jang JE, et al. (2001) Histone deacetylases induce angiogenesis by negative regulation of tumor suppressor genes. Nat Med 7: 437-443.
- Deroanne CF, Bonjean K, Servotte S, Devy L, Colige A, et al. (2002) Histone deacetylases inhibitors as anti-angiogenic agents altering vascular endothelial growth factor signaling. Oncogene 21: 427-436.
- Michaelis M, Michaelis UR, Fleming I, Suhan T, Cinatl J, et al. (2004) Valproic acid inhibits angiogenesis in vitro and in vivo. Mol Pharmacol 65: 520-527.
- Mottet D, Bellahcene A, Pirotte S, Waltregny D, Deroanne C, et al. (2007) Histone deacetylase 7 silencing alters endothelial cell migration, a key step in angiogenesis. Circ Res 101: 1237-1246.
- Butler LM, Zhou X, Xu WS, Scher HI, Rifkind RA, et al. (2002) The histone deacetylase inhibitor SAHA arrests cancer cell growth, up-regulates thioredoxin-binding protein-2, and down-regulates thioredoxin. Proc Natl Acad Sci U S A 99: 11700-11705.
- Glaser KB, Staver MJ, Waring JF, Stender J, Ulrich RG, et al. (2003) Gene expression profiling of multiple histone deacetylase (HDAC) inhibitors: defining a common gene set produced by HDAC inhibition in T24 and MDA carcinoma cell lines. Mol Cancer Ther 2: 151-163.
- Liu T, Kuljaca S, Tee A, Marshall GM (2006) Histone deacetylase inhibitors: multifunctional anticancer agents. Cancer Treat Rev 32: 157-165.
- Andrews KT, Gupta AP, Tran TN, Fairlie DP, Gobert GN, et al. (2012) Comparative gene expression profiling of P. falciparum malaria parasites exposed to three different histone deacetylase inhibitors. PLoS One 7: e31847.
- Gillet N, Vandermeers F, de Brogniez A, Florins A, Nigro A, et al. (2012) Chemoresistance to valproate treatment of bovine leukemia virus-infected sheep; identification of improved HDAC inhibitors. Pathogens 1: 65-82.
- Blacher S, Devy L, Burbridge MF, Roland G, Tucker G, et al. (2001) Improved quantification of angiogenesis in the rat aortic ring assay. Angiogenesis 4: 133-142.
- Nicosia RF, Ottinetti A (1990) Growth of microvessels in serum-free matrix culture of rat aorta. A quantitative assay of angiogenesis in vitro. Lab Invest 63: 115-122.
- Blacher S, Devy L, Hlushchuk R, Larger E, Lamandé N, et al. (2005) Quantification of angiogenesis in the chicken chorioallantoic membrane (CAM). Image Anal Stereol 24: 169-180.
- Kimmel CB, Ballard WW, Kimmel SR, Ullmann B, Schilling TF (1995) Stages of embryonic development of the zebrafish. Dev Dyn 203: 253-310.
- Karlsson J, von Hofsten J, Olsson PE (2001) Generating transparent zebrafish: a refined method to improve detection of gene expression during embryonic development. Mar Biotechnol (NY) 3: 522-527.
- Jagannathan J, Maris JM, White PS (2006) Identification of genes implicated in angiogenesis using an automated text mining process. J Cancer Res 66: 368-369.
- Benjamini Y, Hochberg Y (1995) Controlling the false discovery rate: A practical and powerful approach to multiple testing. J R Stat Soc 57: 289-300.
- Auerbach R, Akhtar N, Lewis RL, Shinners BL (2000) Angiogenesis assays: problems and pitfalls. Cancer Metastasis Rev 19: 167-172.
- Norrby K (2006) In vivo models of angiogenesis. J Cell Mol Med 10: 588-612.
- Berndt S, Bruyère F, Jost M, Noël A (2008) In vitro and in vivo models of angiogenesis to dissect MMP functions. In: Edwards D, Høyer-Hansen G, Blasi F, Sloane B, editors. The Cancer Degradome: Springer New York. pp. 305-325.
- Hasan J, Shnyder SD, Bibby M, Double JA, Bicknel R, et al. (2004) Quantitative angiogenesis assays in vivo--a review. Angiogenesis 7: 1-16.
- Li Q, Shi L, Gui B, Yu W, Wang J, et al. (2011) Binding of the JmjC demethylase JARID1B to LSD1/NuRD suppresses angiogenesis and metastasis in breast cancer cells by repressing chemokine CCL14. Cancer Res 71: 6899-6908.
- Wang P, Zhen H, Zhang J, Zhang W, Zhang R, et al. (2012) Survivin promotes glioma angiogenesis through vascular endothelial growth factor and basic fibroblast growth factor in vitro and in vivo. Mol Carcinog 51: 586-595.
- Presta M, Camozzi M, Salvatori G, Rusnati M (2007) Role of the soluble pattern recognition receptor PTX3 in vascular biology. J Cell Mol Med 11: 723-738.
- Xu K, Chong DC, Rankin SA, Zorn AM, Cleaver O (2009) Rasip1 is required for endothelial cell motility, angiogenesis and vessel formation. Dev Biol 329: 269-279.
- Pan YM, Yao YZ, Zhu ZH, Sun XT, Qiu YD, et al. (2006) Caveolin-1 is important for nitric oxide-mediated angiogenesis in fibrin gels with human umbilical vein endothelial cells. Acta Pharmacol Sin 27: 1567-1574.
- Tahir SA, Park S, Thompson TC (2009) Caveolin-1 regulates VEGF-stimulated angiogenic activities in prostate cancer and endothelial cells. Cancer Biol Ther 8: 2286-2296.
- Ng MK, Wu J, Chang E, Wang BY, Katzenberg-Clark R, et al. (2007) A central role for nicotinic cholinergic regulation of growth factor-induced endothelial cell migration. Arterioscler Thromb Vasc Biol 27: 106-112.
- Park JE, Lee DH, Lee JA, Park SG, Kim NS, et al. (2005) Annexin A3 is a potential angiogenic mediator. Biochem Biophys Res Commun 337: 1283-1287.
- Morgan E, Kannan-Thulasiraman P, Noy N (2010) Involvement of fatty acid binding protein 5 and PPARβ/δ in prostate cancer cell growth. PPAR Res 2010: 234629.
- Nam JO, Kim JE, Jeong HW, Lee SJ, Lee BH, et al. (2003) Identification of the alphavbeta3 integrin-interacting motif of betaig-h3 and its anti-angiogenic effect. J Biol Chem 278: 25902-25909.
- Ivanciu L, Gerard RD, Tang H, Lupu F, Lupu C (2007) Adenovirus-mediated expression of tissue factor pathway inhibitor-2 inhibits endothelial cell migration and angiogenesis. Arterioscler Thromb Vasc Biol 27: 310-316.
- Eiraku M, Tohgo A, Ono K, Kaneko M, Fujishima K, et al. (2005) DNER acts as a neuron-specific Notch ligand during Bergmann glial development. Nat Neurosci 8: 873-880.
- Hellebrekers DM, Melotte V, Vire E, Langenkamp E, Molema G, et al. (2007) Identification of epigenetically silenced genes in tumor endothelial cells. Cancer Res 67: 4138-4148.
- Rosato RR, Almenara JA, Maggio SC, Coe S, Atadja P, et al. (2008) Role of histone deacetylase inhibitor-induced reactive oxygen species and DNA damage in LAQ-824/fludarabine antileukemic interactions. Mol Cancer Ther 7: 3285-3297.
- Zhu WH, Nicosia RF (2002) The thin prep rat aortic ring assay: a modified method for the characterization of angiogenesis in whole mounts. Angiogenesis 5: 81-86.