
Journal of Veterinary Science & Medicine
Download PDF
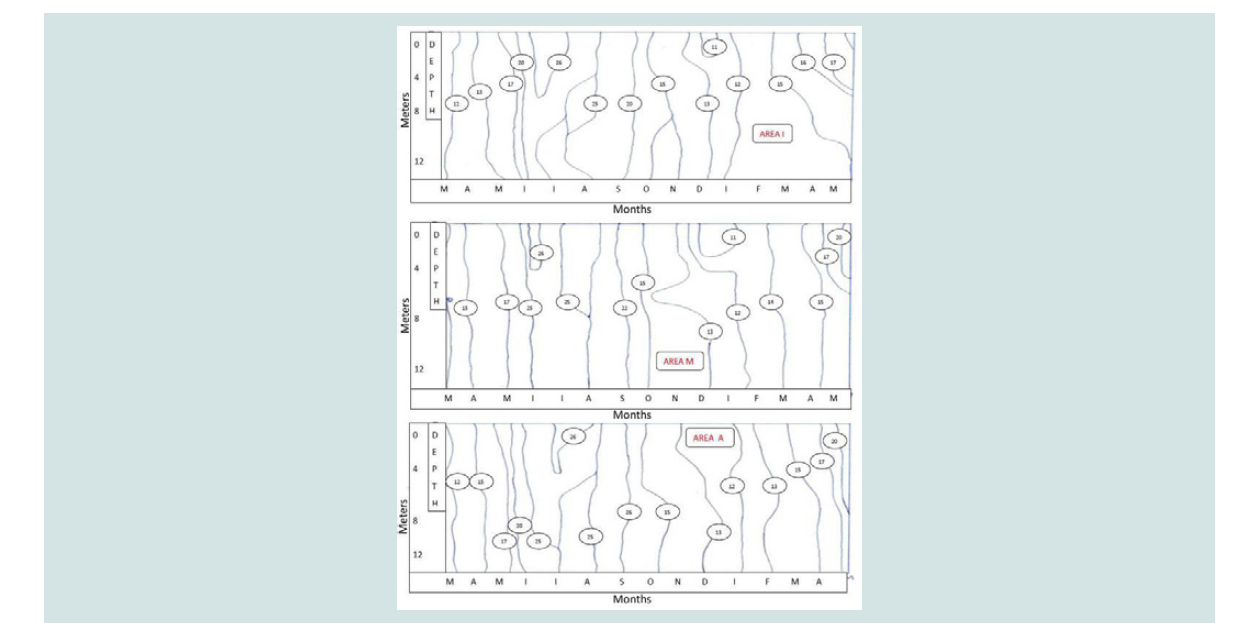 Figure 1: Temperature variation with depth at different months in sea water: coast (area A), mussel culture (area M) and reference area (area I).
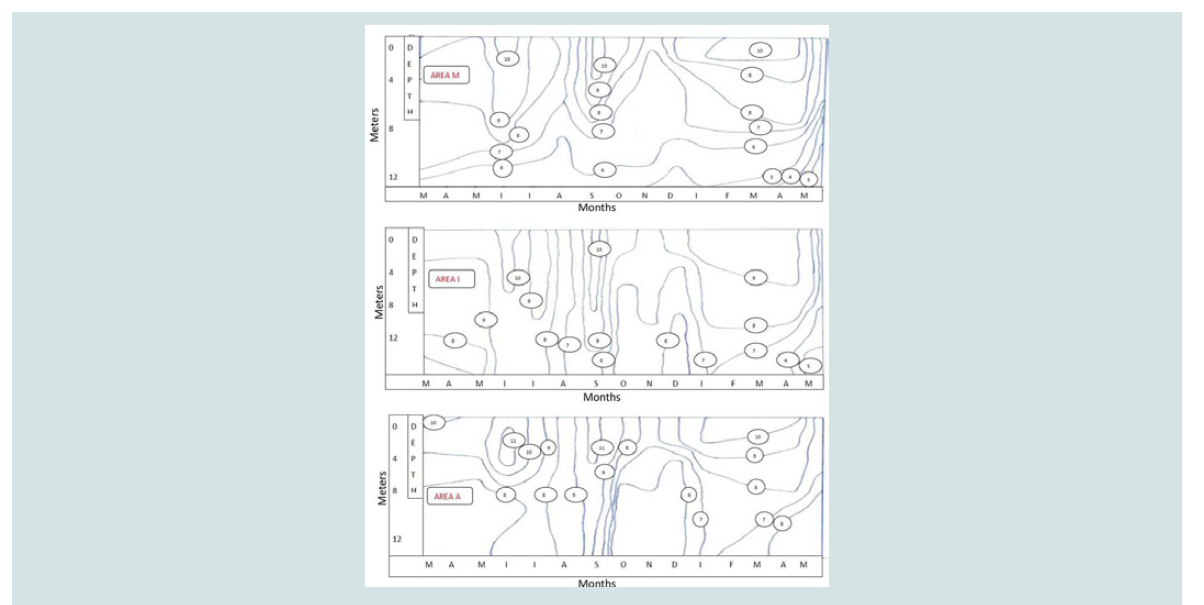 Figure 2: Dissolved Oxygen variation with depth at different months in sea water: coast (area A), mussel culture (area M) and reference area (area I).
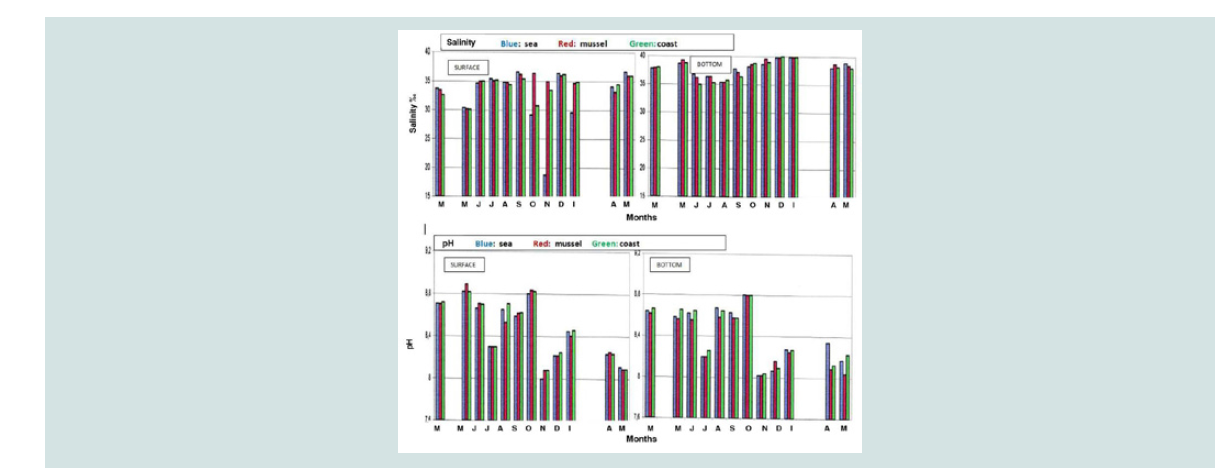 Figure 3:Monthly variation of pH and salinity (‰).
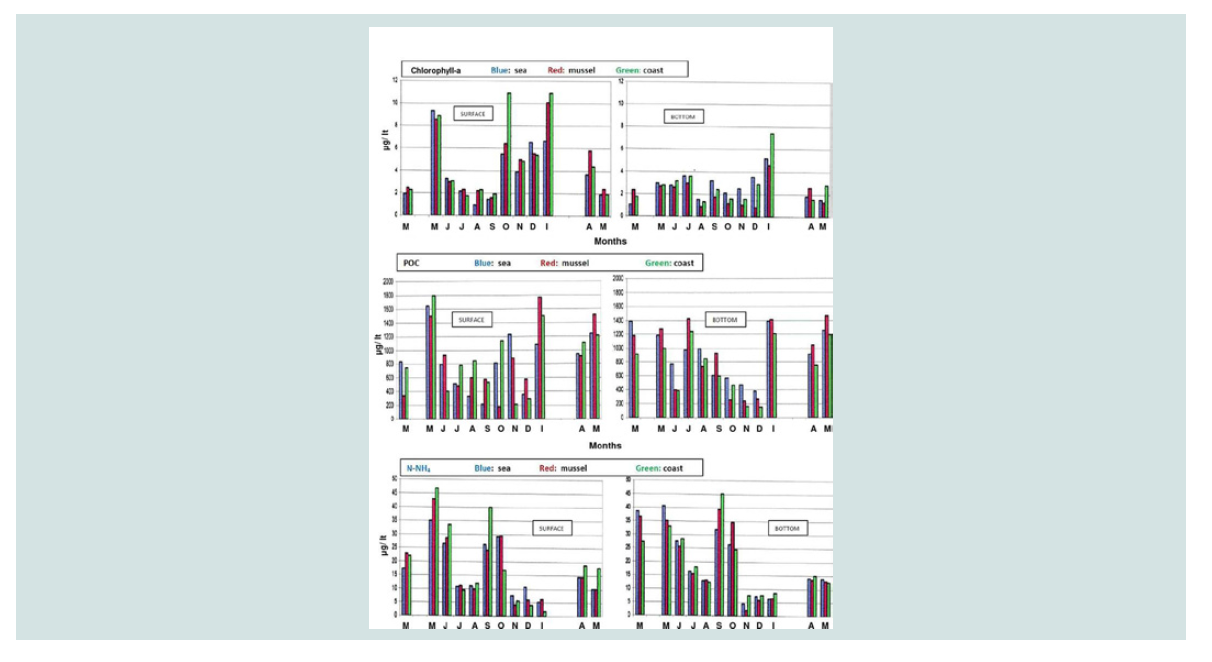 Figure 4: Monthly variation of a, POC, N-NH4 (μg/lt).
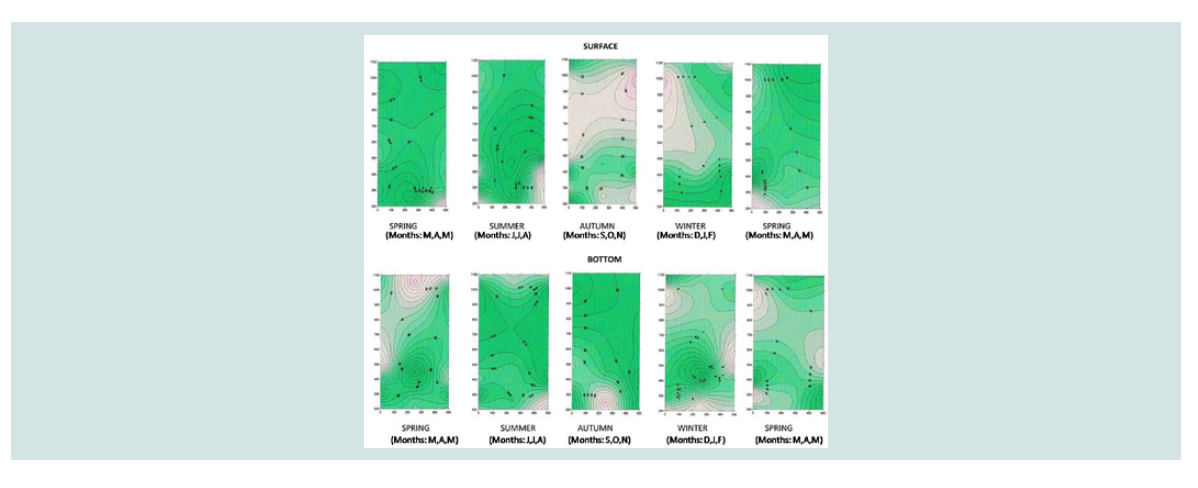 Figure 5: Seasonal variation of ΝΗ4 (μg/lt).
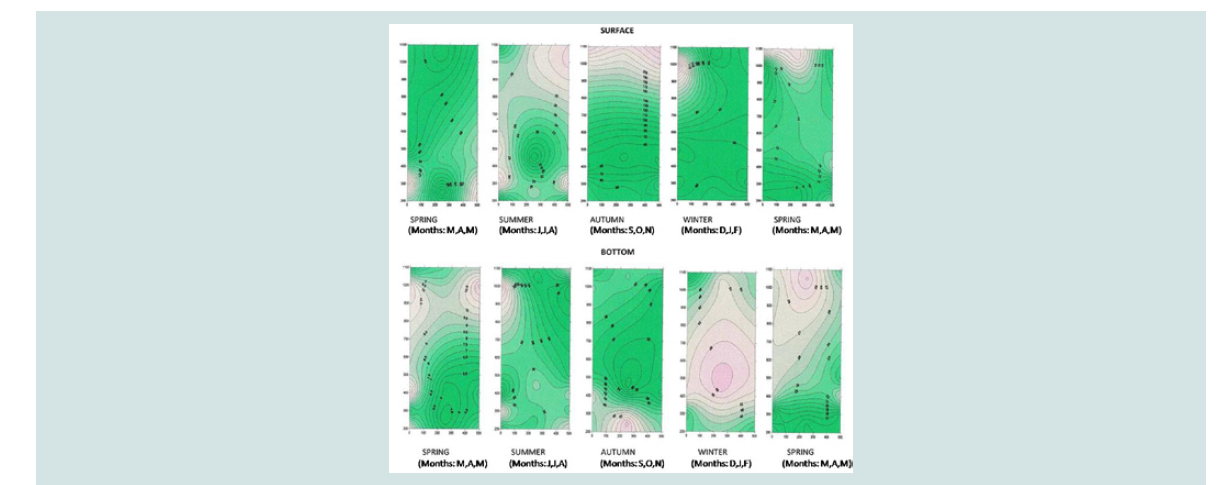 Figure 6: Seasonal variation of N-NO3 (μg/lt).
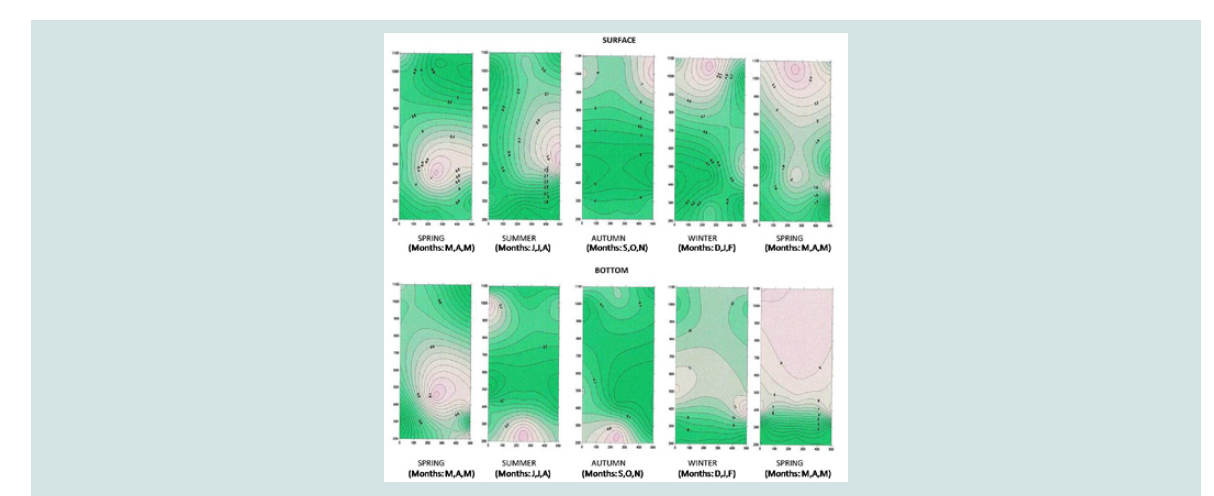 Figure 7: Seasonal variation of Ν-NO2 (μg/lt).
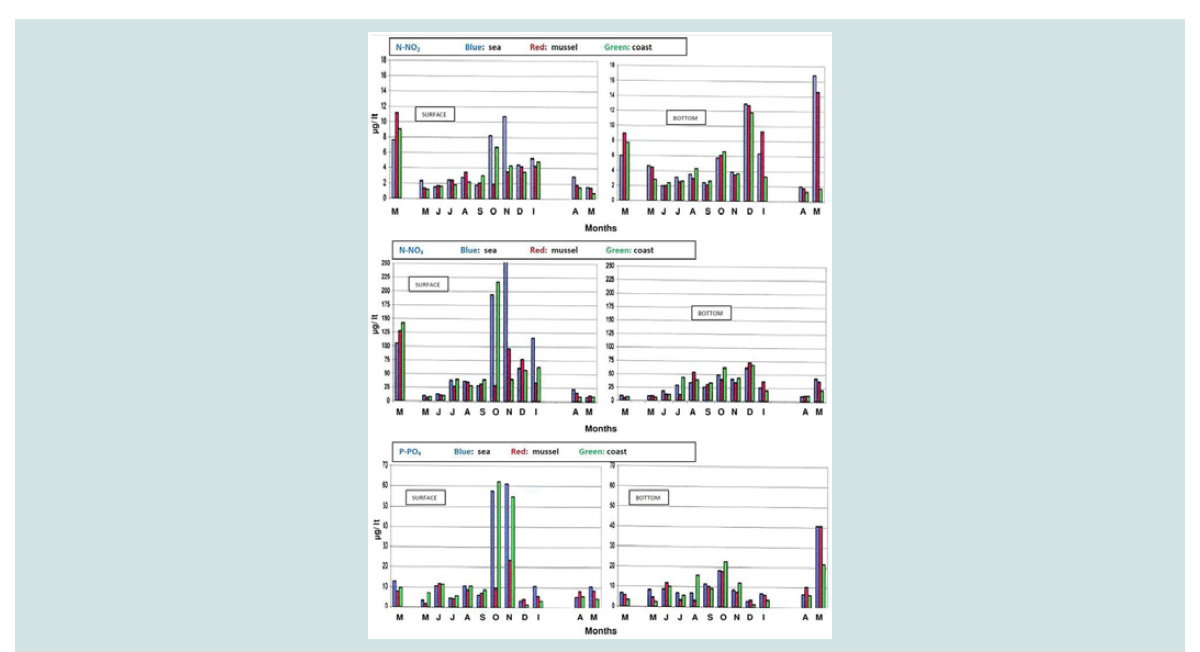 Figure 8: Monthly variation of N-NO2, P-PO4, N-NO3 (μg/lt).
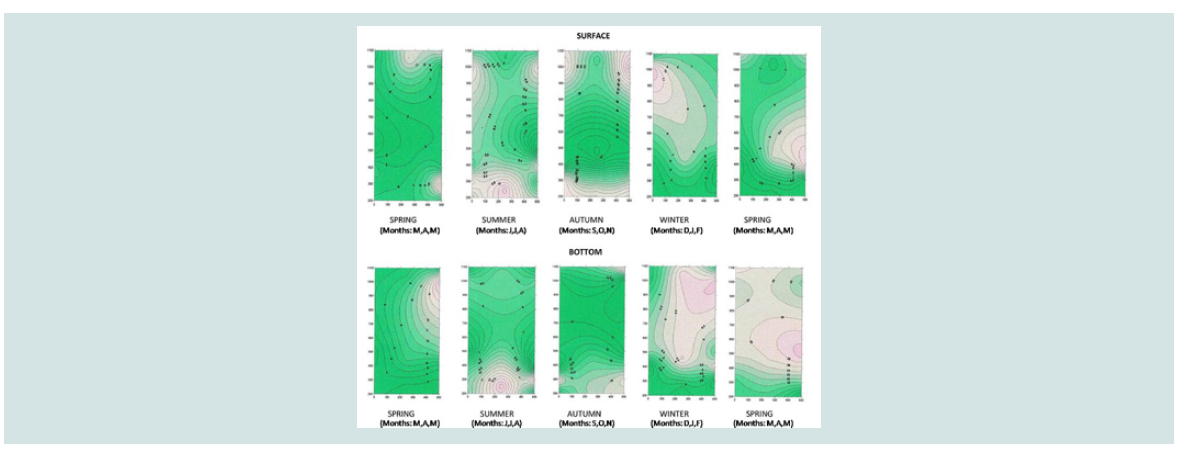 Figure 9: Seasonal variation of P –PO4 (μg/lt).
 Figure 10: Seasonal variation of a (μg/lt).
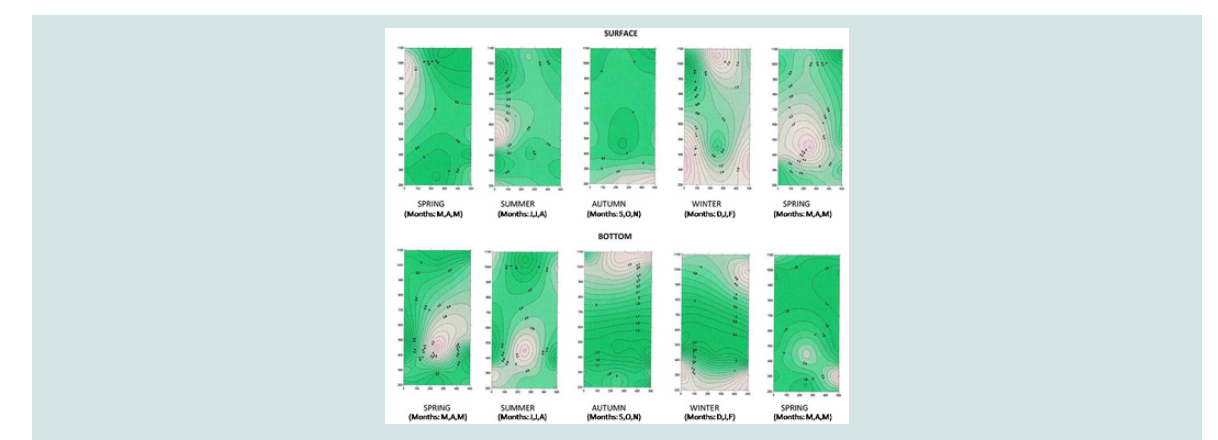 Figure 11: Seasonal variation of POC (μg/lt).
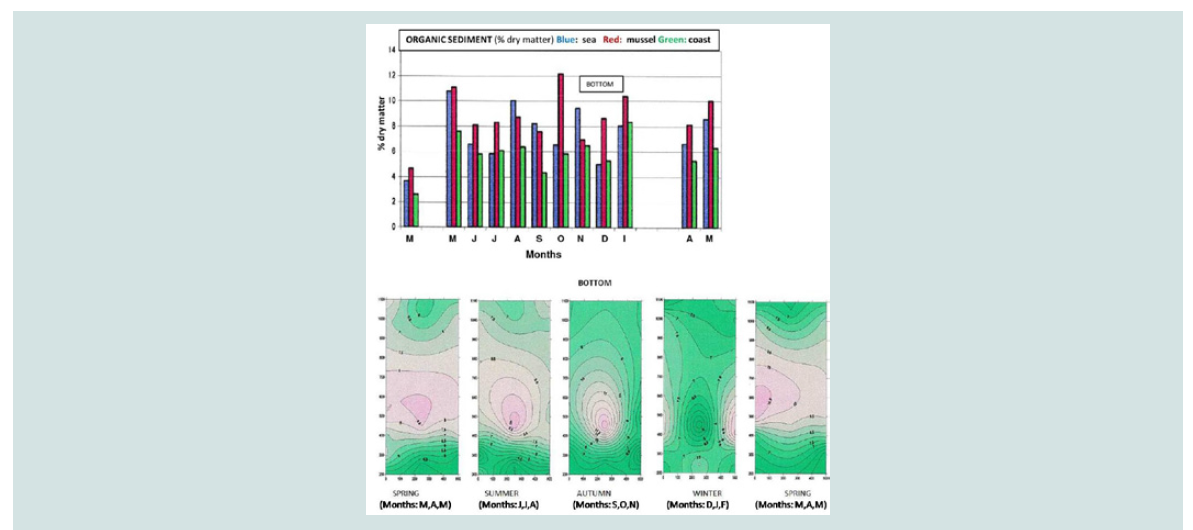 Figure 12: Monthly and seasonal variation of organic sediment (μg/lt).
Research Article
Potential Impacts of Mediterranean <em>Mytilus Galloprovincialis</em>Mussel Farming in a Specific Area of Aegean Sea
Katsoulis K* and Rovoli M
Biochemistry Department, University of Thessaly, Greece
*Address for CorrespondenceKatsoulis K, Faculty of Veterinary Science, Biochemistry Department, University of Thessaly, Greece, E-mail: kkatsoulis@uth.gr
Submission: 9-October, 2019
Accepted: 29-October, 2019
Published: 01-November, 2019
Copyright: © 2019 Katsoulis K, et al. This is an open access article
distributed under the Creative Commons Attribution License, which
permits unrestricted use, distribution, and reproduction in any medium,
provided the original work is properly cited.
Abstract
Intensive mussel cultures have an negative impact on the quality
of the aquatic environment, mainly by depositing faeces, pseudo
faeces and dead mussels in the sediments. Biodeposition can alter
the characteristics of the sediment below culture systems. The organic
enrichment of sediment under the mussel culture results in a reduction
of dissolved oxygen in the water, with undesirable effects in mussel
production and in water quality of the aquatic environment.
The aim of this research is to present the impact of long line
Mediterranean mussel culture of Mytilus Galloprovincialis in aquatic
ecosystem. Our results demonstrate the organic enrichment of mussel
culture in relation to the reference area and to the coast, resulting in
the lower concentrations of dissolved oxygen in the water. The release
of P-PO4 under the mussel culture and the lower concentrations of
chlorophyll-a due to the consumption of phytoplankton organisms by
mussels were also confirmed. Finally, the concentrations of nitrogen
nitrite and nitrate didn’t show statistically a remarkable change.
Keywords
Mussel cultures; Dissolved oxygen; Mytilus galloprovincialis; Organic sediment; Particulate organic carbon
Introduction
In various countries, the contribution of aquaculture to the
economic development has been an undeniable fact. In Greece indeed
there has been a tremendous growth in aquaculture, including the
cultivation of mussels, since the mid-1980s. The significant growth
of mussel cultures in our country is mainly due to its simplicity of
applying longline mussel culture, secondly due to the relatively low
plant and production costs, because mussels do not require external
feed input, and finally due to the favorable environmental conditions.
Mussel cultures help coastal waters against excessive
phytoplankton blooms in response to anthropogenic actions resulting
in eutrophication. Furthermore, an enhancement of water clarity due
to filtration allows deeper light penetration and increase the growth
of seagrasses [1].
Despite the growing interest in mussel farms, there is an increasing
concern about the effects that shellfish farming may be having on the
environment. A concentration of mussel culture activity makes the
area where applied most susceptible to environmental problems in a
variety of ways [2].
The impact of mussel culture is due to the increased nutrient
loads, particularly organic phosphorus and nitrogen and inorganic
nitrogen (ammonia) that might easily induce eutrophication [3].
Due to the high biodeposition, mussel farms create sediments that
are characterised by suboxic to anoxic conditions [4]. Βiodeposition
processes affect environmental conditions in a wider area [5]. Mussel
farms also result in a concentration and redistribution of nutrients.
Conditions of localised enrichment can arise through excretion of
dissolved inorganic nutrients into the water column and increased sedimentation of organic material below the farms in the form of
faecal and pseudofaecal materials, dead mussels and associated
epibiota. Sedimentation rates have been reported to be two to three
times higher underneath the mussel farms compared to ambient rates
outside the cultures [6].
The aim of this study was to evaluate the impact and the extent of
influence of mussel culture on the quality of the aquatic ecosystem in
a specific area of Aegean Sea (Prefecture of Pieria). Physico-chemical
parameters: temperature, dissolved oxygen, salinity, pH, ammonium
nitrogen, nitrite nitrogen, nitrate nitrogen, orthophosphate
phosphate, particulate organic carbon and organic sediments and
phytoplankton biomass (as chlorophyll-a) were investigated in order
to evaluate water quality.
Materials and Methods
Mussel culture:
In our study the Mediterranean mussel Mytilus Galloprovincialis
was used, which is the cultivated species in Greece and more generally
in the Mediterranean area. This species is ideally developed in the
climatic and physico-chemical conditions that exist in the marine
environment of our country. Specifically, it grows in waters with a
salinity of 32-37‰ while it survives without problems and in sea
waters which salinity ranges from 22-42‰. In addition to salinity, the
temperature also plays an important role to the growth of the mussel.
The temperature ranges from 10 and 26 °C with an excellent of 15-19
°C and the pH value ranges from 7.0 to 8.3 [7-10].
The mussel culture was selected in a specific marine area of the
Prefecture of Pieria (Makrygialos- latitude: 40° 24’ 51, 8688”N, 22°
36’ 39, 4848”E). The mussel culture was of the “long line” (floating)
type, four years of age and productivity per row of 15 tons. The
distance between the rows of the culture was 5-7 m. The distance of
the aquaculture from the coast was 500 m and its depth water was
12-14 meters.
From March to May of the next year, twelve monthly samples
were taken (one per month: March: M, April: A, May: M, June: J, July:
J, August: A, September: S, October: O, November: N, December: D,
January: J, February: F, March: M, April: A, May: M). Due to adverse
weather conditions, no measurements were made for three months.
Collection of water and sediment samples was made in three different regions:
A (coast): Area, 300 meters from the coast.
M (mussel culture): Area of mussel cultivation, which was 500
meters from the coast.
I (reference area): An area that was about 1,000 meters from the
coast.
Samples of water were collected from 5 different points from both
the sea surface and the bottom (10 to 20 cm above the sediment) in
each area (A, M, I). A Niskin (General oceanics, inc.) water sampling
probe was used for water sampling, with a capacity of two liters, and
an Ekman type sampler was used in order to collect sediment.
Physico - chemical variables:
The variables that were examined to determine the water and
sediment quality were: temperature, dissolved oxygen, salinity,
pH, ammonium nitrogen, nitrite nitrogen, nitrate nitrogen,
orthophosphate phosphate, chlorophyll- a, particulate organic
carbon and organic sediments.
On-site dissolved oxygen and water temperature measurements
were made by means of a portable oxygen meter (WTW type OXI96).
The dissolved oxygen and temperature measurements were carried
out every two meters depth in order to draw their vertical distribution
into the water column. The pH measurement was determined
by WTW’s portable pH meter, while salinity was determined by
ATAGO S/Mill Salinity Portable Salinity Meter 0-100. The water
and sediment samples were transferred to 2.5 liter glass containers
at the Laboratory of Ecology and Environmental Protection of the
Department Veterinary University of Thessaloniki.
The water sample bottles were immediately returned to the laboratory in insulated containers. These samples were filtered within
3h of collection through Whatman GF/C glass-fiber filters. Samples
were kept frozen until analysis of chlorophyll-a, N-NO3, N-NH3,P-PO4, POC, N-NO2. Chlorophyll-a was determined by filtration of
the water sample and its concentration in the extract was determined
spectrophotometrically 665 nm. Determination of P-PO4
was based
on the reaction of the ions with an acidified molybdate reagent to yield
a phosphomolybdate complex, the extinction of which was measured
at a wavelength of 880 nm. Determination of N-NH4
was based on
the reaction of phenol and hypochlorite to form indophenols. At a
wavelength of 630 nm the absorbance against a blank sample and a
series of solutions of known concentration in ammoniacal nitrogen
was used to determine the standard reference curve. Determination
of N-NO3 and N-NO2 was based using the appropriate method.
The nitrate was reduced to nitrite when the water sample ran
through a column containing amalgamated cadmium filings. The
produced nitrite was determined by diazotizing with sulphanilamide
and coupling with N-(1-naphthyl)-ethylenediamine to form a
coloured azo dye, the extinction of which was measured at 543 nm.
Determination of particulate organic carbon was done by wet ashing
with a mixture of potassium dichromate and concentrated sulphuric
acid. The absorbance of the sample was measured at a wavelength of
440 nm. The Standard Methods technique was applied to calculate
sediment organic (% dry matter). According to technique the sample
was initially dried at 103 °C to constant weight and then the analysis
is continued with the combustion of the sample at 550±50 °C [11-14].
Statistical analysis:
ANOVA method was used in order to evaluate the possible
interaction between the factors of “area”, “depth” and “time” factors
in the formulation of the physicochemical and biological parameters
that was studied. At the same time, one-way analysis (ANOVA) based
on either time or region was used with or without the transformation
of primary data. Duncan’s multiple ranging control was used for the
cases of homogeneity, unlike the Kruskal - Wallis parametric control
method that was used for the cases of heterogeneity. Then the Mann
- Whitney control method followed. Finally for the factor depth the
t distribution method was used to statistically evaluate its fluctuation
differences. All significance checks were made at a significance level of
α = 5% and for the analysis the SPSS 8.0 statistical program was used.
A three-dimensional charting program, Surfer Version 7.00, Surface
Mapping System (Golden Software Inc. 1999), presents the seasonal
and spatial distribution of parameter values that were measured at
the surface and at the bottom of the research area of coast, mussel
and sea. The horizontal x-axis represents the parallel offshore of
500 meters, while the y-axis represents the vertical distance from
the shore of 1.100 meters. In particular, the sampling points for the
coastline are defined for the y-axis in the 200 to 300 meter zone, for
the mussel cultivation in the zone between 450 and 550 meters, while
for the sea in the zone between 900 and 1,000 meters. The coordinates
of the sampling points for the x axis are those of 0 meters, 250 meters
and 500 meters. Strongly colored red areas show the highest seasonal
concentrations of the variables [15-17].
Results and Discussion
Temperature:
The temperature of the water which ranged from 10-26 °C is
considered satisfactory for the survival of the mussels. According
to the isothermal curve diagrams referring to time, no changes
are observed between the three sampling areas. Also no thermal
stratification was observed, since the vertical lines in the isothermal
curve diagrams indicate the mixing of the water due to the current
flow. High temperatures (24 to 25 °C) at the bottom during the
summer months help aerobic decomposition of organic matter resulting in oxygen consumption (5.5-6.5 mg O2/L) and the increase
in concentrations of ammonium nitrogen (Figure 1).
Soluble oxygen (mg O<sub>2</sub> /L):
higher in the surface of the three areas (9-13 mg/L), which is
attributed mainly to the high photosynthetic activity of phytoplankton
organizations. On the other hand, lower oxygen values were found
at the bottom of mussel cultivation (3 mg/L). The decomposition of
organic substances that were accumulated at the bottom by metabolic
excretions of mussels (faeces and pseudo-faeces) and the deposition
of dead mussels explain low concentrations of dissolved oxygen.
Despite the consumption of dissolved oxygen from mussels, there
were no significant differences found on the surface of the water up to
five meters depth in all three sampling areas. This may be attributed
to high photosynthetic activity and to oxygen production, as well as
to the continuous flow of water from the currents. Other researchers
found an increased consumption of oxygen due to the degradation
of the organic substance that was accumulated in the sediment in the
form of faecal and pseudo-faecal matter [15,18-20].
The elevated temperatures that were observed in July and August
(25 °C) in combination with the presence of organic (8.5% dry
matter) confirm the low oxygen concentrations during this period
in mussel culture (5 mg/L). Also, from February to May, the lowest
concentration in dissolved oxygen (3-4 mg/L) is found at the bottom
of mussel cultivation, which is attributed, despite the relatively low
temperature values, to the large quantities of organic material that
was found at the bottom (9.5% dry matter) (Figure 2).
A further reduction of dissolved oxygen in sediments is likely to
create anaerobic conditions for the degradation of organic matter and
for the formation of toxic gases such as methane (CH4), hydrogen sulfide (H2S), creating problems to the environment as well as to
the mussel culture itself. The fact that no anaerobic conditions were
found at the bottom is due to the young age of culture and possibly to
the streams that partially disperse its organic bottoms.
The results are similar to the findings of other researchers which
indicate that the oxygen is used by mussels for the basic functions
(breathing and filtering). In contrast, another research did not show a
significant change in the concentration of dissolved oxygen in water
despite the presence of mussels (D.p.), which was attributed in the
continuous flow of water currents [21-26].
pH:
The highest values (8.6 to 8.8) that were observed on the surface
of the three areas in relation to the bottom may be attributed to the
photosynthetic activity of the autotrophic phytoplankton organisms.
On the contrary, the decomposition of organic material that was
accumulated at the bottom in the form of faeces and dead mussels
contributes to lower pH values at the bottom [22,25]. However, pH
values were appropriate for the growth of mussels (Figure 3).
Salinity:
Salinity values ranged within the limits of mussel growth, with an exception in November where low values (18‰) were found in the
sea. This decrease in salinity is probably due to the large rainfall of
the previous month and to the possible inflow of fresh waters from
neighboring rivers. On the contrary, the gradual increase in salinity
in June (from 30‰ in May to 35‰) may be due to the low rainfall in
May and το the low inflow of fresh water from neighboring rivers. The
heavy rainfall that was observed in February may have contributed
to a decrease in salinity in the coming months (30‰ to 33‰). The
lowest values that were observed on the surface in all three regions
compared to corresponding of bottom were expected, since fresh
water as lighter remained on the surface (Figure 3).
Ammonium nitrogen (mg N-NH<sub>4</sub>/L):
Higher concentrations of N-NH4 were found at the bottom
compared with the concentrations found at the surface at the three
sampling sites (Figure 4). Particularly in the summer (July and
August), the concentrations of ammonium nitrogen in the bottom
(15.52±1.02 mg/L and 13.12±1.14 mg/L, respectively) were higher than those in mussel culture on the surface (11.23±1.51 mg/L and
9.97±1.25 mg/L respectively).
This fact may be attributed to the degradation of organic matter
in the sediment. The seasonal and spatial distribution of the ammonia
nitrogen concentration is shown in the three-dimensional graph
of ammonium nitrogen (Figure 5). This figure shows the highest
concentrations of ammonium nitrogen in the bottom of the three
areas in the summer months, as well as the highest concentrations at
the bottom of mussel cultivation in September (39.4±5.6 mg/L and in
October (34,67±3,88 mg/L).
The highest concentrations of ammonium nitrogen, although not
statistically significant, that were found on the mussel area relative to
the reference area in March, May, June and July, may be attributed to
the release of ammonium nitrate by mussels. Ammonia release from
mussels due to degradation of dead mussels is also noted by other
researches [5,22-24,27-31].
Nitrite and nitrate nitrogen (mg N-NO<sub>3</sub> /L, mg N-NO<sub>2</sub> /L):
Nitrate nitrogen was found to be at higher concentrations in area
I (from 8.19 to 469.96 mg/L) and in the coast (from 8.12 to 217.4
mg/L) compared to the concentrations in the mussel culture (from
6.51 to 127.44 mg/L).
This is probably due to increased inflows of nitrate water from the
rivers firstly due to heavy rainfall and secondly due to the reduction
of the speed of sea currents in mussel farming. At the bottom, nitrate
nitrogen concentrations were lower than those on the surface, while significant differences were observed between the three regions. The
above is illustrated in the three-dimensional graph of seasonal and
spatial distribution of the nitrate nitrogen concentration (Figure 6
and Figure 7).
The highest concentrations were observed on the surface of the
sea due to the possible inflow of nitrate waters from adjacent rivers.
However, the increase in nitrogen nitrate concentration that was found
mainly in the bottom of mussel culture in December (72.45±1.86 mg/
L) and January (37.71±3.02 mg/ L) can to be attributed to nitrification of its nitrogen ammonium as a result of the decomposition of organic
substances.
Nitrogen nitrate concentrations were at higher values particularly
in December (12.81±0.88 mg/ L), January (9.28±0.11 mg/ L) and May
(14.6±0.35 mg/ L) at the bottom compared to the surface (Figure 8).
This increase is probably due to the decomposition of the organic
material that was deposited at the bottom. Other researchers support
that the increased nitrate and ammonia concentrations are attributed
firstly to the reduced number of phytoplankton organisms (due to
their consumption of mussels), secondly to the excretion of organic
material from the Dreissena polymorpha mussels and finally to the
degradation of dead mussels [31-33].
Phosphorus of orthophosphate ions (mg P-PO<sub>4</sub> / L):
Phosphorus of orthophosphate ions was detected on the surface
at higher concentrations in the sea (from 3.23 to 61.28 mg/ L) and in
coast (from 1.65 to 62.44 mg/ L) than in the mussel culture (from 1.88
to 23.68 mg/L), particularly in October and November. This is mainly
attributed to the influx of nutrients components from neighboring sources, in combination with the movement of the sea currents (B -
NW winds)
In contrast, the bottom compared to the surface shows an
increase in the concentration of phosphates in mussel culture,
particularly in June (12.03±1.99 mg/ L), April (10.23±4.25 mg/ L) and
May (40.81±2.5 pg/ L) (Figure 8). These results support the general
findings of other researchers about the rich mussel excretions in
nutrients. The above is also illustrated in the three-dimensional graph
of seasonal and spatial distribution of phosphorus concentration of
orthophosphate ions (Figure 9).
The increased concentrations of phosphate in October and
November are combined both with increased concentrations of nitrate
during the same months and with a gradual increase in chlorophyll
from October to December. The decrease that was observed in June
is attributed to nitrogen intake of diatoms and macrophytes and
supports the general findings of other researchers [22,2526,30,31,34-37].
Chlorophyll-a:
Higher concentration of chlorophyll a was found on the surface
of mussel culture compared to the reference area and to the coast for
five out of the total twelve of months that the sampling lasted. No
differences were found between mussel culture and reference area,
apparently due to overexploitation of phytoplankton organisms from
phosphate and nitrate inflows from neighboring rivers and due to
surface currents. The consumption of phytoplankton from mussels is
evident from the findings at the bottom where in most months (except
March and April) there is a decreased concentration of chlorophyll a
in mussel culture compared to the coast and the sea (Figure 4). The
decrease in chlorophyll a is in an agreement with other researchers
[30,38-41].
The increased concentrations of phosphate in October and
November in the sea and near the coast are combined with increased
concentrations of nitrate nitrogen over the same months and explain
the gradual increase in chlorophyll from October 6.43±0.5 mg/ L) until January (10.07±0.88 mg/L). The above is also evident in the
three-dimensional graph of seasonal and spatial distribution of the
chlorophyll- a concentration (Figure 10).
Particulate Organic Carbon (μg C/ L):
Particulate Organic Carbon (POC) was measured on the surface at
higher concentrations in mussel culture (from 178.2 to 1768.8±233.4
μg/ L) and near the coast (from 213.84 to 1797.8 μg/ L) (Figure 4).
At the bottom, increased concentrations in mussel culture compared
to the coast and in the sea were observed in May, July, September,
January, April and May, but these increases were not statistically
significant. High concentrations at the bottom should be mainly due
to the sedimentation of organic material derived from mussel cultures
in the form of faeces and dead mussels. The three-dimensional graph
of seasonal and spatial distribution of the particulate organic carbon
concentration the increased concentrations of particulate organic carbon at the bottom of mussel culture (Figure 11), due to the
excretion of faecal matter as well as due to dead mussel deposition.
Also, the reduced concentration of particulate carbon on the
surface of mussel cultivation for some months is attributed to
phytoplankton consumption by mussels and is directly related to
the reduced concentration of chlorophyll. In July and September,
with high metabolic activity, there is an increase, not statistically
significant, of particulate organic carbon at the bottom of mussel
culture. The presence of high densities of the Dreissena polymorpha
mussel population in other research resulted in a constant increase
of the flow of particulate material from the water column to the
sediment, especially in the summer period. The high value of
particulate carbon that was observed in mussel culture and in the
reference area in January coincides with the increased concentration
of chlorophyll due to the low consumption of phytoplankton from
mussels. From November to January, POC was measured at higher
values in the surface than the bottom, which is attributed to the
decline in phytoplankton consumption by mussels.
Organic sediments (% dry matter):
Organic sediments have been found at higher values for several
months in mussel culture compared to the coast and the sea. The
statistically significant differences between mussel culture and coast
as well as between mussel and sea are apparently due to the organic
material that was deposited at the bottom in the form of fecal and
pseudo-faecal as well as dead mussels. The three-dimensional graph
of seasonal and spatial distribution of the organic concentration
illustrates the elevated concentrations of organics at the bottom of
the mussel culture apparently due to the deposition of faecal matter
and mussels (Figure 12).
Charging the bottom of mussel cultivation from organic material
has led to reduced concentrations of dissolved oxygen in this area
and to a higher concentration of ammonium nitrogen in the bottom
rather than the surface. In July and in August, higher concentrations
of ammonium nitrogen at the bottom that were observed over the
surface, may be attributed to the degradation of sedimentary organic
matter, which was trapped due to reduced currents from the coast to
mussel culture. Thus, the concentration of ammonium nitrogen in
culture in July from 11.2 μg/L on the surface increases to 15.5 μg/L,
while in August it increases respectively from 9.9 μg/L to 13.1 μg/L.
At the same time, the concentration of dissolved oxygen in water is
maintained at low levels (5 μg/L). Other researchers have shown that
the organic content of the sediment increases with the deposition
of faeces and pseudofaeces, resulting in an increase in microbial
activity and to the consumption of a higher amount of oxygen due to
degradation of organic substance [40,42-47].
Conclusion
This study indicates that mussel culture greatly influenced the
quality of the aquatic environment and the characteristics of the
underlying sediments regarding the biological and physico-chemical
parameters. The effects of mussels on nutrient cycling include
marked changes in the nitrogen (form of N-NO3, N-NH3
, N-NO2)and phosphorous distribution (form of P-PO4) both at surface and
bottom. The ammonium excreted by mussels is immediately available
for primary production; therefore mussels have a positive effect on primary production by increasing the nitrogen turnover in the
water column. The release of P-PO4
under the mussel culture and
the lower concentrations of chlorophyll a due to the consumption
of phytoplankton organisms by mussels were also confirmed.
Higher concentrations of organic material and particulate organic
carbon demonstrate the organic enrichment of mussel culture in
relation to the reference area and to the coast, resulting in the lower
concentrations of dissolved oxygen in the water. Further reduction
of dissolved oxygen in sediments due to the accumulation of organic
material over the years can create anaerobic conditions for the
degradation of organic matter.
References
Acknowledgment
Special thanks and sincere appreciation to late Professor S.
Kilikidis†
and Professor A. Kamarianos, Former Director of
the Laboratory of Ecology and Environmental Protection
of the Department of Veterinary Medicine of the Aristotle
University of Thessaloniki for their assistance, use of
laboratory space and equipment.
Citation
Katsoulis K, Rovoli M. Potential Impacts of Mediterranean Mytilus Galloprovincialis Mussel Farming in a Specific Area of Aegean Sea”. J Veter
Sci Med. 2019;7(1): 10.