
Journal of Urology & Nephrology
Download PDF
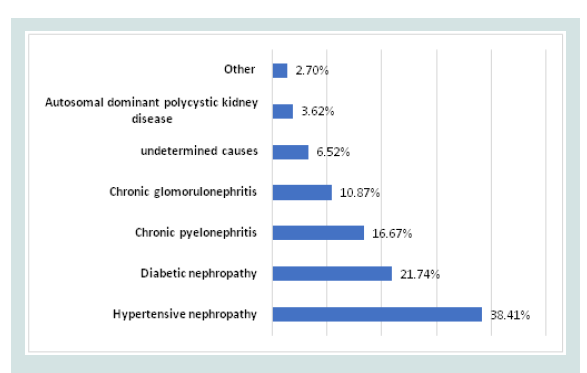 Figure 1: Distribution of patients according to different causal nephropathies.
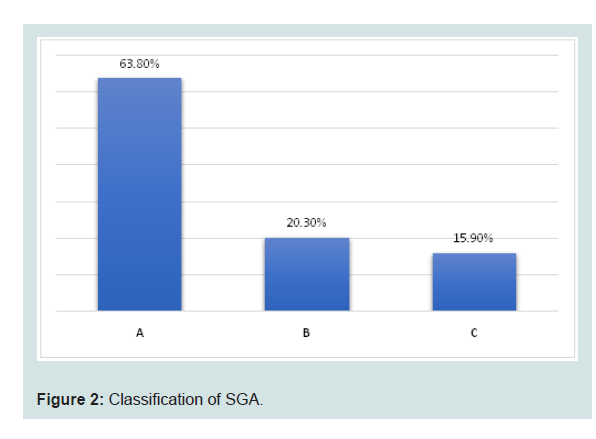 Figure 2: Classification of SGA.
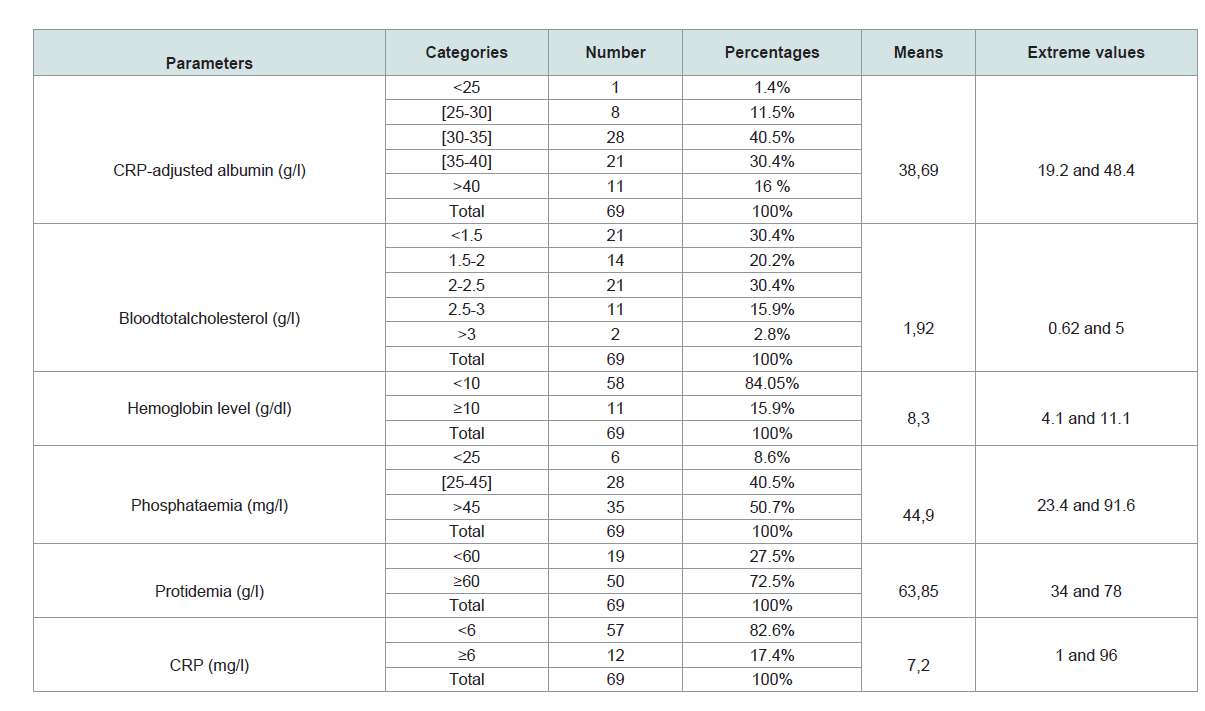 Table 1: Biological parameters of the study population.
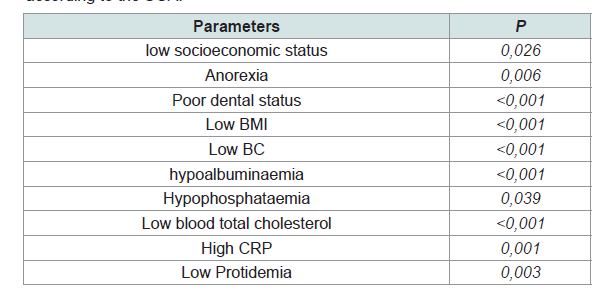 Table 2: Clinical and biological parameters associated with undernutrition
according to the SGA.
Table 2: Clinical and biological parameters associated with undernutrition
according to the SGA.
Research Article
Evaluation of the Nutritional Status of Chronic Haemodialysis Patients at Nouakchott National Hospital (Mauritania): Prevalence and Risk Factors for Undernutrition
Lemrabott AT1*, Faye M1*, Mah SM2, Lemrabott M2,Kane Y3, Soumaré AS1, Faye Mo1, Moussa TondiZM4, HAMAT I5, Guillaum MA5, Cissé MM1, Diouf B1 and Fary Ka EH1
1Department of Nephrology, Aristide Le Dantec University Hospital, Senegal
2Department of Nephrology, Nouakchott National Hospital Center,Mauritania
3Internal Medicine and Nephrology, Assane Seck University, Senegal
4Department of Nephrology and Haemodialysis, Faculty of Sciencesand Health of the
AdbouMoumouni University of Niamey, Niger
5Department of Nephrology and Haemodialysis, Chad
*Address for Correspondence: Lemrabott AT, Department of Nephrology, Aristide Le Dantec University Hospital 30, avenue Pasteur, BP: 3001, Dakar, Senegal, Tel: 00221338216773; E-mail: ahmedtall35@hotmail.com
Submission: 3 September, 2019;
Accepted: 19 September, 2019;
Published: 26 September, 2019
Copyright: © 2019 Lemrabott AT, et al. This is an open access article
distributed under the Creative Commons Attribution License, which
permits unrestricted use, distribution, and reproduction in any medium,
provided the original work is properly cited.
Abstract
Introduction: Protein-Energy Undernutrition (PEU) is common in chronic
haemodialysis patients and is an important contributor to morbidity and
mortality. However, limited data are available on the prevalence of
PEU in the dialysis population of Africa. The objectives of this study were
to evaluate the nutritional profile of chronic haemodialysis patients in
Nouakchott (Mauritania) to determine the prevalence of undernutrition in
this population and to identify predictive factors.
Patients and methods: This descriptive, analytical, cross-sectional
study was conducted from 12 January to 8 September 2015, and involved
patients on haemodialysis who regularly attended the haemodialysis unit
(at least 3 months) of the Nouakchott Hospital Center. The Subjective
Global Assessment (SGA) according to Detsky was used to assess the
nutritional status of patients. We also collected epidemiological, dialytical,
clinical and anthropometric data
Results: Sixty-nine chronic haemodialysis patients were included. The
mean age was 45.9 ± 14.08 years, and the sex ratio was 0.97. The mean
duration of haemodialysis was 27 months and 20 days. Anorexia was
found in 59.4% of cases, and the mean Body Mass Index (BMI) was 24.38
± 3.74 kg/m2. The average Branchial Circumference (CB) was 22.91 ± 3.6
cm. Patients showed mean albumin and haemoglobin levels of 38.69
g/L (range 19.2-48.4 g/L) and 8.3 ± 0.9 g/dL, respectively, and biological
inflammatory syndrome was found in 16.17% of patients. The prevalence of
malnutrition was 36.2%, which was classified as moderate in 20.3% of cases
and severe in 15.9% of cases. Malnutrition was found to be correlated
with a low socioeconomic status, anorexia, poor dental status, low BMI,
hypophosphatemia, hypocholesterolemia, high C-reactive protein CRP
and hypoprotidaemia.
Conclusion: The prevention of undernutrition through dietary
interventions must be at the heart of management for chronic
haemodialysis patients.
Introduction
Protein-Energy Undernutrition (PEU) results from an imbalance
between the contributions and requirements of the body, leading to
involuntary tissue loss with deleterious functional consequences [1].
This complication is common among chronic haemodialysis patients.
Despite advances in dialysis techniques, the prevalence of PEU in
this population remains high. It is estimated that 20-50% of chronic
haemodialysis patients suffer from PEU[2,3]. Despite regular dialysis,
nutritional imbalances are often reported due to inflammation,
infections, metabolic acidosis, gastro paresis in diabetic patients
and oxidative stress related to uraemia and can also be influenced
by the dialysis technique [1]. These factors may cause additional
complications and represent sources of morbidity and mortality in dialysis patients.
Nutritional evaluation in chronic dialysis patients is especially
challenging due to changes in hydration and protein and carbohydrate
metabolism secondary to renal failure. Thus, comparison of certain
parameters with the general population is not possible [4].
In Africa, limited data are available on PEU in the dialysis
population, and no previous studies have been conducted in
Mauritania. Thus, this study had the following objectives: to determine
the prevalence of undernutrition in this population, to evaluate their
nutritional profile, and to identify predictors of undernutrition.
Patients and Methods
This descriptive, analytical, cross-sectional study was conducted
in the haemodialysis unit of the Nouakchott Hospital Center
(Mauritania) from January 12 to September 8, 2015. Included were
patients who had been on haemodialysis for more than 3months. The
exclusion criteria were the refusal of patients to participate or severe
infection or surgery in the past 30 days.
The collection of data was based on a standardised survey form
which assessed different parameters including epidemiological,
clinical and biological data.
To evaluate the socioeconomic level, we used the socioeconomic
position index defined by Genoud in 2011 [5]. Patients were classified
as having a low, medium or high socioeconomic level
For the anthropometric evaluation, measurements were taken
immediately after the dialysis session. They included the Body Mass
Index (BMI) and muscle circumference, which was measured using a non-elastic tape measure. The Brachial Circumference (BC) was
measured midway between the acromion and the olecranon on the
opposite arm to the fistula. The Calf Circumference (CC) of the left
leg was measured at the maximum perimeter while the leg was bent
at a 90° angle.
The Subjective Global Assessment (SGA) according to Detsky
was used to assess the nutritional status of patients [6]. This measure
was used because the estimates were found to be very close to reality
in our chronic haemodialysis patients.
The elements taken into account in this study were as follows:
change in weight over the past 6 months (weight loss <5%, 6-10%,
>10%) and change over the past 2 weeks; changes in dietary intake
(no change, marked decrease, inability to eat); gastrointestinal
disorders (anorexia, nausea, vomiting, diarrhea, etc.); degree of
functional ability (from normal to bed rest); level of metabolic stress
(absent, moderate, intense); loss of subcutaneous adipose tissue
by the subjective clinical assessment of skin folds (quadricipital,
tricipital, pre-thoracic); muscle wasting (quadriceps, deltoids); and
the presence or absence of oedema of the ankles and/or as cites.
At the end of this evaluation, patients were grouped into three
classes (class A, B or C) based on their nutritional status. Patients
were classified as class A if they presented a normal nutritional
status (absence or low presence of signs), with no physical signs of undernutrition, significant weight loss (weight loss of 5-10% with
tendency to weight gain), food problems, functional discomfort or
gastrointestinal symptoms that may lead to undernutrition. Class C
indicated severe undernutrition (strong presence of signs), where the
patient presented physical signs of undernutrition (significant loss of
subcutaneous adipose tissue, significant muscle atrophy or oedema)
associated with continuous weight loss of at least 10% or a decrease
in food intake. Patients were classified as class B, indicating moderate
undernutrition (intermediate state), if they presented weight loss of
5-10% without a tendency toward weight gain, associated with the
slight loss of muscle or subcutaneous adipose tissue and a reduction
in food intake.
Indeed, class B is the most ambiguous, and patients in this class
could also present characteristics of the other categories. As a general
rule, if classifications C and A were not clear, the patient was classified
as category B.
The biological markers used were albumin, CRP, protidaemia,
total cholesterolaemia, urea, creatinine, phosphataemia, haemoglobin
and blood ionogram.
For statistical analysis, the collected data were captured and
analysed with SPSS statistics software (version 20.0). The qualitative
variables are presented as percentages and the quantitative variables
are presented as the average and standard deviation or with the
minimum and maximum values. The statistical analyses were
performed with cross-tabulations. To compare the frequencies, the
chi-square test, Fisher test or Student’s t-test were used. The difference
was statistically significant atp <0.05
The local ethics committee approved the study.
Results
Descriptive results:
Of the 128 chronic haemodialysis patients, 69 were included in
the study, representing 54% of the total population. The mean age
was 45.9 ± 14.08 years, with patients ranging from 16 to 75 years.
There was a slight female predominance of 50.7% (35 patients) versus
49.3% of males (34 patients), with a sex ratio of 0.97. Regarding
the socioeconomic level, it was high in 14.5% and low in 52.2% of
patients. Hypertensive nephropathy was the first causal nephropathy
followed by diabetic nephropathy (Figure 1). The average duration of
dialysis was 27 months and 20 days, with a maximum of 156 months
and a minimum of 3 months. The frequency of dialysis was twice per
week in 47.8% of patients (33 patients) and three times per week in
52.2% (36 patients). The vascular approach was Arteriovenous Fistula
(AVF) in 94.2% of patients and a temporary catheter in 5.8% of
patients.
Anorexia was found in 41 patients (59.4%). Out of the 69 patients
(39.1%), 27 ateless than three meals a day. A good dental condition
was found in 82.6% of our patients (57 patients), with a poor condition
found in 17.4% (12 patients).
The results of the nutritional status assessment according to
Detsky’s index is presented in(Figure 2). A normal nutritional
status (Class A) was reported in 44 patients (63.8%), while a state of
malnutrition (Classes B and C) was observed in 25 patients (36.2%). Of these, 14 patients (20.3%) had moderate (Class B) and 11 patients
(15.9%) had severe (Class C) malnutrition.
The average BMI was 24.38 ± 3.74 kg/m2, with a maximum of
34.19 kg/m² and a minimum of 16.14 kg/m2. Twenty-six percent of
patients had a BMI less than 20 kg/m2, and 15.9% had a BMI greater
than or equal to 25 kg/m2.
The average BC was 22.91 ± 3.6 cm, ranging from 16 to 31 cm.
ABC greater than 22 cm was found in 50.7% of patients. The mean CC
was 29.78 ± 4.3 cm, which ranged from 19 to 41 cm. A CC less than 31
cm was found in 40.6%.
The pre-dialytic biological data are presented in (Table 1).
Analytical results:
In the bivariate analysis, nutritional status according to the Detsky
Index was not significantly correlated with age (p = 0.172). Moderate
and severe undernutrition was present in 32% of males and 40% of
females, but this difference was not statistically significant (p = 0.792).
There was no significant correlation between malnutrition and poor
socioeconomic status (p = 0.026). The prevalence of undernutrition
was 0% in patients with a high socioeconomic status, 34.8% among
those with a moderate socioeconomic level and 47.2% among low
socioeconomic patients. Undernutrition was correlated with the
presence of anorexia (p = 0.006). A prevalence of undernutrition
of 51.2% was found in anorexic patients compared to14.3% in nonanorexic
patients. Undernutrition was correlated with a poor dental
status (p<0.001). The prevalence of undernutrition among patients
with a poor dental status was 75% compared to 28% in those with
a good dental status. There was no significant difference between nutritional status and the dialysis seniority (p = 0.526).
Undernutrition was associated with a low BMI (p<0.001). Thus,
undernutrition was found in all patients whose BMI was less than
18 kg/m2. A good nutritional status was noted in all patients with a
BMI greater than 30 kg/m2. However, 16.7% of overweight patients
(BMI of 25-30 kg/m2) were malnourished, and 77% of patients with
a BMI between 18-20 kg/m2 had a good nutritional status. A low
BC (p<0.001) was correlated with undernutrition. All patients with
a BC measuring <19 cm were malnourished. In contrast, 21% of
malnourished patients had a BC between 23-25 cm and 6.7% had a
BC greater than 25 cm.
The correlation between malnutrition and hypoalbuminaemia
was statistically significant (p<0.001). Undernutrition was observed
in all patients with albumin levels less than or equal to 25 g/L. It was
also present in 87.5% of cases with albuminaemia between 25-30 g/L
and in 50% of cases with albuminaemia between 30-35 g/L. Above 35
g/L, all patients had a good nutritional status. Undernutrition was also
correlated with hypophosphataemia (p = 0.039). Malnutrition was
found in 66.67% of patients with phosphataemia less than or equal to
45 mg/L compared to 32.8% for those with a phosphataemia greater
than 45 mg/L. A state of malnutrition was found in 85% of patients
with total cholesterol levels below 1.5 g/L, and a good nutritional
status was observed in the majority of patients with cholesterol higher
than 1.5 g/L. This difference was statistically significant (p<0.001).
Undernutrition was correlated with elevated CRP (p = 0.001), and
the prevalence of undernutrition in patients with CRP greater than or
equal to 6mg was 82% compared to a prevalence of 26% among those
with a CRP of less than 6mg. Hypoprotidaemia was significantly
associated with malnutrition (p = 0.003). Undernutrition was found in 79% of patients with protidaemia of less than 60 g/L compared to18% of those with a protein level of 60 g/L or more. The clinical and biological parameters associated with undernutrition in our study population, assessed by Detsky’s SGA, are presented in (Table 2).
Discussion
In our study, the prevalence of global undernutrition according
to the SGA was 36.2%. This undernutrition was classified as moderate
in 20.3% and severe in 15.9% of patients. Our results are similar to
those evaluated using the same method (Detsky’s SGA) reported in
the literature (Table 2). In Senegal, a country bordering Mauritania,
the prevalence of malnutrition was reported to be 41.1% in 2013,
divided into moderate undernutrition in 28.36% and severe in 12.76% [7]. In Morocco, a study by Es-Sebbani reported an undernutrition
prevalence of 37% [8] with 22% of cases classified as moderate and
15% as severe. In 2007, a prevalence of 40.7% undernutrition was
found in Iran, of which 35.1% was mild to moderate undernutrition
and 5.6% was severe undernutrition [9]. A French multicentre study
conducted by the Nutrition and Hemodialysis Research Group on
7123 patients treated in 110 haemodialysis centers found an overall
prevalence of undernutrition of 20-36% at any age [10]. Other studies
in the literature indicate a very high prevalence of malnutrition
ranging from 31-75%, as evaluated by the SGA score [11].
The mean age of our patients was 45.9 ± 14.08 years, which is
comparable to other studies conducted in Africa, such as that
performed by Ondele in Senegal in 2013 on 141 haemodialysis
patients whose average age was 47.84 ± 14.79 years [7], and a study
by Es-Sebbani in Morocco with an average patient age of 48.4 ± 17.7
years [8]. In developed countries, the average age of haemodialysis
patients is relatively high. In France, the average age was found to be
65.7 years [12].
Our study, like those performed in Senegal and Morocco
[7,8], did not find a significant correlation between advanced
age and undernutrition. In addition, a higher prevalence of 50%
undernutrition, based on the SGA score, was found in patients
aged over 60 years. This high prevalence of undernutrition in
elderly subjects compared to other age groups has been reported in
the literature, as the study conducted in Senegal reported a similar
prevalence of 52.4% (evaluated by the MNA score). In addition, a
correlation between age and undernutrition has been observed in
other studies, such as one conducted in Brazil [13].
In our study, we found a significant correlation between
malnutrition, based on the SGA score, and a low socioeconomic
level, similar to a 2011 study conducted by Coimbra de Oliveira et
al. in Brazil [13]. In contrast, studies by Ondele et al. in Senegal and
Abu-Almakarem in Saudi Arabia did not observe this correlation
[7,14]. These differences could be explained in part by the use of nonconsensual
methods to assess the standard of living of our patients.
The average duration of dialysis in our patients was very low
compared to that found in Senegal, which was 86.5 months (7.3 years,
range 5 to 168 months) [7], and that of Morocco, which was 76.12
months (6.3 years, range 11 to 199 months) [8].
Consistent with the study by Es-Sebbani in Morocco [8], we did
not find a significant correlation between malnutrition, evaluated by
the GAS, and the seniority in dialysis. However, a correlation was
found by Ondelé in Senegal [7], as well as other authors [10,15].
The presence of anorexia and poor dental status were
correlated with malnutrition (according to the Detsky index)of
our haemodialysis patients, in accordance with studies by Ondelé
in Senegal [7], Es-Sebbani in Morocco and by Kalantar Zadeh and
Kopple in Philadelphia (USA) in 2004 [8,15].
The mean BMI of our patients was 24.38 ± 3.74 kg/m2, which
is similar to that reported in Senegal (24.11 ± 3.85 kg/m2) [6],
Morocco (23.13 ± 4.75 kg/m2) and Saudi Arabia (24.8 ± 3.6 kg/m2)
[8,14]. For patients with a BMI less than 20 kg/m2, the prevalence of undernutrition according to the GAS was 26%. In the literature, a
BMI less than 20 kg/m2 is consistently associated with an increased
risk of mortality and is a powerful independent predictor of mortality
risk in adult dialysis patients [15,18]. Several recent studies have confirmed the protective role of a high BMI in dialysis patients. For these patients, the threshold is 23 kg/m2, below which a marked increase in mortality is clearly observed [19]. In the bivariate analysis, we found a significant correlation between SGA undernutrition and low BMI, similar to other studies[7,8,13,15-17] .
In contrast to the study by Ondelé [7], CB was correlated with
undernutrition in our study and in the Es-Sebbani study [8].
Albuminaemia less than 35 g/L was found in 54.4% of our patients.
This rate is much higher than the rates found in Senegal (17.01%) [7],
Morocco (10.4%) and in the multicentric French GRNH study (20%)
[810]. This suggests that the majority of our patients had very low
albumin compared to the recommended level. This may reflect a diet
very low in protein, and probably occurs secondary to continuation
of the low-protein diet in our chronic dialysis patients.
Hypophosphataemia less than 25 mg/L was found in 9% of our
patients compared to 23.23% in Senegal and 8.8% in Morocco [7,8].
Undernutrition was significantly correlated with low phosphataemia,
as found in many studies[7,8,10,13,14].
A biological inflammatory syndrome was found in 16.17% of
cases, which is similar to the prevalence found by Ondelé in Senegal
[7].
In dialysis patients, the prevalence of chronic inflammation
with no identifiable infectious or neoplastic cause is important
and represents a cause of undernutrition. Chronic inflammation is associated with various complications, including increased anaemia
secondary to chronic kidney disease and impaired nutritional status
[20].
Conclusion
The prevalence of undernutrition in this population of chronic
haemodialysis patients in Mauritania was found to be as high as that
reported in other African studies. Undernutrition was correlated with
a low socioeconomic status, anorexia, poor dental status, low BMI, low
BC, hypoalbuminaemia, hypophosphoraemia, hypocholesterolaemia,
high CRP and hypoprotidaemia. A better understanding of the
underlying mechanism, as well as evaluation and early intervention
from the beginning of haemodialysis, are important to help prevent
undernutrition.
References
Citation
Lemrabott AT, Faye M, Mah SM, Lemrabott M, Kane Y, et al. Evaluation of the Nutritional Status of Chronic Haemodialysis Patients at Nouakchott
National Hospital (Mauritania): Prevalence and Risk Factors for Undernutrition. J Urol Nephrol. 2019;6(2): 5.