
Research Article
*Address for Correspondence: Maria Durisova, Department of Pharmacology of Inflammation, Institute of Experimental Pharmacology and Toxicology, Slovak Academy of Sciences 841 04, Bratislava, Slovak Republic, Tel: 421254775928;E-mail: Maria.Durisova@savba.sk
Citation: Durisova M. Three Examples Illustrating the Good Performance of an Advanced Mathematical Modeling Method Based on the Theory of Dynamic Systems in Pharmacokinetics. J Pharmaceu Pharmacol. 2015;3(1): 6.
Copyright © 2015 Durisova M. This is an open access article distributed under the Creative Commons Attribution License, which permits unrestricted use, distribution, and reproduction in any medium, provided the original work is properly cited.
Journal of Pharmaceutics & Pharmacology |ISSN: 2327-204X | Volume: 3, Issue: 1
Submission: 02 March 2015 | Accepted: 08 April 2015 | Published: : 13 April 2015
It is well known that dynamic processes associated with the pharmacokinetic behavior of an administered drug are controlled by several mechanisms and are influenced not only by diverse interactions between the drug administered and a physiological environment but also by various factors [2,3]. Since the pharmacokinetic behavior of an administered drug is a complicated dynamic process, dependent upon a variety of independent factors, several studies described investigations of the pharmacokinetic behavior of administered drugs in the body using advanced modeling methods based on the theory of dynamic systems, see for example, the following studies [4-17] and the references therein. Three examples illustrating a successful use of an advanced modeling method based on the theory of dynamic systems in pharmacokinetics are also given in the current study.


Three Examples Illustrating the Good Performance of an Advanced Mathematical Modeling Method Based on the Theory of Dynamic Systems in Pharmacokinetics
Maria Durisova*
- Department of Pharmacology of Inflammation, Institute of Experimental Pharmacology and Toxicology, Slovak Academy of Sciences 841 04, Bratislava, Slovak Republic
*Address for Correspondence: Maria Durisova, Department of Pharmacology of Inflammation, Institute of Experimental Pharmacology and Toxicology, Slovak Academy of Sciences 841 04, Bratislava, Slovak Republic, Tel: 421254775928;E-mail: Maria.Durisova@savba.sk
Citation: Durisova M. Three Examples Illustrating the Good Performance of an Advanced Mathematical Modeling Method Based on the Theory of Dynamic Systems in Pharmacokinetics. J Pharmaceu Pharmacol. 2015;3(1): 6.
Copyright © 2015 Durisova M. This is an open access article distributed under the Creative Commons Attribution License, which permits unrestricted use, distribution, and reproduction in any medium, provided the original work is properly cited.
Journal of Pharmaceutics & Pharmacology |ISSN: 2327-204X | Volume: 3, Issue: 1
Submission: 02 March 2015 | Accepted: 08 April 2015 | Published: : 13 April 2015
Abstract
The objective of the current study is to give three examples illustrating the good performance of an advanced mathematical modeling method based on the theory of dynamic systems in pharmacokinetics. The performance of the modeling method considered in the current study is illustrated in the following examples: 1) the first example illustrates the development of a mathematical model of the pharmacokinetic behavior of a drug administered orally; 2) the second example illustrates the determination of a physiologically realistic structure of the mean residence time of a drug administered orally; 3) the third example illustrates the development of a combined parent-metabolite mathematical model.In all examples, the mathematical models developed successfully fitted to the experimental data.
Keywords
Pharmacokinetics; Dynamic systems theory; Mathematical modelIntroduction
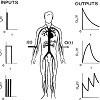
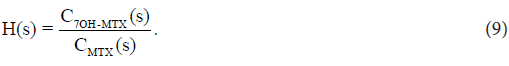
The basic idea behind the modeling method used in the current study may seem rather complicated. Over simplifying, this idea can be explained as follows: figure 1, (taken from the author’s web page http://www.uef.sav.sk/advanced.htm shows the working example used in the current study. The schematically illustrated drug administration is in the column headed “INPUTS”, and the schematically illustrated resulting plasma concentration-time profiles of the drug administered are in the column headed “OUTPUTS”. In the working example, the following key assumptions are applied: 1) a single bolus drug dose is administered intravenously to a hypothetical subject (see the first scheme in the column “INPUTS”); 2) a drug is administered by an infusion to a hypothetical subject (see the second scheme in the column “INPUTS”); 3) a drug is administeredby repeated multiple bolus doses to a hypothetical subject (see the third scheme in the column “INPUTS”); 4) the drug dose, the site of measurement of the plasma concentration-time profiles of the drug administered, and physiological properties of the body remind unchanged during the working experimentBy using traditional modeling methods such as compartment methods, significantly different models of the pharmacokinetic behavior of the drug administered are obtained. The reason for this is that compartment methods use only plasma concentration-time profiles of administered drugs. In the working example shown in [Figure1], the resulting plasma concentration-time profiles of the drug administered are different, therefore, the models developed by a compartment method are also different. On the contrary, modeling methods based on the theory of dynamic systems simultaneously uses both: the mathematically described inputs of drugs into the body and plasma (or blood) concentration-time profiles of drugsadministered. Models developed in this way are dependent only on physiological properties of the body, and on the ADME properties of the drugs administered. Therefore, the same models are obtained for the pharmacokinetic behavior of the drug administered, irrespective whether the drug is administered by a single-bolus dose, or by an infusion, or by multiple bolus doses, assumed in the working example shown in Figure 1. ADME is a well-known acronym commonly used in pharmacokinetics. It stands for absorption, distribution, metabolism, and excretion of a drug administered [1].
Figure 1: Working example showing schematically an intravenous drug administration to a hypothetical subject in a single bolus dose, by a constantrate short-time infusion, by repeated multiple bolus doses (the column “INPUTS”). Resulting plasma concentration-time profiles of the drug areschematically shown in the column OUTPUTS.
The modeling method used in the current study was developed by Dedík [7,8]. It has been effectively used in several studies; see for example, the studies cited in the previous paragraph. Using the modeling method considered here, investigations of dynamic systems can be performed in a variety ways. In pharmacokinetics, the given modeling method can be advantageously used to investigate the pharmacokinetic behavior of an administered drug in the following way: In the first step of an investigation, an ADME related dynamic system (thereafter only dynamic system) is defined in the complexdomain, and is used to mathematically represent static and dynamic aspects of the pharmacokinetic behavior of an administered drug in the body, see, for example, the studies cited in the previous paragraph. In the second step of an investigation, a mathematical model of the dynamic system is developed and point estimates of model parameters are determined in the complex domain, using the noniterative modeling method published previously [18]. In the third step of an investigation, an optimal model of the dynamic system is selected, using the Akaike information criterion modified for the use in the complex domain [6,19].
Examples
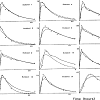
The first example illustrates the development of mathematical models of the pharmacokinetic behavior of pentacaine in healthy volunteers. Pentacaine is a long-acting carbanilate type local anaesthetic [20]. In the comparative study [4], the pharmacokinetic behavior of pentacaine in healthy volunteers was investigated using data collected during the clinical trial of pentacaine. A short description of the comparative study [4] is as follows: Pentacaine was orally administered to healthy volunteers. The modeling program CXT (based on the theory of dynamic systems) [7-10] and modeling program VisSim [21] were employed to develop mathematical models of the pharmacokinetic behavior of pentacaine in the healthy volunteers enrolled in the study [4]. The results obtained revealed that the best approximations of the plasma concentration-time profiles of pentacaine were obtained using the CXT in all healthy volunteers [4] (see figure 2, taken from the author’s previous study [4]).
The second example illustrates a section from the author’s previous study [15]. The section shown corresponds to the determination of the physiologically realistic structure of a mean residence time MRTpo of a drug administered orally in an immediate release dosage form to a hypothetical subject. The physiologically realistic structure of a meanresidence time MRTiv of an intravenously administered drug to a human subject was determined in the previous study by the author [14]. It is described by the following equation:
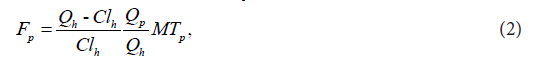
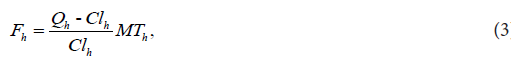
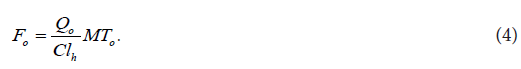
Five interconnected structural components related to the pharmacokinetic behavior of an intravenously administered drug to a human subject occur on the right-hand side of Eq. (1). The structural component Fcp describes the contribution to MRTiv by the dynamic process associated with the drug dynamic transit [22]in the cardiopulmonary subsystem Hcp [23]. (A subsystem of a dynamic system is a part of a dynamic system which itself has characteristics of a dynamic system). The structural component Fp describes the contribution to MRTiv by the dynamic process associated with the drug dynamic transit in the portal-venous subsystem Hp [24]. The structural component Fh describes the contribution to iv MRT by the process associated with the drug dynamic transit in the hepatic-portal subsystem Hp [22,24]. The structural component o F describes the contribution to iv MRT by the process associated with the drug dynamic transit in the subsystem . o H The subsystem o H mathematically represents drug fate and disposition in noneliminating tissues. If the drug is subject to the enterohepatic circulation (EHC) [25], the structural component r F describes the contribution to iv MRT by the dynamic process associated with the drug dynamic transit in the subsystem . r H The subsystem r H mathematically represents the dynamic process associated with EHC, and the structural components p F and 0 F are as follows:
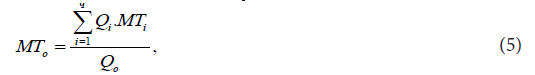
In Eqs. (2)-(4), p Q is blood flow in the portal vein, o Q is blood flow in non-eliminating tissues, h Cl is the hepatic clearance of the drug administered, p MT is the mean time of the drug dynamic transit in the portal-venous subsystem, h MT is the mean time of the drug dynamic transport in the hepatic-portal subsystem, and o MT is the mean time of the drug dynamic transit in the subsystem , o H where
and i MT is the mean time of the drug dynamic transit in noneliminating tissues, the i subscript specifies a tissue [24].
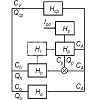
In order to mathematically represent dynamic processes associated with drug fate and disposition after an oral administration, the dynamic system po H was defined, and a circulatory model of the dynamic system po H was developed. The developed circulatory model of the dynamic system po H is diagrammed in Figure 3, which was taken from the previous study by the author [15], preformed under equal condition as the current study. The study cited here can be briefly described as follows: The determination of the physiologically realistic structure of po MRT was performed in the following steps: In the first step, a working example was prepared and used to schematically illustrate the drug dynamic transit [22] in the body after an oral administration to a hypothetical subject. In the second step, the following simplifying assumptions were made: a) the drug was uniformly distributed in the body; b) the drug was eliminated mainly by hepatic excretion; c) the drug was not bound to plasma proteins or tissues; d) the drug was completely dissolved in the stomach, and emptied into the duodenum; e) no barriers to the distribution (or elimination) of the drug existed. In the third step, a circulatory model of the dynamic system po H was developed. In the fourth step, the following equation was derived for the description of po MRT in the Laplace (s) domain:
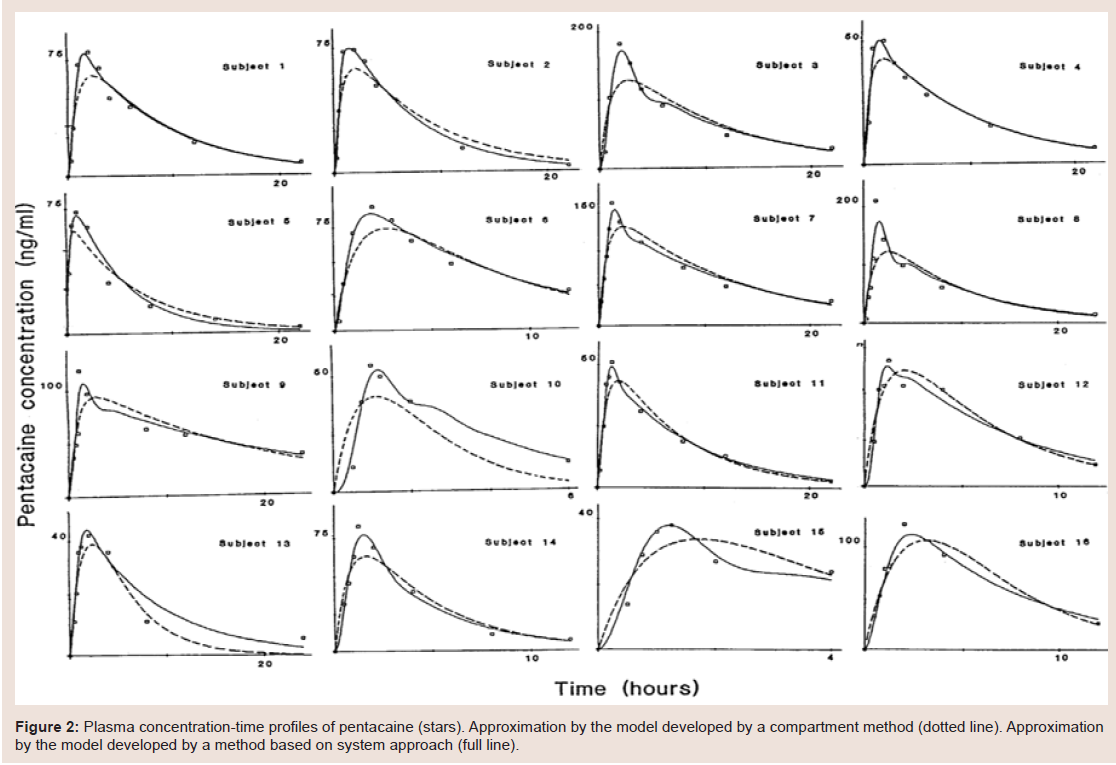
Figure 2: Plasma concentration-time profiles of pentacaine (stars). Approximation by the model developed by a compartment method (dotted line). Approximation by the model developed by a method based on system approach (full line).
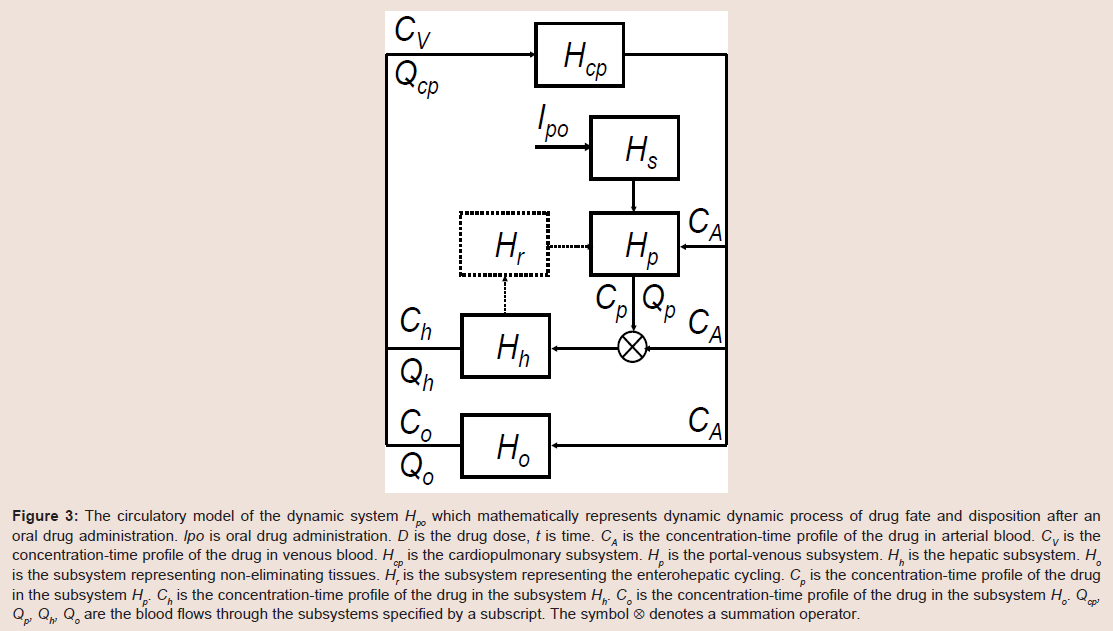
Figure 3: The circulatory model of the dynamic system Hpo which mathematically represents dynamic dynamic process of drug fate and disposition after an oral drug administration. lpo is oral drug administration. D is the drug dose, t is time. CA is the concentration-time profile of the drug in arterial blood. CV is the concentration-time profile of the drug in venous blood. Hcp is the cardiopulmonary subsystem. Hp is the portal-venous subsystem. Hh is the hepatic subsystem. Ho is the subsystem representing non-eliminating tissues. Hr is the subsystem representing the enterohepatic cycling. Cp is the concentration-time profile of the drug in the subsystem Hp. Ch is the concentration-time profile of the drug in the subsystem Hh. Co is the concentration-time profile of the drug in the subsystem Ho. Qcp, Qp, Qh, Qo are the blood flows through the subsystems specified by a subscript. The symbol ⊗ denotes a summation operator.
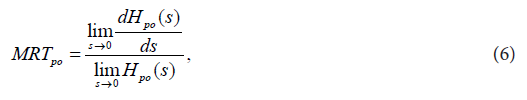
In Eq. (6), Hpo(s) is the transfer function [4,17] of the dynamic system . po H In the last step, the physiologically realistic structure of po MRT was determined, using Eq. (6), the circulatory model of the dynamic system po H developed, the previously published method [5,8], and all assumptions concerning the pharmacokinetic behavior of the drug administered. The determined physiologically realistic structure of po MRT is described by the following equation:
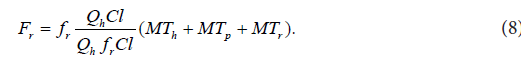
The right-hand side of Eq. (7) comprises four interconnected structural components involved in the pharmacokinetic behavior of the orally administered drug. s MT is the mean time of the drug dynamic transit [22] in the subsystem , s H i.e. in the subsystem mathematically representing the following dynamic processes: disintegration of a drug formulation, liberation of a drug from a drug formulation, drug dissolution, hepatic and intestinal first-pass effects (if present), and gastric emptying; p MT is the mean time of the drug dynamic transit in the portal subsystem , p H h MT is the mean time of the drug dynamic transit in the hepatic-portal subsystem . h H iv MRT in Eq. (7) is the same as that in Eq. (1). The sum of the mean times s p h MT + MT + MT in Eq. (7) is total mean time of the drug dynamic transit from the gastrointestinal tract to the blood circulation, see Figure 3. Assuming that EHC [25] was not present, the following equation was developed for the description of the structural component r F :
The sum of the mean transit times s p h MT + MT + MT in Eq. (8) is total mean time of the drug dynamic transit from the gastrointestinal tract to the blood circulation, see Figure 3.
The third example illustrates the development of a combined mathematical model of the dynamic process of the formation of 7-hydroxymethotrexate (7OH-MTX) from methotrexate (MTX) in patients undergoing treatment for psoriasis with MTX [26]. The chemotherapeutic agent methotrexate (MTX) is widely used in tumor therapy for different forms of leukemia, as well as for the therapy of patients with arthritis and/or psoriasis [26-29]. In the study [26], MTX was administered to psoriatic patients in a single oral dose of 15 mg once per week, and the investigation of pharmacokinetics and pharmacodynamics of MTX was performed in the early phase (3 months) after the start of therapy of psoriatic patients with MTX. In the current study, combined models for MTX and 7OH-MTX aredeveloped [figure 4a,figure 4b,figure 4c] using data kindly provided by the authors of the study [26]. The development of the models started with the definition of the dynamic systems H in the complex domain. Thereafter, the transfer functions H(s) (s is the Laplace variable) of the dynamic systems H were derived by relating the Laplace transforms of the blood concentration-time profiles of 7OH-MTX ( 7 - ( ) OH MTX C s ) to the Laplace transforms of the blood concentration-time profiles of MTX ( ( ) MTX C s) :
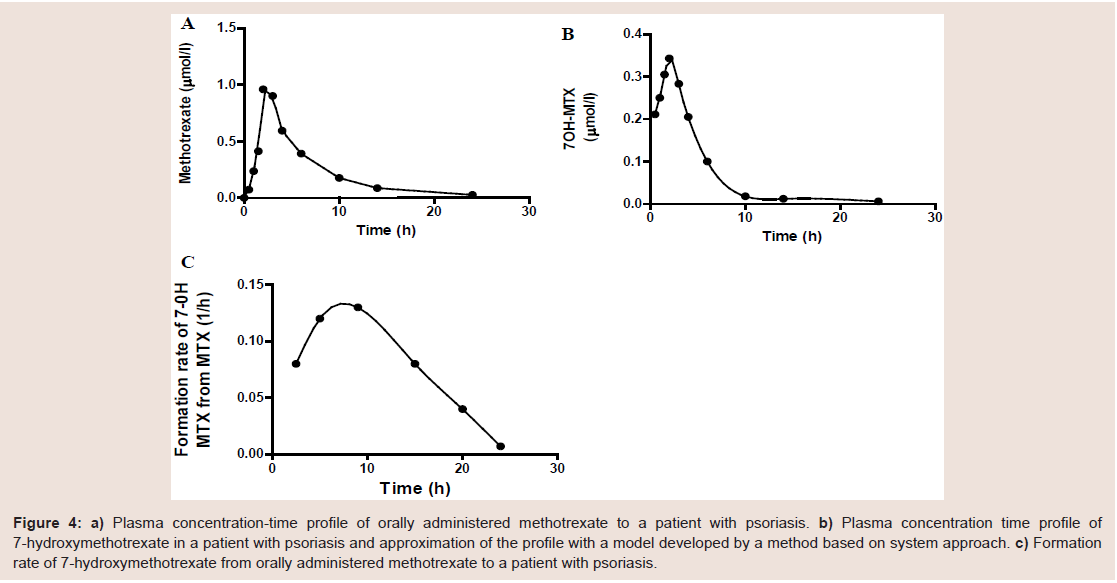
Figure 4: a) Plasma concentration-time profile of orally administered methotrexate to a patient with psoriasis. b) Plasma concentration time profile of 7-hydroxymethotrexate in a patient with psoriasis and approximation of the profile with a model developed by a method based on system approach. c) Formationrate of 7-hydroxymethotrexate from orally administered methotrexate to a patient with psoriasis.
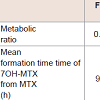
Employing the models developed, the following quantities were determined: metabolic ratios, mean times of the formation dynamic process of 7OH-MTX from MTX, and rates of the formation dynamic process of 7OH-MTX from MTX. The results obtained revealed that the metabolic ratio were approximately constant (0.67, 0.58, 0.59) during the first three months of the treatment of the patients with psoriasis with MTX. However, the mean times of the dynamic process of the formation of 7OH-MTX increased, from the value of 9.35 h (after the first dose of MTX) to the value of 15.59 h (after thirteenth dose of MTX). The formation rates of 7OH-MTX from MTX decreased from a maximal value of about 0.06 (1/h) after the first MTX dose to a maximal value of about 0.031 (1/h) after the thirteenth MTX dose, see [Table 1].
During the preparation of the current study, the author participated in the Action BM1204 of the COST program entitled: An integrated European platform for pancreas cancer research: from basic science to clinical and public health interventions for a rare disease.
Discussion
The current study presented three examples of an advantageous use of the modeling method based on the dynamic systems theory in pharmacokinetics. The details of the modeling method used, were not presented, they are beyond the scope of the current study. Instead, the reader interested in the details of the modeling method used wasreferred to the following studies [4-17]. The current study wonted to inspire readers and help them to become familiar with an advanced modeling method based on the theory of dynamic systems.A few examples describing the successful use of a modeling method based on the theory of dynamic systems in pharmacokinetics can be found in the full-text articles available for free on the Internet: http://www.uef.sav.sk/advanced.htm.
Note
The research work of the author in the 6FP-Project “EU-Network of excellence BioSim “Biosimulation a new tool in drug development” and the 7FP-Project “EU-Network of Excellence, Virtual Physiological Human” led to the preparation of the current study.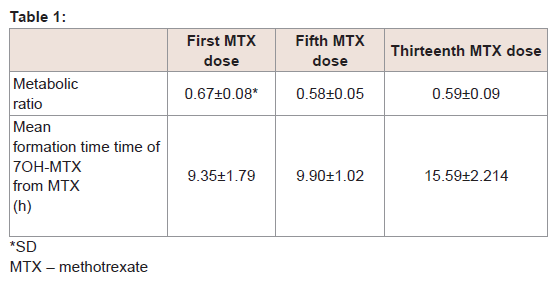
Table 1: a) Plasma concentration-time profile of orally administered methotrexate to a patient with psoriasis. b) Plasma concentration time profile of 7-hydroxymethotrexate in a patient with psoriasis and approximation of the profile with a model developed by a method based on system approach. c) Formationrate of 7-hydroxymethotrexate from orally administered methotrexate to a patient with psoriasis.
Concluding Remarks
J. G. Wagner in his earlier study wrote: modern view of pharmacokinetics must include both linear and nonlinear systems. The current study and also the previous studies authored and/orcoauthored by the author of the current study are in line with the idea presented by Wagner in his earlier study [30].References
- Loftsson T (2015) Excipient pharmacokinetics and profiling. Int J Pharm 480: 48-54.
- Weiss M, Pang KS (1992) Dynamics of drug distribution. I. Role of the second and third curve moment. J Pharmacokinet Biopharm 20: 253-278.
- Verotta D (2010) Fractional dynamics pharmacokinetics-pharmacodynamic models. J Pharmacokinet Pharmacodyn 37: 257-276.
- Ďurišová M, Dedík L (1994) Comparative study of human pentacaine pharmacokinetics in time and frequency domain. Methods Find Exp Clin Pharmacol 16: 219-232.
- Ďurišová M, Dedík L, Balan M (1995) Building a structured model of a complex pharmacodynamics system with time delays. Bull Math Biol 57: 787
- Dedík L, Ďurišová M (1994) Frequency response method in pharmacokinetics. J Pharmacokinet Biopharm 22: 293-307.
- Dedík L, Ďurišová M (1995) CXT - a programme for analysis of linear dynamic systems in the frequency domain. Int J Biomed Comput 39: 231-241.
- Dedík L, Ďurišová M (1996) CXT-MAIN: a software package for determination of the analytical form of the pharmacokinetic system weighting function. Comput Methods Programs Biomed. 51: 183-192.
- Dedík L, Ďurišová M (2002) System approach methods for modeling and testing similarity of in vitro dissolutions of drug dosage formulations. Comput Methods Programs Biomed 69: 49-55.
- Ďurišová M, Dedík L (2002) A system-approach method for the adjustment of time-varying continuous drug infusion in individual patients: a simulation study. J Pharmacokinet Pharmacodyn 29: 427-444.
- Ďurišová M, Dedík L (2005) New mathematical models in pharmacokinetic modeling. Basic Clin Pharmacol Toxicol 96: 335-342.
- Ďurišová M, Dedík L, Kristová V, Vojtko R (2008) Mathematical model indicates nonlinearity of noradrenaline effect on rat renal artery. Physiol Res 57: 785-788.
- Dedík L, Ďurišová M, Penesová A, Miklovičová D, Tvrdoňová M (2007) Estimation of influence of gastric emptying on shape of glucose concentration-time profile measured in oral glucose tolerance test. Diabetes Res Clin Pract 77: 377-384.
- Ďurišová M (2012) Physiologically based structure of mean residence time. ScientificWorldJournal 2012: 610631.
- Ďurišová M (2014) A physiological view of mean residence times. Gen Physiol Biophys 33: 75-80.
- Ďurišová M (2014) Mathematical model of pharmacokinetic behavior of orally administered prednisolone in healthy volunteers. J Pharmaceut Pharmacol 2: 1-5.
- Ďurišová M (2015) Another example of a successful use of computational and modeling tools from the theory of dynamic systems in pharmacokinetic modeling. J Pharmaceut Pharmacol 3: 1-3.
- Levy EC (1959) Complex curve fitting. IRE Trans on Automatic Control AC 4: 37-44.
- Akaike H (1974) A new look at the statistical model identification. IEEE Trans. Automat Control 19: 716-723.
- Nosáľová V, Babuľová A (1994) Gastric antiulcer activity of pentacaine: possible mechanism of action. Physiol Res 43: 181-186
- Huang F, Lui P, Yu H, Wang W (2013) Identifying if VISSIM simulation model and SSAM provide reasonable estimates for field measured traffic conflicts at signalized intersections. Accid Anal Prev 50: 1014-1024.
- Gao Z (2012) Development of a continuous dissolution/absorption system - a technical note. AAPS PharmSciTech 13: 1287-1292.
- Shin S, Nam B, Soh S, Koo BN (2014) Percutaneous cardiopulmonary support to treat suspected venous air embolism with cardiac arrest during open eye surgery: a case report. Korean J Anesthesiol 67: 350-353.
- Valentinuzzi ME (1971) A mathematical model of the hepatic portal system. Med Biol Eng 9: 213-220.
- Shepard TA, Lockwood GF, Aarons LJ, Abrahams ID (1989) Mean residence time for drugs subject to enterohepatic cycling. J Pharmacokinet Biopharm 17: 327-345.
- Chládek J, Martinková J, Šimková M, Vaněčková J, Koudelková V, et al. (1998) Pharmacokinetics of low doses of methotrexate in patients with psoriasis over the early period of treatment. Eur J Clin Pharmacol 53: 437-444.
- Pang KS (1985) A review of metabolite kinetics. J Pharmacokinet Biopharm 13: 633-662.
- Evans WE, Crom WR, Abromowitch M, Dodge R, Look T, et al. (1986) Clinical pharmacodynamics of high-dose methotrexate in acute lymphocytic leukemia. Identification of a relation between concentration and effect. N Engl J Med 314: 471-477.
- Newton PA, Bakley RL (1984) 7-Hydroxymethotrexate formation in a human lymphoblastic cell line. Biochem Biophys Res Commun 122: 1212-1217.
- Wagner JG (1973) A modern view of pharmacokinetics. J Pharmacokinet Biopharm 1: 363-401.