
Journal of Pharmaceutics & Pharmacology
Download PDF
Research Article
*Address for Correspondence: Gus R. Rosania, Department of Pharmaceutical Sciences, University of Michigan College of Pharmacy, 428 Church Street, Ann Arbor, MI 48109, USA, E-mail: grosania@umich.edu
Citation: Baik J, Rosania GR. Modeling and Simulation of Intracellular Drug Transport and Disposition Pathways with Virtual Cell. J Pharmaceu Pharmacol. 2013;1(1): 8.
Copyright © 2013 Baik J, et al. This is an open access article distributed under the Creative Commons Attribution License, which permits unrestricted use, distribution, and reproduction in any medium, provided the original work is properly cited.
Journal of Pharmaceutics & Pharmacology | ISSN: 2327-204X | Volume: 1, Issue: 1
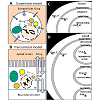
For modeling drug transport across a cell in the presence of a transcellular drug concentration gradient (as may occur across an epithelial cell monolayer during the process of drug absorption; Figure 1B), a second inner compartment (labeled "Basolateral lumen") was drawn inside the Cytoplasm compartment (Figure 1D). Accordingly, drug molecules in the Apical compartment diffused into Cytoplasm and from the Cytoplasm they diffused into the Basolateral compartment, following the typical transcellular transport pathway. A third intracellular compartment, "Lysosome" was sometimes included in the Cytoplasm. Basolateral and Lysosome compartments were separated from the Cytoplasm by the basolateral membrane and lysosomal membrane, respectively.
 Defining chemical, physiological and morphological input parameter values
 Viewing simulation results for a suspended cell
Modeling and Simulation of Intracellular Drug Transport and Disposition Pathways with Virtual Cell
Jason Baik1 and Gus R. Rosania2*
- 1Department of Bioengineering and Therapeutic Sciences, University of California - San Francisco, 533 Parnassus Ave. U-66, San Francisco, CA 94143, USA
- 2Department of Pharmaceutical Sciences, University of Michigan College of Pharmacy, 428 Church Street, Ann Arbor, MI 48109, USA
*Address for Correspondence: Gus R. Rosania, Department of Pharmaceutical Sciences, University of Michigan College of Pharmacy, 428 Church Street, Ann Arbor, MI 48109, USA, E-mail: grosania@umich.edu
Citation: Baik J, Rosania GR. Modeling and Simulation of Intracellular Drug Transport and Disposition Pathways with Virtual Cell. J Pharmaceu Pharmacol. 2013;1(1): 8.
Copyright © 2013 Baik J, et al. This is an open access article distributed under the Creative Commons Attribution License, which permits unrestricted use, distribution, and reproduction in any medium, provided the original work is properly cited.
Journal of Pharmaceutics & Pharmacology | ISSN: 2327-204X | Volume: 1, Issue: 1
Abstract
The development of computational approaches for modeling the spatiotemporal dynamics of intracellular, small molecule drug concentrations has become an increasingly important area of pharmaceutical research. For systems pharmacology, the system dynamics of subcellular transport can be coupled to downstream pharmacological effects on biochemical pathways that impact cell structure and function. Here, we demonstrate how a widely used systems biology modeling package - Virtual Cell - can also be used to model the intracellular, passive transport pathways of small drug like molecules. Using differential equations to represent passive drug transport across cellular membranes, spatiotemporal changes in the intracellular distribution and concentrations of exogenous chemical agents in specific subcellular organelles were simulated for weakly acidic, neutral, and basic molecules, as a function of the molecules’ lipophilicity and ionization potentials. In addition, we simulated the transport properties of small molecule chemical agents in the presence of a homogenous extracellular concentration or a transcellular concentration gradient. We also simulated the effects of cell type dependent variations in the intracellular microenvironments on the distribution and accumulation of small molecule chemical agents in different organelles over time, under influx and efflux conditions. Lastly, we simulated the transcellular transport of small molecule chemical agents, in the presence of different apical and basolateral microenvironments. By incorporating existing models of drug permeation and subcellular distribution, our results indicate that Virtual Cell can provide a user-friendly, open, online computational modeling platform for systems pharmacology and biopharmaceutics research, making mathematical models and simulation results accessible to a broad community of users, without requiring advanced computer programming knowledge.Keywords: Virtual Cell; Drug Disposition; Simulation and Modeling; Pharmacokinetics; Pharmacology; Computational Biology; Systems Biology; Systems Pharmacology
Introduction
Over the past decade, computational modeling approaches for predicting the absorption, distribution, metabolism, excretion and toxicity (ADMET) properties of exogenous small molecule chemical agents from cells to tissues to organisms have been increasingly used to facilitate drug development [1-3]. For preclinical testing of drug leads, computational models have been used to analyze and interpret the results of in vitro and in vivo experiments, and to help predict the efficacy and safety of candidate compounds. For drug design, the ability to model and simulate the pharmacokinetics and pharmacodynamics of small drug-like molecules at a cellular level has also raised considerable interest because the transport of drug molecules by cells can lead to specific and nonspecific effects on cell structure and function. At a microscopic level, cellular drug disposition and action depend on the interactions of drug molecules with specific macromolecular targets localized in specific subcellular compartments [4]. Variations in local, subcellular microenvironments can influence the accumulation of drug molecules in different organelles, and this can lead both intended and unintended effects on biochemical reactions that take place in those organelles [5,6]. Furthermore, modeling small molecule transport at a cellular level has been used to obtain insights into drug absorption, as well as the other higher order drug ADMET properties, before drug candidates are tested in human patients [3].While the interactions of drug molecules with isolated macromolecular receptors or enzymes have been the traditional subject of pharmacological research studies, "systems pharmacology" is an emergent field of study that aims to understand the spatiotemporal dynamics of drug activity and toxicity in a more complex physiological context. Therefore, in systems pharmacology research, the transport and disposition of exogenous chemical agents inside cells needs to be studied together with the site-specific pharmacological effects of these agents on endogenous macromolecular targets affecting biochemical pathways in specific organelles. To advance systems pharmacology, a general, flexible and adaptable computational modeling platform is now needed, to integrate effects of the cellular microenvironment on the transport or disposition of exogenous chemical agents within living cells, and then to assess the downstream effects of local drug concentrations on endogenous biochemical reaction networks. Certainly, drug transport across cellular membranes can be affected by differences in pH, membrane electrical potential, nonspecific sorption to membranes and other components, as well as the presence of unidirectional active drug transport mechanisms and drug metabolizing enzymes localized in specific subcellular compartments. With this vision in mind, we sought to identify a computational tool that would allow modeling the effect of the cellular microenvironment on drug transport and disposition inside cells, while also allowing pharmacologists and pharmaceutical scientists to share, adapt and combine existing systems biology and cellular pharmacokinetics models, without demanding extensive computer programming skills. In addition, we also looked for an open, online computational modeling platform that would help design, interpret and share experimental results.
Searching through existing software packages, our attention focused on Virtual Cell (http://vcell.org), a software tool especially designed to facilitate systems biology and biophysics research [7-9]. Virtual Cell can be used to write and solve differential equations that capture changes in concentrations of biochemical reactants and products inside cells, using a menu-driven, object-oriented graphical user interface. This software tool has been built by the National Resource for Cell Analysis and Modeling (NRCAM, University of Connecticut Health Center) to provide systems biologists with an open computational platform to model reaction-diffusion mechanisms in individual cells in order to simulate and analyze biochemical reactions and dynamics of cellular processes [9-12]. For example, Virtual Cell can be used to model fluctuations in subcellular concentrations of signal transduction intermediaries, such as spikes and oscillations in intracellular calcium concentrations, protein phosphorylation, and electrical conductance changes of the plasma membrane such as those responsible for the transmission of nerve impulses, long term potentiation, and other neurophysiological phenomena [7,9,11,12]. Virtual Cell was designed to facilitate quantitative analysis of biochemical reaction networks underlying cellular phenotypes including the establishment of cell polarity, cell motility, chemotaxis, and subcellular morphogenetic events such as spindle assembly or growth cone guidance [11]. For solving differential equations, as well as storing and sharing models, Virtual Cell provides free, remote solvers and storage servers available to a worldwide community of users working from personal computers. Accordingly, we proceeded to test whether Virtual Cell could also serve as a computational framework for cellular pharmacokinetic modeling [13,14], to provide a flexible, adaptable platform for systems pharmacology research.
Methods
ProgramInstructions to access and install Virtual Cell can be found at (http://vcell.org), and it is free of charge. To demonstrate software performance, we captured screen shots from the software, and labeled these screen shots with bigger fonts, to make the fonts visible in the figures shown in the manuscript. Java-based modular interface on the user’s personal computer allows the modeler to be consistent throughout the process of inputting model parameters and descriptors, such as reaction equations or geometric dimensions. Readers can access Virtual Cell and run the models described in this article. For suspension cell transport model, access: Baik & Rosania 2013 JPP - 01 Suspension model no lysosome. For transcellular transport model, access: Baik & Rosania 2013 JPP - 02 Transcellular model no lysosome, or Baik & Rosania 2013 JPP - 03 Transcellular model with lysosome.
Creating and defining cellular compartments in Virtual Cell
Virtual Cell consists of four modular components: Physiology, Reaction, Geometry, and Simulations. For modeling, we considered two different kinds of simulation conditions: cells in suspension (such as lymphocytes in culture) surrounded by a homogeneous concentration gradient (Figure 1A, suspension model) and attached cells on tissue culture membrane (such as an epithelial cell cultured on Transwell® Inserts) in the presence of a transcellular concentration gradient (Figure 1B, transcellular model). To create a compartmental cellular pharmacokinetic models in Virtual Cell, the first step was to describe the Physiology of the membrane bound compartments of interest, and the Reaction of different molecular and functional species corresponding to the small molecule chemical agents whose transport kinetics were being modeled. To do this, a new BioModel was created in the user account. Next, a Physiology was constructed with drug molecules in each compartment i (Drug_i), to represent the conceptual layout and contents. A Reaction was added for each individual molecular species (reactants and products) defined as a flux carrier, for both suspension model (Figure 1C) and transcellular model (Figure 1D). For modeling drug transport in a suspended cell, a generic cell was then drawn, comprised of three nested, concentric compartments. The outermost compartment (labeled “Outside”) corresponded to the extracellular medium. The middle compartment (labeled “Cytoplasm”) corresponded to the cytoplasm compartment of the cell, separated from the Outside by the plasmalemma membrane. The innermost compartment corresponded to a subcellular organelle compartment (labeled “Cytoplasm”), separated from the Cytoplasm by the mitochondrial membrane. Accordingly, when drug was applied to the Outside (Drug_O), molecules diffused across the membrane barrier into Cytoplasm (Drug_C). Subsequently, Drug_C was linked to Drug_M in mitochondria, to represent molecules diffusing from the cytosol, across the mitochondrial membrane and into this specific organelle compartment.
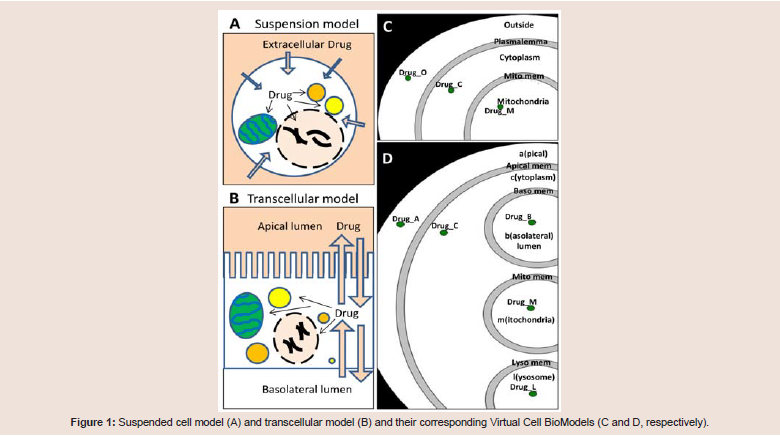
Figure 1: Suspended cell model (A) and transcellular model (B) and their corresponding Virtual Cell BioModels (C and D, respectively).
Specifying transport reaction kinetics and input variables in Physiology
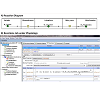
Within the Physiology window, right-clicking on each membrane allowed users to access the specific Reaction diagram to describe the movement of the flux carrier, drug molecule "Bt", from one side of the membrane to the other (Figure 2A). Connecting the two molecular species with lines between Outside and Cytoplasm created flux_OC (flux of Bt from Outside to Cytoplasm). To define the flux equation, General Flux Density was selected as the kinetic type (Figure 2B). After the Fick-Nernst-Plank equation was manually typed as the equation governing the flux across each membrane [13], the program automatically created an input table for each parameter in this equation (Figure 2B, lower right panel, Object Properties) with automatically matching units. This Object Properties window was readily accessible from the navigation panel on the left side of the BioModel window. For the simulations carried out in this study, the governing equation and parameter values were all based on published cellular pharmacokinetic models [13,14].
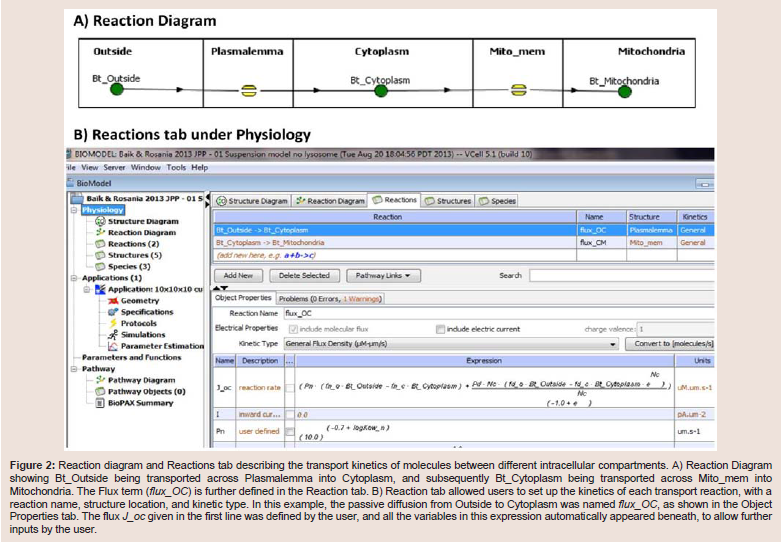
Figure 2: Reaction diagram and Reactions tab describing the transport kinetics of molecules between different intracellular compartments. A) Reaction Diagram showing Bt_Outside being transported across Plasmalemma into Cytoplasm, and subsequently Bt_Cytoplasm being transported across Mito_mem into Mitochondria. The Flux term (flux_OC) is further defined in the Reaction tab. B) Reaction tab allowed users to set up the kinetics of each transport reaction, with a reaction name, structure location, and kinetic type. In this example, the passive diffusion from Outside to Cytoplasm was named flux_OC, as shown in the Object Properties tab. The flux J_oc given in the first line was defined by the user, and all the variables in this expression automatically appeared beneath, to allow further inputs by the user.
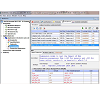
The next step, developing an Application, entailed defining the virtual microenvironment under which the transport simulations were run: 1) the membrane surface areas and the volumes of the compartments in Geometry; and, 2) the pH of the different compartments, initial and/or boundary conditions and the drug parameters, such as pKa and octanol/water partitioning coefficient (logKow). These values were entered in the Specification and Simulation windows. For the suspended cell model, we selected the compartmental geometry with defined surface area and volume of each membrane bound components. Briefly, for the generic cell model, we modeled the Cytosol as a 10×10×10 μm3 cube, and Mitochondria (and Lysosomes) as one hundred 1×1×1 & μm3 cubes. The extracellular volume was set to 1000× the volume of the cytosol, assuming 1 million cells per milliliter concentration as normally used in in vitro drug transport experiments. For the transcellular model, apical and basolateral lumens were set to be 120× and 200× the volume of the cytosol, which was set to 10×10×10 μm3, to represent the volume of epithelial cells typically used for transcellular transport experiments. In addition, apical surface area was set to be 20× the basolateral surface area (which was set to 10×10 μm2), to model the increase in apical surface area due to microvilli. All of these parameters were adjusted in the Simulation window, which was accessible in the navigation panel ((Figure 3,). In this manner, we were able to create, copy, and modify simulations, while making necessary changes, and annotating them in the Object Properties tab shown in the lower panel. Furthermore, the Simulations function allowed users to scan multiple parameter values in one simulation. For example, the parameter scanning option allowed us to vary the electrical potential of mitochondrial membrane (Emm) for acid (c= -1) and base (c = +1), for molecules with different pKas, in order to calculate their combined effects on transport dynamics.
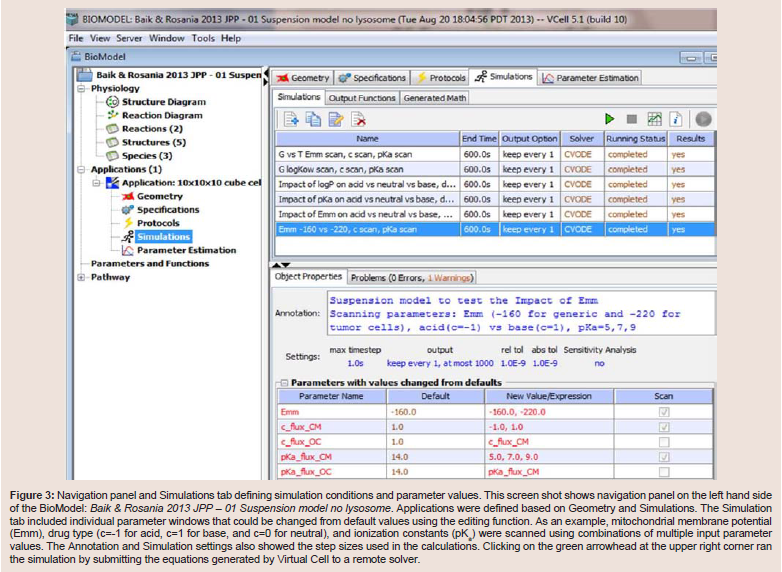
Figure 3: Navigation panel and Simulations tab defining simulation conditions and parameter values. This screen shot shows navigation panel on the left hand side of the BioModel: Baik & Rosania 2013 JPP - 01 Suspension model no lysosome. Applications were defined based on Geometry and Simulations. The Simulation tab included individual parameter windows that could be changed from default values using the editing function. As an example, mitochondrial membrane potential (Emm), drug type (c=-1 for acid, c=1 for base, and c=0 for neutral), and ionization constants (pKa) were scanned using combinations of multiple input parameter values. The Annotation and Simulation settings also showed the step sizes used in the calculations. Clicking on the green arrowhead at the upper right corner ran the simulation by submitting the equations generated by Virtual Cell to a remote solver.
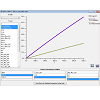
Virtual Cell users can create simulation models from a personal computer terminal and modify any modeling parameters and conditions using its graphical user interface. Accordingly, after the specific input parameters of the model were set, the mathematical description of the model was automatically generated by the software as a set of differential equations, which could be accessed using the MathModels menu tab. Once a calculation was submitted to the remote control server, the proper solver with computational capacity was automatically assigned to solve the equations according to the designated type. For example, compartmental deterministic, ordinary differential equation problems were solved with CVODE (variable order with variable time steps) solver. Solver and server capabilities are described in detail in the Virtual Cell webpage and associated References. After running a simulation, we were able to use Virtual Cell to graph the simulation results, for example, by plotting the concentration of the molecules in the different compartments vs. time (Figure 4). For all Virtual Cell simulation results presented in this article, we confirmed that the results were the same as those previously published [13,14].
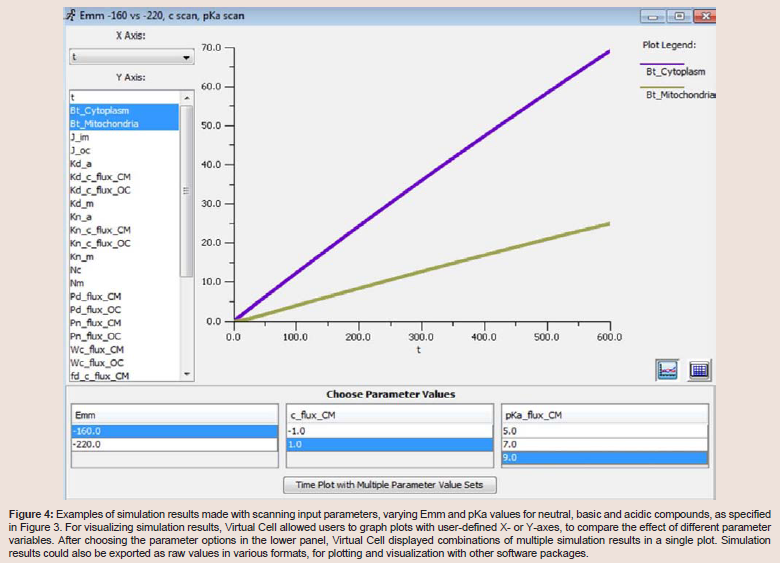
Figure 4: Examples of simulation results made with scanning input parameters, varying Emm and pKa values for neutral, basic and acidic compounds, as specified in Figure 3. For visualizing simulation results, Virtual Cell allowed users to graph plots with user-defined X- or Y-axes, to compare the effect of different parameter variables. After choosing the parameter options in the lower panel, Virtual Cell displayed combinations of multiple simulation results in a single plot. Simulation results could also be exported as raw values in various formats, for plotting and visualization with other software packages.
Privacy settings
All models were made private until we confirmed the results, after which they were made public (or otherwise accessible to specific users). Access to the models can be set using the permission option under the BioModel window. Guests with permission were able to download the model, and the modified model could be saved in the guest’s account.
 Next, we used Virtual Cell to simulate the transcellular transport of a small molecule monovalent weak base (logKow = 1.88; pKa = 9.6) in the presence of an apical to basolateral, transcellular concentration gradient (Figure 6). As initial conditions for transcellular transport and influx (Figure 6A), we simulated a cell in the presence of a 10 μM apical drug concentration (dosing compartment), with no drug in the basolateral side (receiver compartment). Simulation results were plotted for 10 seconds, to show the changes in the concentration of the molecule in extracellular lumen, as well as in intracellular compartments. Based on the plots, intracellular steady state was reached within a few seconds after exposure, and the basolateral concentration increased slowly as the diffusion of the drug was hindered by the apical and basolateral membranes, as observed in published simulations with the same model [14].
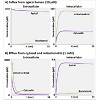 Next, we set the intracellular concentration values in cytosol and mitochondria to 1000 μM, and extracellular concentrations to 0, in order to simulate drug efflux from cells, in a transcellular model(Figure 6B). The simulation results showed that there was a rapid decrease in cytosolic concentration, coupled to efflux from other intracellular organelles. In mitochondria, there was a temporary influx from cytosol; however, this influx trend soon reversed to efflux from mitochondria to cytosol, and subsequently from cytosol to apical and basolateral compartments. Since the apical membrane surface area was 20-fold greater than that of the basolateral membrane, the initial concentration changes were much greater in the apical compartment. In other words, greater surface area allowed more molecules to cross to apical side, closely reflecting cytosolic changes. As expected, drug concentrations in apical and basolateral compartments eventually reached similar steady state levels, at later time points during the simulation.
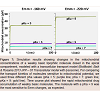 In case of monobasic molecules with pKa = 7, we expected about 50% the molecules to be ionized and positively charged in the cytosol. Because the mitochondrial pH was set to 8 [13,14], the molecules within the mitochondria became uncharged and diffused back into the cytosol, resulting in no apparent mitochondrial accumulation (Figure 7, green line). In contrast, for weakly basic molecules with a pKa of 9, more than 90% of the molecules were protonated and became positively charged in cytosol and mitochondria. Therefore, these molecules experienced mitochondrial membrane potentialdependent translocation and accumulated inside mitochondria (Figure 7, gold line). As expected, a decrease in the mitochondrial membrane potential from -160 mV to -220 mV led to an increase in mitochondrial accumulation of the positively-charged, protonated weak bases [13,14].
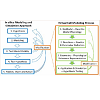 Nevertheless, Virtual Cell can also function as an adaptable, open, user-friendly computational platform that is readily accessible to pharmaceutical scientists and experimental pharmacologists, without requiring advanced computer programming skills. For systems pharmacology, many systems biology models are already available through Virtual Cell. By incorporating cellular pharmacokinetic models such as those elaborated in the present study, it should now be possible to design experiments that test predictions of quantitative, mechanistic hypotheses integrating the effects of drug transport and distribution on drug-target interactions and their downstream effects on the spatiotemporal dynamics of biochemical signaling networks. After testing these hypotheses with pharmacological experiments, Virtual Cell models could be further refined and improved (Figure 8). The ability to modify published models step-by-step and share these models through Virtual Cell should enhance scientists’ ability to communicate research results and collaborate. Accordingly, Virtual Cell is ready to be deployed as a computational tool for systems pharmacology, to help advance this multidisciplinary research field.
Results and Discussion
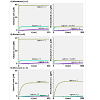
To begin testing the software, we first ran a model of a generic cell in suspension, surrounded by a homogeneous extracellular concentration (Figure 1A, C). We simulated the transport behavior of monoacidic and monobasic molecules with a pKa of 5. When monobasic molecules were modeled (Figure 5A), more than 99% of these molecules were expected to be deprotonated and present in neutral form at physiological pH values (7.2 to 7.4). Therefore, the behavior of monobasic molecules with a pKa of 5 was expected to resemble the behavior of neutral molecules (Figure 5B), rapidly reaching steady-state. The distribution with the concentrations in various compartments reflects the model-specific membrane permeability of the molecules, which in the case of passively diffusing hydrophobic molecules, is a function of their octanol/water partition coefficients, logKow [13]. When monoacidic molecules with a pKa of 5 were modeled (Figure 5C), more than 99% of these molecules were expected to be deprotonated and negatively charged at physiological pH values. Because the majority of these molecules should be negatively charged (hydrophilic) and therefore membrane impermeant, the cellular uptake rates of acidic molecules appeared slower than that of neutral and monobasic molecules, as expected. Furthermore, because mitochondrial pH was set to 8.0 and cytosol pH was set to 7.5, acidic molecules with logKow = 2 accumulated to higher concentrations in mitochondria relative to the cytosol (Figure 5C).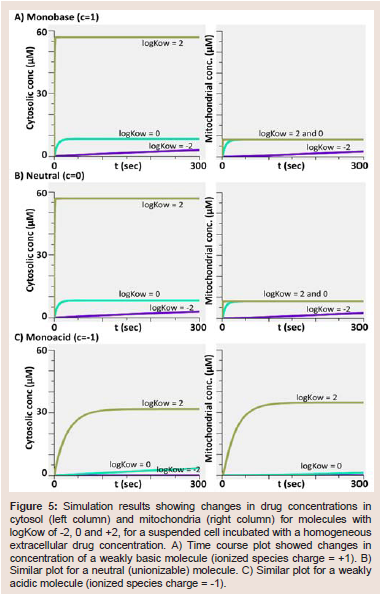
Figure 5: Simulation results showing changes in drug concentrations in cytosol (left column) and mitochondria (right column) for molecules with logKow of -2, 0 and +2, for a suspended cell incubated with a homogeneous extracellular drug concentration. A) Time course plot showed changes in concentration of a weakly basic molecule (ionized species charge = +1). B) Similar plot for a neutral (unionizable) molecule. C) Similar plot for a weakly acidic molecule (ionized species charge = -1).
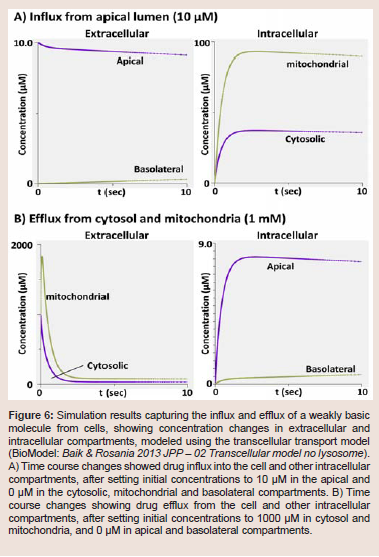
Figure 6: Simulation results capturing the influx and efflux of a weakly basic molecule from cells, showing concentration changes in extracellular and intracellular compartments, modeled using the transcellular transport model (BioModel: Baik & Rosania 2013 JPP - 02 Transcellular model no lysosome). A) Time course changes showed drug influx into the cell and other intracellular compartments, after setting initial concentrations to 10 μM in the apical and 0 μM in the cytosolic, mitochondrial and basolateral compartments. B) Time course changes showing drug efflux from the cell and other intracellular compartments, after setting initial concentrations to 1000 μM in cytosol and mitochondria, and 0 μM in apical and basolateral compartments.
Lastly, we simulated the mitochondrial accumulation of lipophilic, monovalent weakly basic molecules, as a function of pKa of the molecules and mitochondrial membrane potential. To test this, we used a transcellular transport model with lysosomes, matching a previously published model [14] (BioModel: Baik & Rosania 2013 JPP - 03 Transcellular model with lysosome). For a basic drug molecule with pKa of 5, we expected most of the molecules to be unprotonated (neutral) at physiological pH to make the transport kinetics insensitive to mitochondrial membrane potential (Emm) (Figure 7, purple line).
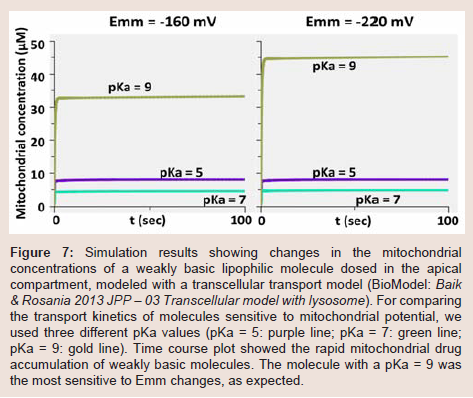
Figure 7: Simulation results showing changes in the mitochondrial concentrations of a weakly basic lipophilic molecule dosed in the apical compartment, modeled with a transcellular transport model (BioModel: Baik & Rosania 2013 JPP - 03 Transcellular model with lysosome). For comparing the transport kinetics of molecules sensitive to mitochondrial potential, we used three different pKa values (pKa = 5: purple line; pKa = 7: green line; pKa = 9: gold line). Time course plot showed the rapid mitochondrial drug accumulation of weakly basic molecules. The molecule with a pKa = 9 was the most sensitive to Emm changes, as expected.
To conclude, our results indicated that, beyond its original, intended application in systems biology research, Virtual Cell is useful as a computational platform to model the subcellular transport properties of exogenous pharmacological agents. For advancing systems pharmacology research, this is significant because it should now be possible to use Virtual Cell to integrate many existing systems biology and cellular pharmacokinetics models. Indeed, modeling the cellular transport properties of small molecule chemical agents has been an active area of pharmaceutical research during the past decade [4], because cell permeability is a key factor determining the bioavailability and ADME properties of drug molecules [15,16]. As a result, many computational modeling approaches have been developed to predict properties that capture some aspects of how small molecules distribute inside cells and how they are transported across cells. These approaches range from predicting the most basic physicochemical properties affecting drug transport, such as octanol/water partition coefficient (logKow) [17,18], dissociation constant (pKa) [19] and drug in vitro dissolution profiles [20] to the most complex, systemic pharmacokinetic disposition and toxicity properties [1-3,21,22].
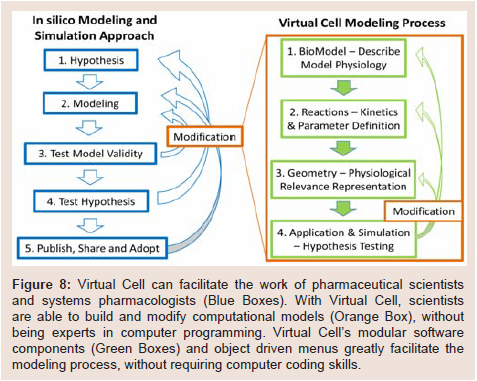
Figure 8: Virtual Cell can facilitate the work of pharmaceutical scientists and systems pharmacologists (Blue Boxes). With Virtual Cell, scientists are able to build and modify computational models (Orange Box), without being experts in computer programming. Virtual Cell’s modular software components (Green Boxes) and object driven menus greatly facilitate the modeling process, without requiring computer coding skills.
Acknowledgements
JB was supported by Oak Ridge Institute of Science and Education Fellowship as appointed to the research participation program at Center for Drug Evaluation and Research administered by through an interagency agreement between the US Dept. of Energy and the US FDA. GRR was supported by NIH grant R01GM078200. The Virtual Cell is supported by NIH Grant Number P41 GM103313 from the National Institute for General Medical Sciences.References
- Eddershaw PJ, Beresford AP, Bayliss MK (2000) ADME/PK as part of a rational approach to drug discovery. Drug Discov Today 5: 409-414.
- Yamashita F, Hashida M (2004) In silico approaches for predicting ADME properties of drugs. Drug Metab Pharmacokinet 19: 327-338.
- Sun D, Yu LX, Hussain MA, Wall DA, Smith RL, et al. (2004) In vitro testing of drug absorption for drug ‘developability’ assessment: forming an interface between in vitro preclinical data and clinical outcome. Curr Opin Drug Discov Devel 7: 75-85.
- Chu X, Korzekwa K, Elsby R, Fenner K, Galetin A, et al. (2013) Intracellular drug concentrations and transporters: measurement, modeling, and implications for the liver. Clin Pharmacol Ther 94: 126-141.
- Rashid F, Horobin RW (1990) Interaction of molecular probes with living cells and tissues. Part 2. A structure-activity analysis of mitochondrial staining by cationic probes, and a discussion of the synergistic nature of image-based and biochemical approaches. Histochemistry 94: 303-308.
- de Duve C, de Barsy T, Poole B, Trouet A, Tulkens P, et al. (1974) Commentary. Lysosomotropic agents. Biochem Pharmacol 23: 2495-2531.
- Cowan AE, Moraru, II, Schaff JC, Slepchenko BM, Loew LM (2012) Spatial modeling of cell signaling networks. Methods Cell Biol 110: 195-221.
- Moraru, II, Schaff JC, Slepchenko BM, Blinov ML, Morgan F, et al. (2008) Virtual Cell modelling and simulation software environment. IET SystBiol 2: 352-362.
- Schaff J, Fink CC, Slepchenko B, Carson JH, Loew LM (1997) A general computational framework for modeling cellular structure and function. Biophys J 73: 1135-1146.
- Rangamani P, Iyengar R (2007) Modelling spatio-temporal interactions within the cell. J Biosci 32: 157-167.
- Schaff JC, Slepchenko BM, Choi YS, Wagner J, Resasco D, et al. (2001) Analysis of nonlinear dynamics on arbitrary geometries with the Virtual Cell. Chaos 11: 115-131.
- Smith AE, Slepchenko BM, Schaff JC, Loew LM, Macara IG (2002) Systems analysis of Ran transport. Science 295: 488-491.
- Trapp S, Horobin RW (2005) A predictive model for the selective accumulation of chemicals in tumor cells. Eur Biophys J 34: 959-966.
- Zhang X, Shedden K, Rosania GR (2006) A cell-based molecular transport simulator for pharmacokinetic prediction and cheminformatic exploration. Mol Pharm 3: 704-716.
- Amidon GL, Lennernas H, Shah VP, Crison JR (1995) A theoretical basis for a biopharmaceutic drug classification: the correlation of in vitro drug product dissolution and in vivo bioavailability. Pharm Res 12: 413-420.
- FDA Guidance for Industry: Waiver of In Vivo Bioavailability and Bioequivalence Studies for Immediate-Release Solid Oral Dosage Forms Based on a Biopharmaceutics Classification System.
- Malkia A, Murtomaki L, Urtti A, Kontturi K (2004) Drug permeation in biomembranes: in vitro and in silico prediction and influence of physicochemical properties. Eur J Pharm Sci 23: 13-47.
- Klopman G, Zhu H (2005) Recent methodologies for the estimation of n-octanol/water partition coefficients and their use in the prediction of membrane transport properties of drugs. Mini Rev Med Chem 5: 127-133.
- Wan H, Ulander J (2006) High-throughput pKa screening and prediction amenable for ADME profiling. Expert Opin Drug Metab Toxicol 2: 139-155.
- Takano R, Sugano K, Higashida A, Hayashi Y, Machida M, et al. (2006) Oral absorption of poorly water-soluble drugs: computer simulation of fraction absorbed in humans from a miniscale dissolution test. Pharm Res 6: 1144-1156.
- Ekins S, Andreyev S, Ryabov A, Kirillov E, Rakhmatulin EA, et al. (2005) Computational prediction of human drug metabolism. Expert Opin Drug Metab Toxicol 1: 303-324.
- Fan J, Maeng HJ, Pang KS (2010) Interplay of transporters and enzymes in the Caco-2 cell monolayer: I. effect of altered apical secretion. Biopharm Drug Dispos 31: 215-227.