
Research Article
*Address for Correspondence: Anita Kriško, Mediterranean Institute for Life Sciences, Meštrovićevo šetalište 45, 21000 Split, Croatia, Tel: +385 21 55 56 04; Fax: +385 21 55 56 05; E-mail: anita.krisko@medils.hr
Citation: Nikolić A, Perić M, Ladouce R, Mikecin AM, Martin FA, et al. Death by UVC Light Correlates with Protein Damage in Isogenic Human Tumor Cells: Primary Tumor SW480 versus its Metastasis SW620. J Proteomics Computational Biol. 2016;2(1): 12.
Copyright © 2016 Nikolić A, et al. This is an open access article distributed under the Creative Commons Attribution License, which permits unrestricted use, distribution, and reproduction in any medium, provided the original work is properly cited.
Journal of Proteomics & Computational Biology | Volume: 2, Issue: 1
Submission: 21 December, 2015 | Accepted: 16 March, 2016 | Published: 21 March, 2016
 SW480 cells display higher ROS level
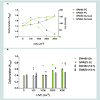
 In order to examine the effect of UVC irradiation on proteome of SW480 and SW620 cell lines in more detail, we measured ROS levels immediately after UVC exposure. The H2DCFDA probe was present during irradiation in order to scavenge ROS immediately upon their formation. A gradual increase in ROS level is detected with the increase in UVC dose (Figure 2B). UVC-induced ROS levels were higher for all doses in SW480 cells. More precisely, the results show 50% higher ROS level in SW480 cells than in SW620 at 100 Jm-2 (P≤0.05), 85% at 1000 Jm-2 (P≤0.05), 67% at 2000 Jm-2 (P≤0.05) and 96% at 3000 Jm-2 (P≤0.05), respectively.
 Using PANTHER database, we grouped significantly upregulated and carbonylated protein spots according to their gene ontology (GO) classification: protein class (Supplementary Figures S 1A-1D), molecular function (Supplementary Figures S 2A-2D), biological process (Supplementary Figures S 3A-3D), cell component (Supplementary Figures S 4A-4C) and pathway (Supplementary Figures S 5A-5C).
Death by UVC Light Correlates with Protein Damage in Isogenic Human Tumor Cells: Primary Tumor SW480 versus its Metastasis SW620
Andrea Nikolić1, Matea Perić1, Romain Ladouce1 Ana-Matea Mikecin2 Fernando A. Martin1 MarijetaKralj2Anita Kriško1* and Miroslav Radman1
- 1Mediterranean Institute for Life Sciences, Meštrovićevo šetalište 45, 21000 Split, Croatia
- 2Division of Molecular Medicine, Ruđer Bošković Institute, Bijenička cesta 54, 10000 Zagreb, Croatia
*Address for Correspondence: Anita Kriško, Mediterranean Institute for Life Sciences, Meštrovićevo šetalište 45, 21000 Split, Croatia, Tel: +385 21 55 56 04; Fax: +385 21 55 56 05; E-mail: anita.krisko@medils.hr
Citation: Nikolić A, Perić M, Ladouce R, Mikecin AM, Martin FA, et al. Death by UVC Light Correlates with Protein Damage in Isogenic Human Tumor Cells: Primary Tumor SW480 versus its Metastasis SW620. J Proteomics Computational Biol. 2016;2(1): 12.
Copyright © 2016 Nikolić A, et al. This is an open access article distributed under the Creative Commons Attribution License, which permits unrestricted use, distribution, and reproduction in any medium, provided the original work is properly cited.
Journal of Proteomics & Computational Biology | Volume: 2, Issue: 1
Submission: 21 December, 2015 | Accepted: 16 March, 2016 | Published: 21 March, 2016
Abstract
A correlation between protein damage and death, but not DNA damage, was found among cells from robust and standard bacterial and invertebrate species. However, the bottleneck in DNA repair efficacy appears more at the level of proteome damage than DNA damage. Here we present a comparative study of SW480 cells derived from a primary colon adenocarcinoma and SW620 metastatic cells derived from the same primary tumor and provide evidence that correlation between death and proteome damage extends to human tumor cells. A higher resistance of SW620 cells, compared to SW480, to killing by UVC light correlates with reduced levels of incurred irreversible oxidative protein damage (carbonylation) related to lower levels of ROS and of proteins intrinsically susceptible to oxidative damage due to imperfect folding. This study provides a concept for sensitizing tumor cells to cancer therapies and assessment of cancer cell fitness.Keywords
Protein oxidation; Cell death; Primary tumor; MetastasisAbbreviations
PTMs: Post-Translational Modifications; ROS: Reactive Oxygen Species; PC: Protein Carbonylation; DMEM: Dulbecco’s Modified Eagle Medium; FBS: Fetal Bovine Serum; PBS: Phosphate Buffered Saline; DNPH: 2,4-Dinitrophenyl Hydrazine; HRP: Horseradish Peroxidase; H2DCFDA: Dichloro Fluorescein Diacetate; DCF: 2’, 7’-Dichlorofluorescein; SDS-PAGE: SDS-Polyacrylamide Gel Electrophoresis; UTCDTT buffer: Urea Thiourea CHAPS DTT buffer; CHAPS: (3-[(3-Cholamidopropyl) Dimethylamonio]-1- propanesulphonate); DTT: Dithiotreitol; RMI: Relative Modification Index; MS: Mass Spectrometry; RSLC: Rapid Separation Liquid Chromatographic system; ACN: Acetonitrile; TFA: Trifluoroacetic Acid; FA: Formic Acid; AGC: Automatic Gain Control; GO: Gene Otology; TGM2: Protein-Glutamine Gamma-Glutamyl transferase 2; PRP19: Pre-mRNA-Processing Factor 19; TRIC: T-complex protein 1 subunit eta; OLA1: Obg-like ATPase 1; DX39B: Spliceosome RNA Helicase DDX39B; PGK1: Phospho Glycerate Kinase 1; IF5A1: Eukaryotic Translation Initiation factor 5A-1; ATPB: Mitochondrial ATP Synthase subunit beta; ENOA: Alpha Enolase; ALDOA: Fructose-Biphosphate Aldolase A; PGK1: Phospho Glicerate-Kinase 1; PRDX2: Peroxiredoxin 2; GDIR1: rho GDP-dissociation inhibitor 1; SERC: Phosphoserine Amino transferase; NPM: Nucleophosmin; OAT: Ornithine Amino transferase, PRS8: 26S Proteasome (regulatory subunit 8); SBSN: Suprabasin; PTPA: Serine/threonine- Protein Phosphatase 2A; CRC: Colorectal Carcinoma; TCA: Tricarboxylic Acid Cycle; PPP: Pentose Phosphate Pathway; TALDO: TransaldolaseIntroduction
Resistance of tumor cells to diverse therapies is a major hurdle to curing cancer. A recent finding that prokaryotic and eukaryotic cell death correlates with proteome, rather than genome, damage [1,2] led us to seek correlations between tumor cell resilience and proteome damage.Functional homeostasis requires conformational integrity and stability of cellular proteins that can be influenced by physiological post-translational modifications (PTMs) as well as toxic PTMs, such as those caused by reactive oxygen species (ROS). Oxidative modifications of protein side chains are stable and deleterious to protein function. After the selective breakdown of damaged proteins has occurred, their residual levels can (i) serve as cumulative markers for incurred toxic oxidative stress [3] and (ii) allow for anticipation of severe phenotypic consequences of persistent proteome damage [4]. Irreversible ROS-induced protein damage (carbonylation) accumulates in human and animal cells exponentially with age [5] and may be the root cause of cellular morbidity [4] and death [1,2].
Increase in protein carbonylation (PC) levels can result from: a decrease in the antioxidant defense system, a reduced ability of cells to remove damaged proteins and an increase in protein susceptibility to oxidative modification [6]. Studies on differential proteome resistance to oxidative stress caused by UVC light and by ionizing radiation have shown the same correlation between cell survival and protein carbonylation in bacteria [1] and invertebrates [2].
These findings motivated us to investigate whether the correlation between cell mortality and the extent of protein carbonylation holds also for two tumor cell lines: primary colon adenocarcinoma, SW480, and its derived metastasis, SW620.
Here, we show that the cell line derived from the primary colon adenocarcinoma, SW480, is more susceptible to UVC-induced oxidative protein damage, compared to its metastasis, SW620. The resistance of SW620 cells correlates with lower levels of ROS and of inherently misfolded proteins. Proteomic analyses show increased expression of proteins that promote cell radiation resistance and reveal reduced levels of stress and protein damage in the metastatic cell line correlating with the observed increased resistance and survival. A deeper insight into the patterns of the cellular proteome damage could define biomarkers-predictors of cancer cell fitness before and after therapeutic intervention. Our data suggest that targeting damage to cancer cell proteome could synergize with cytotoxic effects of many standard anti-cancer therapies and stand itself as an effective therapy.
Materials and Methods
Culture conditionsAdenocarcinoma cell lines SW480 and SW620 were cultured in high glucose Dulbecco’s Modified Eagle Medium (DMEM 4500 mg/L) supplemented with 10% of fetal bovine serum (FBS) and 1% of antibiotic (penicillin/streptomycin). Cells were grown at 37 °C in humidified incubator with 5% CO2 and passaged at 80% confluence by 0.05% Trypsin EDTA.
Irradiation by UVC light
Cells were irradiated after reaching 80% of confluence. Prior to irradiation, the media was removed by aspiration and washed twice with 2 ml of phosphate buffered saline (PBS) for removal of dead cells. For irradiation cells were covered with 5 ml of PBS. UVC irradiation of cells was performed at 37 °C to final doses of 100, 1000, 2000 and 3000 J/m2. After irradiation, cells were scraped from Petri dish, centrifuged 5 min at 2000 rpm and frozen at -80 °C in order to measure the amount of protein damage accumulated during the irradiation.
To measure the amount of protein damage after the recovery from radiation, PBS was removed by aspiration and replaced by supplemented DMEM for 18 h incubation.
The viable cells were counted after 18 h using Trypan blue and a haemocytometer.
Preparation of total protein extracts
Cell pellets were resuspended in PBS containing 1% nonionic detergent Triton X-114 Surfact-Amps (Thermo Fisher Scientific, Rockford, IL, USA) and a mixture of protease inhibitors (Thermo Fisher Scientific, Rockford, IL, USA). Cells were lysed using a mechanical homogenizer and glass beads (425-600 μm). Cell lysates were centrifuged for 20 min at 10000 × g. Samples were then supplemented with 10 mg/100 mL lipid removal agent (13360-U, Sigma Aldrich-Supelco, Bellefonte, PA, USA), incubated for 1 h at room temperature with shaking and pelleted for 15 min at 10000 × g. The amount of proteins in the supernatant was measured by the Micro BCA™ Protein Assay Reagent Kit (Thermo Fisher Scientific- Pierce Biotechnology, Rockford, IL, USA). Protein extracts diluted to 10 μg/mL were loaded into Maxisorp wells (Thermo Scientific Nunc, Rockford, IL, USA) and incubated overnight at 4 °C to allow proteins to adsorb to the surface.
Protein carbonylation measurement
Adsorbed proteins were derivatized using carbonyl reagent 2,4-dinitrophenylhydrazine (DNPH) at the concentration of 12 μg/ mL. Derivatization of adsorbed proteins was followed by detection of derivatized dinitrophenol (DNP)-carbonyl by a rabbit anti-DNP primary antibody (Sigma Aldrich, St Louis, MO, USA) and goat antirabbit secondary antibody conjugated to HRP (Jackson Immuno Research, West Grove, PA, USA). Stocks of antibodies were prepared at ~1 μg/μL and used at 1:7000 dilutions. Subsequent incubation with enzyme substrate 3, 3, 5, 5-tetramethylbenzidine resulted in a colored product that was quantified using a SunriseTM (Tecan, Männedorf, Switzerland) microplate reader with maximum absorbance at 450 nm.
Assessment of ROSFor analysis of basal intracellular ROS, cells were collected, washed with PBS and incubated in the dark with 10 μM 2’,7’-dichlorofluorescein diacetate (H2DCFDA, Sigma) for 30 min at 37 °C and subsequently analyzed on FACS Calibur flow cytometer. In order to measure ROS after exposure to UVC irradiation, 1.5×10⁵ cells per well were plated in 12 well plates. The following day cells were washed three times with PBS and covered with 0.5 ml of 10 10 μM H2DCFCA in PBS. The cells were irradiated with indicated doses of UVC light (0, 100, 1000, 2000 and 3000 Jm-2), collected and resuspended in 10 10 μM H2DCFCA in PBS.
The fluorescence of 10000 cells resulting from the intracellular conversion of non-fluorescent H2DCFDA into fluorescent 2’, 7’-dichlorofluorescein (DCF) was measured in FL1 channel. The collected data was analyzed using FlowJo software version 7.2.5 for Microsoft (Tree Star, San Carlos, CA, USA) to determine the mean green fluorescence intensity after the each treatment. The fluorescence after the staining with H2DCFDA for each cell line was corrected for the auto-fluorescence of the corresponding cell line. The results are expressed as mean fluorescence of 10000 cells of each cell line.
Western blot determination of chaperone levels
Protein extracts (25 μg) were resolved by SDS-polyacrylamide gel electrophoresis (SDS-PAGE) using 10% polyacrylamide gels and blotted on nitrocellulose membrane (0.45 μm, Thermo Scientific). The membranes were blocked for 1 h with 5% nonfat milk (Carl Roth GmbH, Karlsruhe, Germany) in TBS containing 0.1% Triton X-100 (Sigma Aldrich, St Louis, MO, USA) and probed with primary antibodies diluted in blocking buffer over night at 4 °C with shaking.
The following primary antibodies were used: rabbit anti-HSP70 (1:20000, Abcam, Cambridge, MA, USA), rabbit anti-HSP90 (1:200, Abcam, Cambridge, MA, USA), rabbit anti-HSP105 (1:20000, Abcam, Cambridge, MA, USA), rabbit anti-MnSOD (1:2000, Enzo Life Sciences, Farmingdale, NY, USA), rabbit anti-Cu/ZnSOD (1:2000, Enzo Life Sciences, Farmingdale, NY, USA) and mouse anti-GAPDH (1:600, Millipore, St. Luis, MO, USA). The recognized proteins were detected using horseradish peroxidase-labeled anti-rabbit IgG (1:20000, Jackson Immunoresearch, West Grove, PA, USA) or antimouse IgG (1:10000, Jackson Immunoresearch, West Grove, PA, USA) produced in goat [7]. Western blots were developed using enhanced chemiluminiscence (Luminol, SantaCruz Biotechnology, Santa Cruz, CA, USA) and quantified using ImageJ.
Proteomics Analysis (Oxi-DIGE)
Protein extractionCell lines were treated with UVC irradiation killing 90% of the population: 1835 J/m2 for SW480 and 4000 J/m2 for SW620. Irradiation was performed as above and cell pellet quadruplicates were stored at -80 °C.
Protein extraction was performed on pellets containing 5×10⁶ cells by using 150 μL of UTCDTT buffer containing 8 M urea, 2 M thiourea, 4% CHAPS (3[(3-cholamidopropyl)dimethylamonio]- 1-propanesulphonate) and 10 mM dithiotreitol (DTT). Samples were homogenized and sonicated for 10 s (20 kHz). After overnight incubation on Thermomix (Eppendof, Wien, Austria) at 1200 rpm and 4 °C, cell lysates were centrifuged at 15000 × g for 2 h at 4 °C and protein concentration was determined using Bradford assay [9].
Carbonyl labeling
Each sample (100 μg of protein extract) was derivatized with 5 μL of 12 mM CF647DI Hydrazide fluorescent dye (Biotium Inc, Hayward, CA, USA) for 1 h at 25 °C. To remove the unreacted dye, proteins were precipitated with 20% TCA and 0.2% deoxycholate for 15 min at 4 °C. The pellet was washed once with 20% DMF in acetone and stored for 1 h at -20 °C. Subsequently, the pellet was washed for the second time with 100% acetone and stored for 30 min at -20 °C. Dry pellets were solubilized in UTC buffer Protein concentration was determined using Bradford assay [9].
Cy-NHS labeling
Each sample (40 μg of previously extracted proteins labeled with CF647DI Hydrazide) was labeled with 0.8 μL of 400 pM Cy3 NHS ester fluorescent dye (Lumiprobe, Hannover, Germany). The internal standard containing equal amounts of every analyzed sample (8 times 40 μg of protein extract) was labeled with 10.4 μL of 400 pM Cy2 NHS ester fluorescent dye (Lumiprobe, Hannover, Germany).
Isoelectric focusing and SDS-PAGE
ImmobilineTM DryStrips (24 cm, GE Healthcare, Buckinghamshire, UK) were rehydrated for 7 h at room temperature using rehydration buffer containing 8 M urea, 2 M thiourea, 4% CHAPS, 0.0068% DeStreak reagent, and 0.0024% IPG Buffer pH 3-11 NL. Samples were loaded on strips pH 3-11 NL by the sample Cup-loading method. An Ettan IPGphor3 (GE Healthcare, Buckinghamshire, UK) was used to perform isoelectric focusing for a total of 44 350VH. An equilibration step was carried out in buffers containing 6 M urea, 2% SDS, 30% glycerol, and 50 mM Tris-HCl, pH 8.6, together with 1% m/w DTT or 4.7% m/w iodoacetamide, respectively, for reduction and alkylation of disulfide bridges. Strips were then rinsed with SDS electrophoresis buffer (containing 25 mM Tris, 192 mM glycine and 0.2% SDS, pH 8.6) and set onto gradient SDS-PAGE gels 8-18% acrylamide-bis acrylamide. Electrophoresis was performed with two Ettan Dalt 6 Electrophoresis Unit (GE Healthcare, Buckinghamshire, UK) at 15 °C, protected from light with 2.5 W/gel overnight. Gels were scanned by a Typhoon FLA 9500 scanner (GE Healthcare, Buckinghamshire,UK), with excitation/emission wavelengths corresponding to each fluorescent dye (473/510 nm for Cy2 NHS, 532/575 nm for Cy3 NHS and 635/665 nm for CF647DI hydrazide).
Data analysis
Data and statistical analysis was carried out with the SameSpots software (Totallab, Newcastle upon Tyne, UK). Spots of interest were selected according to two criteria: (i) if significant difference in expression and/or carbonylation of protein spots between the cell lines was confirmed (p < 0.05, T-test), and (ii) if the fold change varied for at least 50%. Protein carbonylation signal was normalized to the protein expression signal within each spot (CF647DI spot volume/ Cy3 NHS spot volume) and the relative modification index (RMI) was expressed as ratio of the CF647DI signal corrected by the normalized Cy3 NHS expression signal between SW620 and SW480 cell lines. A p value for each carbonylation signal comparison was evaluated (T-test). Hierarchical clustering and PCA was performed using DANTE R package for R (http://omics.pnl.gov/software/danter).
Mass spectrometry
The protein spots showing significant difference in expression and/or oxidation levels between SW480 and SW620 cell lines were hand-picked by using OneTouch 2D gel spot-picker, 1.5 mm in diameter (Gel Company, San Francisco, CA, USA) and the Screen Picker (Proteomic Consult, Kampenhout, Belgium).
The spots of interest were sent for analysis to 3P5 Proteomic Facility, Université Paris Descartes, Sorbonne Paris Cité. In-gel digestion was carried out with trypsin, according to the published procedure with minor adjustments [10]. Mass spectrometry (MS) and MS/MS Orbitrap analyses were performed using an Ultimate 3000 Rapid Separation Liquid Chromatographic (RSLC) system (Thermo Fisher Scientific, Rockford, IL, USA) online with a hybrid LTQ-Orbitrap-Velosmass spectrometer (Thermo Fisher Scientific, Rockford, IL, USA). Briefly, peptides were dissolved in 4 μL of 10% acetonitrile (ACN)-0.1% trifluoroacetic acid (TFA). The peptides were then loaded and washed on a C18 reverse phase precolumn (3 μm particle size, 100 Å pore size, 150 μm i.d., 0.5 cm length). The loading buffer contained 98% H2O, 2% ACN and 0.1% TFA. Peptides were then separated on a C18 reverse phase resin (2 μm particle size, 100 Å pore size, 75 μm i.d.,15 cm length) with a 16 min gradientfrom 100% A (0.1% formic acid (FA) and 100% H2O) to 50% B (80% ACN, 0.085% FA and 20% H2O). The Linear Trap Quadrupole Orbitrap mass spectrometer acquired data throughout the elution process and operated in a data dependent scheme with full MS scans acquired with the Orbitrap, followed by up to 20 LTQ MS/MS CID spectra on the most abundant ions detected in the MS scan. Mass spectrometer settings were: full MS (automatic gain control (AGC): 1×10⁶, resolution: 6×10⁴, m/z range 400-2000, maximum ion injection time: 500 ms) and MS/MS (AGC: 5×10³, maximum injection time: 20 ms, minimum signal threshold: 500, isolation width: 2 Da, dynamic exclusion time setting: 30 s). The fragmentation was permitted for precursors with a charge state of 2,3,4 and above. For the spectral processing, the software Proteome Discoverer 1.4.0.288 was used. The threshold of signal-to-noise for extraction values was 3. Database searches were carried out using Mascot version 2.4 (MatrixScience,London, UK) on “homo sapiens” proteins (20273 sequences) from the SwissProt databank [11] containing 547 599 sequences (195 014 757 residues) (February 2015). The search parameters were as follows: carbamidomethylationas a variable modification for cysteins, and oxidation as a variable modificationfor methionines. Up to 1 missed tryptic cleavage was tolerated and mass accuracy tolerance levels of 5 ppm for precursors and 0.56 Dafor fragments were used for all tryptic mass searches. Positive identification was based on a Mascot score above the significance level (i.e. 5%). The reported proteins were always those with the highest number of peptide matches.
Gene ontology
Gene ontology analysis was performed using the Panther database (http://www.pantherdb.org/) [12].
Results
SW480 cells are more sensitive than SW620 to UVC lightinduced oxidative stressUVC irradiation kills both, SW480 cells derived from a primary human adenocarcinoma and SW620 derived from its metastasis. However, SW480 cell line displays greater sensitivity than SW620: 50% survival of SW480 cells is observed at 1300 Jm-2, while that of SW620 is at 2100 Jm-2. There is a significant difference in survival between SW480 and SW620 cell lines at each UVC dose (P≤0.0001 for all dose rates, except for the highest 3000 Jm-2 dose, P≤0.05). Decreased survival is correlated with an increase in protein carbonylation (PC) measured immediately following UVC irradiation. Consistent with the survival decline, SW480 cells show an increase in PC at lower doses, relative to SW620 (Figure 1A).
After the recovery period of 18 h we observed a decrease in PC at 100 and 1000 Jm-2 back to the PC level before irradiation, in both cell lines. Although the level of residual PC remains significantly elevated at higher doses (at 2000 Jm-2 P≤0.0001 for SW480 and P≤0.001 for SW620, at 3000 Jm-2 P≤0.0001 for both), probably due to the prevalent mortality in the population, one can see that PC is higher in SW480 cells at 3000 Jm-2 compared to SW620 (P≤0.01) (Figure 1B). Since the PC level 18 h after irradiation does not correlate with mortality of SW480 and SW620 cells, we can conclude that the PC detected immediately after irradiation is the one related to cell survival presumably by being determinant of the capacity for cell recovery from UVC damage.
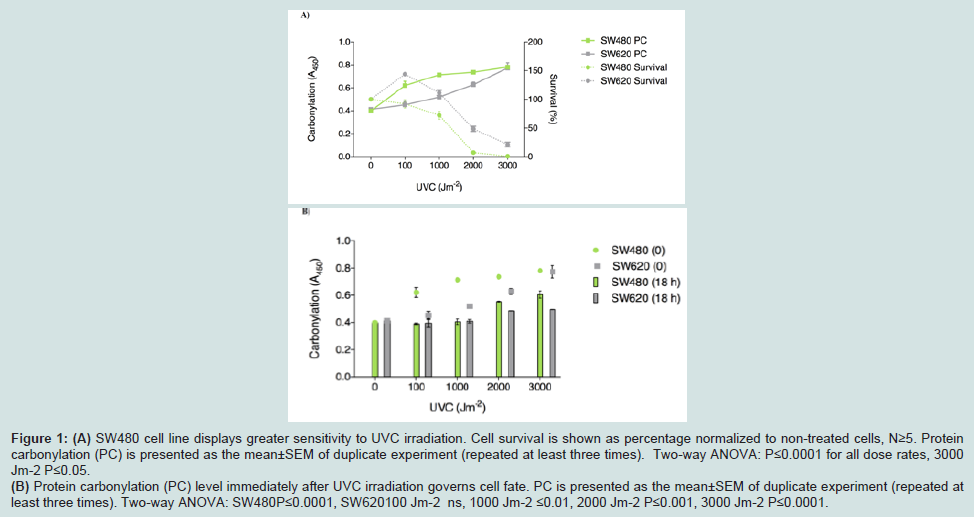
Figure 1: (A) SW480 cell line displays greater sensitivity to UVC irradiation. Cell survival is shown as percentage normalized to non-treated cells, N≥5. Protein carbonylation (PC) is presented as the mean±SEM of duplicate experiment (repeated at least three times). Two-way ANOVA: P≤0.0001 for all dose rates, 3000 Jm-2 P≤0.05. (B) Protein carbonylation (PC) level immediately after UVC irradiation governs cell fate. PC is presented as the mean±SEM of duplicate experiment (repeated atleast three times). Two-way ANOVA: SW480P≤0.0001, SW620100 Jm-2 ns, 1000 Jm-2 ≤0.01, 2000 Jm-2 P≤0.001, 3000 Jm-2 P≤0.0001.
To explore the cause of differential oxidative proteome damage in SW480 and SW620 cell lines, both spontaneous and UVC-induced, we refer to more advanced studies with bacterial cells where it was shown that PC is affected by the (i) level of ROS, (ii) efficacy of elimination of oxidized proteins by selective proteolysis and (iii) characteristic intrinsic susceptibility of each protein molecule to ROS effects [13]. The latter is based on the fact that proteins possess native structures assuring durability of their function by an evolved resistance to oxidation [4]. Therefore, mistakes in biosynthesis or folding and polymorphic mutations can break the resistance to oxidation [14,15]. To explore origin of the observed differential sensitivity to proteome oxidative damage of the two cell lines, we measured ROS levels before UVC exposure. Indeed, the results show 49% higher basal ROS level in SW480 cells than in SW620 (P<0.0001) (Figure 2A).
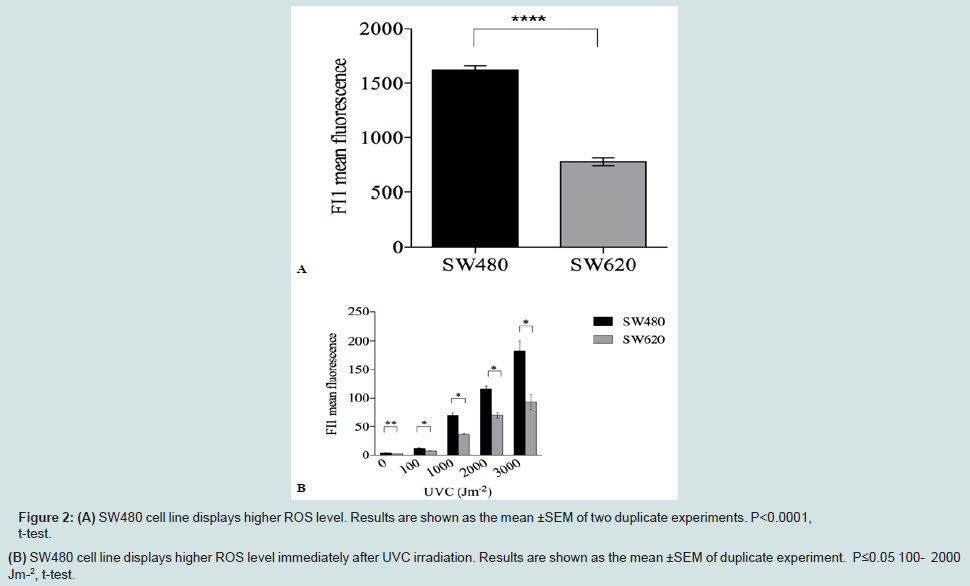
Figure 2: (A) SW480 cell line displays higher ROS level. Results are shown as the mean ±SEM of two duplicate experiments. P<0.0001,t-test.(B) SW480 cell line displays higher ROS level immediately after UVC irradiation. Results are shown as the mean ±SEM of duplicate experiment. P≤0.05 100- 2000Jm-2, t-test.
Identification of proteins susceptible to PC
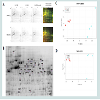
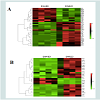
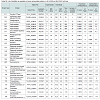
To further study the relationship between PC and mortality in these cell lines, we undertook a detailed proteomic analysis of differences in expression levels as well as carbonylation at the level of individual protein spots (Figures 3A and 3B). We compared the two cell lines at 90% UVC-induced mortality, to identify proteins that are most susceptible to PC and could potentially serve as targets in anti-cancer treatments. We aimed also to find the cause of increased resistance of metastatic cells in the differential protein expression patterns. All gels were aligned using Internal Standard Image and alignment was applied to the rest of the images for spot identification. A total of 953 spots were detected. We detected the total of 35 proteins significantly up-regulated upon UVC irradiation, 13 in the SW480 and 22 in the SW620 metastatic cell line (Figures 3C and 3D). Surprisingly, among these 22 up-regulated proteins, 19 were more carbonylated in SW620 and only 3 in SW480 cell line (Figures 4A and 4B, Tables 1A and 1B).
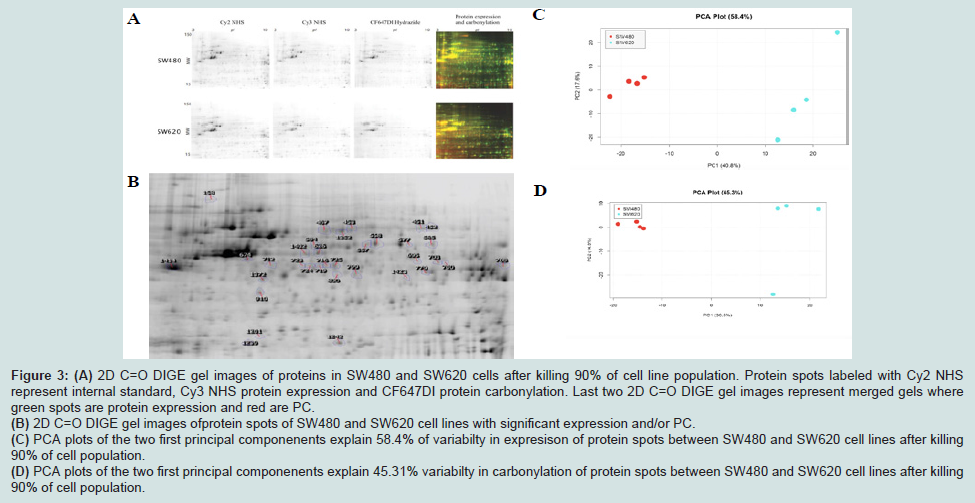
Figure 3: (A) 2D C=O DIGE gel images of proteins in SW480 and SW620 cells after killing 90% of cell line population. Protein spots labeled with Cy2 NHSrepresent internal standard, Cy3 NHS protein expression and CF647DI protein carbonylation. Last two 2D C=O DIGE gel images represent merged gels wheregreen spots are protein expression and red are PC. (B) 2D C=O DIGE gel images ofprotein spots of SW480 and SW620 cell lines with significant expression and/or PC. (C) PCA plots of the two first principal componenents explain 58.4% of variabilty in expresison of protein spots between SW480 and SW620 cell lines after killing90% of cell population. (D) PCA plots of the two first principal componenents explain 45.31% variabilty in carbonylation of protein spots between SW480 and SW620 cell lines after killing90% of cell population.
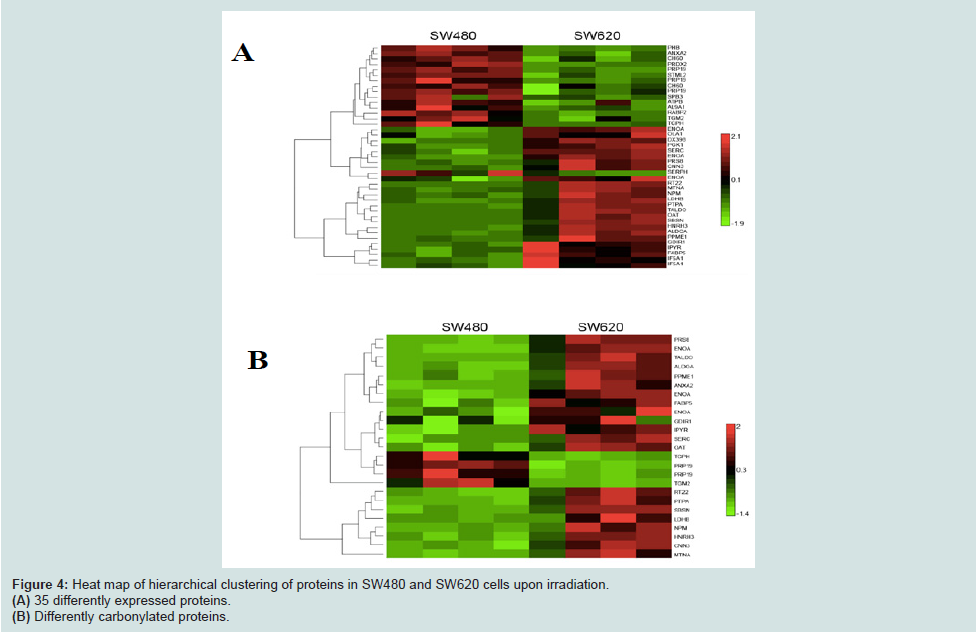
Figure 4: Heat map of hierarchical clustering of proteins in SW480 and SW620 cells upon irradiation.(A) 35 differently expressed proteins.(B) Differently carbonylated proteins.
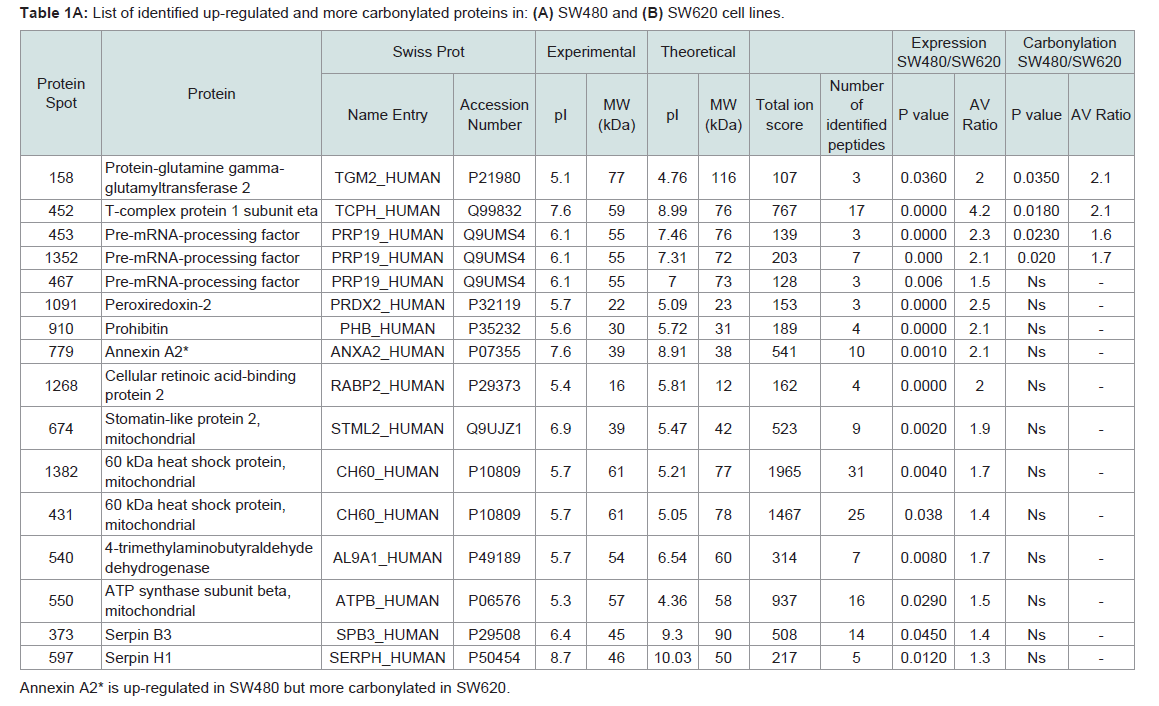
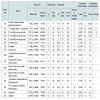
Table 1A: List of identified up-regulated and more carbonylated proteins in: (A) SW480 and (B) SW620 cell lines.
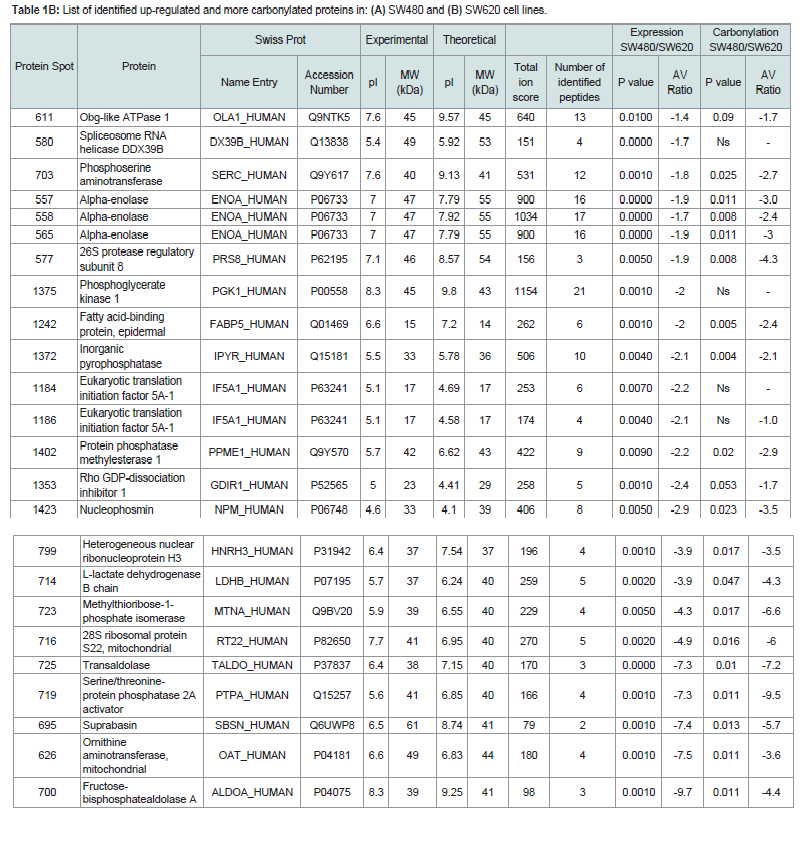
Table 1B: List of identified up-regulated and more carbonylated proteins in: (A) SW480 and (B) SW620 cell lines.
Although we observed significantly up-regulated proteins associated with molecular function in both cell lines, we detected a larger number of up-regulated proteins in SW620 cells relative to SW480. In particular, we identified 7 up-regulated proteins with catalytic activity (GO:0003824) in SW480 (Supplementary Table S 1A) and 13 in SW620 cell line (Supplementary Table S 1B). Also, two proteins were significantly carbonylated in SW480 cell line, proteinglutamine gamma-glutamyltransferase 2 (TGM2) and pre-mRNAprocessing factor 19 (PRP19). TGM2 has a role in progression of several types of cancers [16] and PRP19 is known for its multiple roles in pre-splicing, ubiquitination and apoptosis [17]. Moreover, we found 7 up-regulated proteins involved in binding (GO:0005488) in SW620 (Supplementary Table S 1B) compared to 3 in SW480 (Supplementary Table S 1A).
According to the biological process, we found 12 up-regulated proteins connected with metabolic activities (GO:0008152) in SW480 (Supplementary Table S 2A) and 17 in SW620 cells (Supplementary Table S 2B). In addition to TGM2 and PRP19, we detected increased protein carbonylation in one of the chaperonin proteins essential for protein folding: the T-complex protein 1 subunit eta (TRIC) in SW480 [18].
Four proteins associated with metabolic function in SW620 cell line (Supplementary Table S 2B) were up-regulated without changes in carbonylation: obg-like ATPase 1 (OLA1), spliceosome RNA helicase DDX39B (DX39B), phosphoglycerate kinase 1 (PGK1), eukaryotic translation initiation factor 5A-1 (IF5A1). These proteins are reported to be up-regulated in tumor cells [19-22].
We found two proteins associated with cellular pathways to be up-regulated in SW480 cells: PRP19, as a part of mRNA splicing pathway (P00058) and mitochondrial ATP synthase subunit beta (ATPB) involved in an ATP synthesis (P02721) (Supplementary Table S3A). In the metastatic cell line, we identified in total 6 up regulated proteins involved in 7 different pathways (Supplementary Table S3B). Alpha enolase (ENOA), fructose-biphosphate aldolase A (ALDOA) and phosphoglicerate-kinase 1 (PGK1) are up-regulated in glycolysis pathway (P00024). The latter protein is not oxidatively modified and previous studies show that increased expression of PGK1 in colon cancer is associated with metastasis [22] and could promote radioresistance [23].
SW480 cells have increased expression of HSP105 chaperone
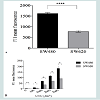
Furthermore, we sought to measure the levels of several main groups of protein chaperones, often indicative of the cellular proteome quality and sensitivity to oxidation [4,6]. In addition, chaperones have multiple roles in the resistance of cancer cells to various anticancer treatments [24-26].
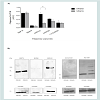
In this context, we determined basal expression levels of HSP70, HSP90 and HSP105 in both cell lines. Interestingly, we found an increased expression of HSP105 in SW480 cells. On the other hand, we did not detect a significant difference of HSP70 and HSP90 expression, as well as the levels of ROS scavenging enzymes MnSOD and Cu/ZnSOD ((Figures 5A and 5B)).
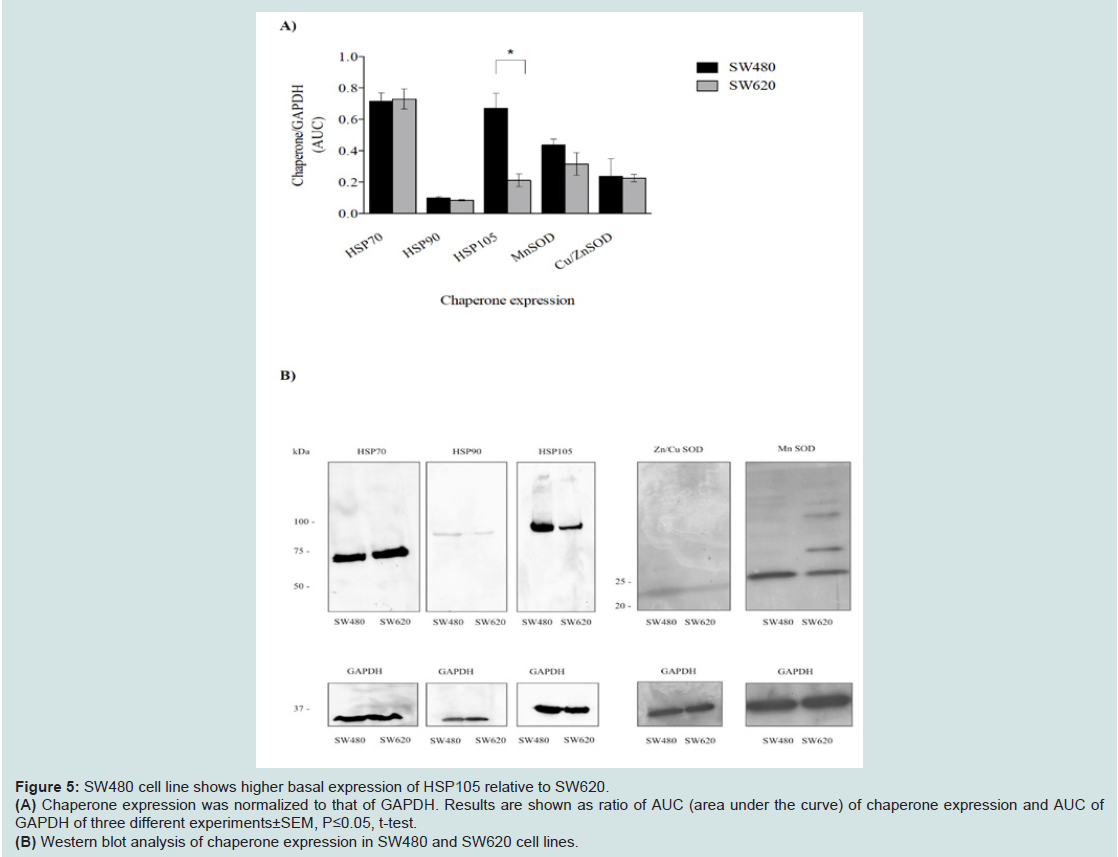
Figure 5: SW480 cell line shows higher basal expression of HSP105 relative to SW620.(A) Chaperone expression was normalized to that of GAPDH. Results are shown as ratio of AUC (area under the curve) of chaperone expression and AUC ofGAPDH of three different experiments±SEM, P≤0.05, t-test.(B) Western blot analysis of chaperone expression in SW480 and SW620 cell lines.
Discussion
Our aim was to investigate the relationship between protein damage and mortality of primary tumor adenocarcinoma cell line SW480 and of its metastasis SW620 after exposure to oxidative stress induced by UVC light. Oxidative stress underlies the cytotoxic activity of numerous chemotherapy treatments [27,28].UVC is highly effective in producing ROS [1] and has been used in establishing the relationship between protein damage and bacterial cell killing [1] and as a diagnostic tool for varying cellular biosynthetic fitness [4]. In bacterial model systems, E. coli and D. radiodurans, protein carbonylation was shown to accumulate with increasing doses of UVC up to a characteristic saturation level [1]. Furthermore protein carbonylation was shown to reduce the efficacy and fidelity of key biosynthetic processes including DNA replication and repair [4].
To seek for correlation between cell mortality and the amount of protein carbonylation in human tumor cell lines, a pair of isogenic colon carcinoma cell lines, SW480 (primary tumor) and SW620 (metastasis) was studied. We found that the metastatic SW620 cell line is more resistant to UVC irradiation than its non-metastatic progenitor SW480. Just like in bacteria [1] and some invertebrates [2], the total amount of protein carbonylation (PC)-an irreversible oxidative protein modification-correlates with the survival of both cell lines (Figure 1). Like in bacteria, the total amount of PC is a reporter of cellular fitness of these cell lines predictive of the likelihood of cell death, a parameter relevant to cancer treatment. In support of these ideas, the restoration of PC back to the initial levels occurred after 18 h of post-irradiation recovery for UVC doses of 100 and 1000 Jm-2 at high survival of cell population. However, the irradiated cells were unable to reduce the PC levels at 2000 Jm-2 (or higher doses), probably because the initial damage was detrimental to cellular recovery by protection, defense, repair and maintenance systems.
What provides the increased resistance of the metastatic cell line SW620 to oxidative stress? We found that SW480 cells exhibit an increased basal level of ROS relative to SW620 (Figure 2A). ROS measurements immediately after the exposure of cell lines to UVC doses of 100, 1000, 2000 and 3000 Jm-2 show increased ROS levels in SW480 cells compared to SW620 cells, suggesting a more efficient ROS-suppression in the SW620 cell line (Figure 2B). However, both cell lines have similar levels of two main ROS scavenging enzymes, nSOD and Cu/ZnSOD which indicates that the increased ROS level in SW480 cells may be a result of differences in the active metabolic pathways between the two lines, e.g. oxidative phosphorylation versus glycolysis. SW480 cell line is also characterized by higher level of HSP105 chaperone relative to the metastatic cell line that could be a consequence of an adaptive response to increased ROS levels. Functions of this chaperone include refolding of misfolded proteins, stabilization of proteins during folding events in the ER as well as prevention of aggregation of misfolded proteins. Therefore, its increased level in SW480 cell line may signal the response to increased ROS and, although it is more sensitive than SW620, could still be limiting the impact of ROS on the proteome by reducing proteome sensitivity to oxidative damage.
In the context of cancer therapy, it has become increasingly important to characterize the molecular and cellular responses by which tumor cells adapt to and buffer against potentially lethal insults. Protein chaperones have appeared as potential targets in anti-cancer therapies. The HSP90 molecular chaperone is expressed at high levels in a wide variety of human cancers including melanoma, leukemia, and cancers in colon, prostate, lung, and breast. Accordingly, HSP90 inhibition can suppress certain cancer-causing client proteins and therefore represents a therapeutic target [29]. In experimental models, HSP70 overexpression has been shown to increase the tumorigenicity of cancer cells while HSP70 down-regulation decreases tumorigenicity [30]. In this way, HSP70 antisense constructs have chemo-sensitizing properties and, upon adenovirus-mediated delivery, may even kill cancer cells in the absence of additional treatments [31].
In several cancer cell lines, HSP27 antisense oligonucleotides enhanced apoptosis, sensitized to chemotherapy and delayed tumor progression [32,33]. These effects could be due to enhanced PC because in bacteria strong beneficial and deleterious phenotypes of chaperone up- and down-regulation depend on reduction and increase in PC respectively [4].
We find that SW480 cells exhibit an increased expression of HSP105, probably due to a higher demand for its activity. Therefore, one can speculate that proteins are vulnerable targets for oxidative damage also in human cells.
In order to study more in depth the relationship between PC and mortality in these cell lines, we undertook a detailed proteomic analysis of differences in expression as well as carbonylation levels of individual protein spots. We compared the two cell lines at UVCinduced mortality of 90%, aiming to recognize proteins that are most sensitive to PC and could potentially serve as targets in anticancer treatments. In addition, we sought to identify the reason(s) for the increased resistance of metastases in the differential protein expression patterns. In other words, which proteins should be targeted for effective killing of cancer cells? Their increased susceptibility to PC in dying cells may provide plausible candidates.
Previous studies on protein expression report 9 differently expressed proteins in SW480 and SW620 cell lines [34]. Among reported proteins, we have confirmed a decreased expression of peroxiredoxin 2 (PRDX2) and an increased expression of alpha enolase (ENOA) in SW620 cells relative to SW480. Some of the difference between the published study and the results presented herein may result from the effects of UVC irradiation. Nevertheless, some of the proteins with higher expression levels in SW620 cells relative to SW480 may elucidate the increased resistance of SW620. Phosphoglycerate kinase 1 (PGK1) has been shown to promote radioresistance in human U251 cells [23]. Further, spliceosome RNA helicase DDX39B (DX39B) is up-regulated in lung squamous cell carcinoma and promotes cancer cell growth [13]. According to our results, both of these proteins could be responsible for increased resistance of SW620, thus, they present potential anti-cancer targets also in colon adenocarcinoma treatments. Interestingly, suppression of obg-like ATPase 1 (OLA1), another highly expressed protein in SW620 cells, has already been proposed to inhibit cancer migration and invasion [35].
Moreover, proteins with increased expression in SW480cells relative to SW620 reveal that the primary tumor cell line is experiencing oxidative stress, coherent with the result of its decreased survival. For example, PRDX2, T-complex and TGM2 tend to be upregulated as a part of the cell response to UV light, oxidative stress and protein damage accumulation [36-38].
A PC higher in SW480 cells than in SW620 is a property of three proteins: TGM2, PRP19 and T-complex chaperonin. Possible reasons for the increased sensitivity of the particular cell line should first be sought among the functions of those proteins. Interestingly, TGM2 and PRP19 have previously been shown to promote cancer cell survival when overexpressed [39,40], which is consistent with our results. Namely, high level of carbonylation has been shown to inactivate protein function, thus, rendering the cells deprived of the particular protein activity (similarly to a conditional mutant). In the case of these two proteins, the result is decreased survival upon stress induction. Indeed, TGM2 has been proposed as a possible novel target for clinical cancer therapy and a sensitizer in addition to the novel marker of prognosis and prediction about the susceptibility of anti-cancer agents [41]. By analogy and according to the results obtained herein, a similar role could be proposed for PRP19.
Furthermore, it has been shown that the T-complex chaperonin is overexpressed in colorectal cancer, which may relate to poorer clinical outcome [42]. Increased carbonylation of the T-complex chaperonin in SW480 cells may, thus, be a marker and/or a reason of their higher sensitivity in comparison to SW620.
Interestingly, among the proteins with increased PC in SW620 cells relative to SW480, there is a number of proteins that participate in metabolic processes like glycolysis and pentose phosphate pathway (PPP): ENOA, ALDOA and transaldolase (TALDO). PPP activity is increased in response to oxidative stress [43], radiation [44] and chemotherapies [45], which elicit high ROS levels and provoke an adaptive response by augmenting the PPP. Thus, increased PC of members of PPP indicates their diminished activity in the metastatic cell line.
In addition, proteins whose function is related to increased tumor growth, migration and adhesion Rho GDP-dissociation inhibitor 1 (GDIR1), phosphoserine aminotransferase (SERC), nucleophosmin (NPM), ornithine aminotransferase (OAT), 26S proteasome (regulatory subunit 8) (PRS8), suprabasin (SBSN), serine/threonine threonineprotein phosphatase 2A (PTPA) activator are both characterized by increased PC and expression in SW620 cell line. This could, in part, result from the fact that the work has been carried out on cell cultures rather than ex vivo tumor samples. Nevertheless, the proteomic profiles are made at 10% cell survival, revealing the proteins that are weak links in the proteome of this cell line. In other words, these proteins could be potential targets for cell killing. Most of them have already been recognized as targets in anti-cancer therapy.
Multiple metabolic pathways fundamental to cell functioning have been recognized as promising targets in anti-cancer drug therapy. Since glycolysis promotes development of colorectal carcinoma (CRC) and modulates cell proliferation [46], several enzymes in glycolytic cascade have been identified as possible targets in anti-cancer therapy [47-51]. Besides, the importance of enzymes in several metabolic pathways, including tricarboxylic acid cycle (TCA), PPP and serine biosynthesis, has been pinpointed in several studies (reviewed in [52]). The observed coherence between our proteomic data and the published ones as well as apparent correlations between oxidation targeted proteins and the empirically chosen therapeutic targets are reassuring.
Although SW480 cells display greater overall sensitivity to UVCinduced protein damage, we found only 3 more carbonylated proteins relative to 19 in SW620 cell line. This result suggests that the observed increase in total PC can be attributed to the high detrimental effect that the irradiation-induced PC has on these three proteins. On the other hand, the increase in PC in the 19 proteins of SW620 is not as high and, therefore, yields an overall less detrimental effect on cell survival.
However, from this limited study, we derive the following conceptual novelty that could be relevant to both emergence and treatment of cancer. Phenotype is function, not information, and cell phenotypes can be generated, maintained and widely varied solely at the level of protein modification, be it physiological or non-physiological (e.g. oxidation), without the necessity of genome modification. Given that cancer evolves through stages by mutation accumulation, an observation in bacteria could shed light to the ageing-cancer connection: the oxidative damage exclusively to the proteome is much more mutagenic than damage to DNA [4]. Thus, PC becomes a candidate for cancer risk prediction, a potential target for cancer prevention by protection against protein oxidation, and a cancer cell fitness biomarker. On the other hand, targeting damage to specific proteins, and proteome as a whole, along with DNA damage, could increase the efficacy of cancer therapies.
Acknowledgements
This work was supported by the Fondation Nelia et Amadeo Barletta, NAOS Group and the Mediterranean Institute for Life Sciences to AN, MP, RL, FAM, AK and MR; and to AMM and MK in part by FP7-REGPOT-2012-2013-1, grant agreement number 316289 - InnoMol and Croatian Science Foundation under the project number 5660.References
- Krisko A, Radman M (2010) Protein damage and death by radiation in Escherichia coli and Deinococcus radiodurans. Proc Natl Acad Sci USA 107: 14373-14377.
- Krisko A, Leroy M, Radman M, Meselson M (2012) Extreme anti-oxidant protection against ionizing radiation in Bdelloid rotifers. Proc Natl Acad Sci USA 109: 2354-2357.
- Dalle-Donne I, Rossi R, Giustarini D, Milzani A, Colombo R (2003) Protein carbonyl groups as biomarkers of oxidative stress. Clin Chim Acta 329: 23-38.
- Krisko A, Radman M (2013) Phenotypic and genetic consequences of protein damage. PLoS Genet 9: e1003810.
- Stadtman ER (1992) Protein oxidation and aging. Science 257: 1220-1224.
- Nyström T (2005) Role of oxidative carbonylation in protein quality control and senescence. EMBO J 24: 1311-1317.
- Towbin H, Staehelin T, Gordon J (1979) Electrophoretic transfer of proteins from polyacrylamide gels to nitrocellulose sheets: procedure and some applications. Proc Natl Acad Sci USA 76: 4350-4354.
- Baraibar MA, Ladouce R, Friguet B (2013) Proteomic quantification and identification of carbonylated proteins upon oxidative stress and during cellular aging. J Proteomics 92: 63-70.
- Bradford MM (1976) A rapid and sensitive method for the quantitation of microgram quantities of protein utilizing the principle of protein-dye binding. Anal Biochem 72: 248-254.
- Shevchenko A, Loboda A, Ens W, Schraven B, Standing KG, et al. (2001) Archived polyacrylamide gels as a resource for proteome characterization by mass spectrometry. Electrophoresis 22: 1194-1203.
- Artimo P, Jonnalagedda M, Arnold K, Baratin D, Csardi G, et al. (2012) ExPASy: SIB bioinformatics resource portal. Nucleic Acids Res 40: W597-603.
- Thomas PD, Campbell MJ, Kejariwal A, Mi H, Karlak B, et al. (2003) PANTHER: a library of protein families and subfamilies indexed by function. Genome Res 13: 2129-2141.
- 13. Dukan S, Farewell A, Ballesteros M, Taddei F, Radman M, et al. (2000) Protein oxidation in response to increased transcriptional or translational errors. Proc Natl Acad Sci USA 97: 5746-5749.
- Krisko A, Radman M (2013) Biology of extreme radiation resistance: the way of Deinococcus radiodurans. Cold Spring Harb Perspect Biol 5: a012765.
- Vidovic A, Supek F, Nikolic A, Krisko A (2014) Signatures of conformational stability and oxidation resistance in proteomes of pathogenic bacteria. Cell Rep 7: 1393-1400.
- Pietsch M, Wodtke R, Pietzsch J, Löser R (2013) Tissue transglutaminase: an emerging target for therapy and imaging. Bioorg Med Chem Lett 23: 6528-6543.
- Yin J, Zhu JM, Shen XZ (2012) New insights into pre-mRNA processing factor 19: a multi-faceted protein in humans. Biol Cell 104: 695-705.
- Spiess C, Meyer AS, Reissmann S, Frydman J (2004) Mechanism of the eukaryotic chaperonin: protein folding in the chamber of secrets. Trends Cell Biol 14: 598-604.
- Clement PM, Johansson HE, Wolff EC, Park MH (2006) Differential expression of eIF5A-1 and eIF5A-2 in human cancer cells. FEBS J 273: 1102-1114.
- Sugiura T, Nagano Y, Noguchi Y (2007) DDX39, upregulated in lung squamous cell cancer, displays RNA helicase activities and promotes cancer cell growth. Cancer Biol Ther 6: 957-964.
- Sun H, Luo X, Montalbano J, Jin W, Shi J, et al. (2010) DOC45, a novel DNA damage-regulated nucleocytoplasmic ATPase that is overexpressed in multiple human malignancies. Mol Cancer Res 8: 57-66.
- Ahmad SS, Glatzle J, Bajaeifer K, Bühler S, Lehmann T, et al. (2013) Phosphoglycerate kinase 1 as a promoter of metastasis in colon cancer. Int J Oncol 43: 586-590.
- Ding H, Cheng YJ, Yan H, Zhang R, Zhao JB, et al. (2014) Phosphoglycerate kinase 1 promotes radioresistance in U251 human glioma cells. Oncol Rep 31: 894-900.
- Jäättela M, Wissing D (1993) Heat-shock proteins protect cells from monocyte cytotoxicity: possible mechanism of self-protection. J Exp Med 177: 231-236.
- Calderwood SK, Khaleque MA, Sawyer DB, Ciocca DR (2006) Heat shock proteins in cancer: chaperones of tumorigenesis. Trends Biochem Sci 31: 164-172.
- Pocaly M, Lagarde V, Etienne G, Ribeil JA, Claverol S, et al. (2007) Overexpression of the heat-shock protein 70 is associated to imatinib resistance in chronic myeloid leukemia. Leukemia 21: 93-101.
- Conklin KA (2004) Chemotherapy-associated oxidative stress: impact on chemotherapeutic effectiveness. Integr Cancer Ther 3: 294-300.
- Gorrini C, Harris IS, Mak TW (2013) Modulation of oxidative stress as an anticancer strategy. Nat Rev Drug Discovery 12: 931-947.
- Fukuyo Y, Hunt CR, Horikoshi N (2010) Geldanamycin and its anti-cancer activities. Cancer Lett 290: 24-35.
- Gurbuxani S, Schmitt E, Cande C, Parcellier A, Hammann A, et al. (2003) Heat shock protein 70 binding inhibits the nuclear import of apoptosis-inducing factor. Oncogene 22: 6669-6678.
- Nylandsted J, Brand K, Jäättela M (2000) Heat shock protein 70 is required for the survival of cancer cells. Ann N Y Acad Sci 926: 122-125.
- 32. Rocchi P, So A, Kojima S, Signaevsky M, Beraldi E, et al. (2004) Heat shock protein 27 increases after androgen ablation and plays a cytoprotective role in hormone-refractory prostate cancer. Cancer Res 64: 6595-6602.
- Song TF, Zhang ZF, Liu L, Yang T, Jiang J, et al. (2009) Small interfering RNA-mediated silencing of heat shock protein 27 (HSP27) increases chemosensitivity to paclitaxel by increasing production of reactive oxygen species in human ovarian cancer cells (HO8910). J Int Med Res 37: 1375-1388.
- 34. Katayama M, Nakano H, Ishiuchi A, Wu W, Oshima R, et al. (2006) Protein pattern difference in the colon cancer cell lines examined by two-dimensional differential in-gel electrophoresis and mass spectrometry. Surg Today 36: 1085-1093.
- Zhang JW, Rubio V, Zheng S, Shi ZZ (2009) Knockdown of OLA1, a regulator of oxidative stress response, inhibits motility and invasion of breast cancer cells. J Zhejiang Univ Sci B 10: 796-804.
- Lee W, Wells T, Kantorow M (2007) Localization and H2O2-specific induction of PRDX3 in the eye lens. Mol Vis 13: 1469-1474.
- 37. Stamnaes J, Pinkas DM, Fleckenstein B, Khosla C, Sollid LM (2010) Redox regulation of transglutaminase 2 activity. J Biol Chem 285: 25402-25409.
- Boudiaf-Benmammar C, Cresteil T, Melki R (2013) The Cytosolic chaperonin CCT/TRiC and cancer cell proliferation. PLoS One 8: e60895.
- 39. Verma A, Wang H, Manavathi B, Fok JY, Mann AP, et al. (2006) Increased expression of tissue transglutaminase in pancreatic ductal adenocarcinoma and its implications in drug resistance and metastasis. Cancer Res 66: 10525-10533.
- Lu X, Legerski RJ (2007) The Prp19/Pso4 core complex undergoes ubiquitylation and structural alterations in response to DNA damage. Biochem Biophys Res Commun 354: 968-974.
- 41. Miyoshi N, Ishii H, Mimori K, Tanaka F, Hitora T, et al. (2010) TGM2 is a novel marker for prognosis and therapeutic target in colorectal cancer. Ann Surg Oncol 17: 967-972.
- 42. Coghlin C, Carpenter B, Dundas SR, Lawrie LC, Telfer C, et al. (2006) Characterization and over-expression of chaperonin t-complex proteins in colorectal cancer. J Pathol 210: 351-357.
- 43. Przybytkowski E, Averill-Bates DA (1996) Correlation between glutathione and stimulation of the pentose phosphate cycle in situ in Chinese hamster ovary cells exposed to hydrogen peroxide. Arch Biochem Biophys 325: 91-98.
- Tuttle S, Stamato T, Perez ML, Biaglow J (2000) Glucose-6-phosphate dehydrogenase and the oxidative pentose phosphate cycle protect cells against apoptosis induced by low doses of ionizing radiation. Radiat Res 153: 781-787.
- Yeh GC, Occhipinti SJ, Cowan KH, Chabner BA, Myers CE (1987) Adriamycin resistance in human tumor cells associated with marked alteration in the regulation of the hexose monophosphate shunt and its response to oxidant stress. Cancer Res 47: 5994-5999.
- Yeh CS, Wang JY, Chung FY, Lee SC, Huang MY, et al. (2008) Significance of the glycolytic pathway and glycolysis related genes in tumorigenesis of human colorectal cancers. Oncol Rep 19: 81-91.
- Macheda ML, Rogers S, Best JD (2005) Molecular and cellular regulation of glucose transporter (GLUT) proteins in cancer. J Cell Physiol 202: 654-662.
- Mazurek S (2007) Pyruvate kinase type M2: a key regulator within the tumour metabolome and a tool for metabolic profiling of tumours. Ernst Schering Found Symp Proc 4: 99-124.
- Pedersen PL (2007) Warburg, me and Hexokinase 2: multiple discoveries of key molecular events underlying one of cancers’ most common phenotypes, the ‘‘Warburg Effect’’, i.e., elevated glycolysis in the presence of oxygen. J Bioenerg Biomembr 39: 211-222.
- Furuta E, Okuda H, Kobayashi A, Watabe K (2010) Metabolic genes in cancer: their roles in tumor progression and clinical implications. Biochim Biophys Acta 1805: 141-152.
- 51. Gupta V, Bamezai RN (2010) Human pyruvate kinase M2: a multifunctional protein. Protein Sci 19: 2031-2044.
- Jones NP, Schulze A (2012) Targeting cancer metabolism--aiming at a tumour’s sweet-spot. Drug Discov Today 17: 232-241.