
Research Article
*Address for Correspondence: Cunshuan Xu, State Key Laboratory Cultivation Base for Cell Differentiation Regulation, Henan Normal University, No. 46, Construction East Road, Xinxiang 453007, Henan Province, China, Tel: +8603733326001; Fax: +8603733325410; E-mail: xucs@x263.net
Jingbo Zhang, State Key Laboratory Cultivation Base for Cell Differentiation Regulation, Henan Normal University, No. 46, Construction East Road, Xinxiang 453007, Henan Province, China, Tel: +8603733326001; Fax: +8603733325410; E-mail: cellkeylab@126.com
Citation: Xu C, Geng X, Qin D, He Y, Zhao L, et al. Proteomics Analysis of Hepatocyte Proliferation Regulated by FGF, PDGF, Insulin, Oncostatin M and Interleukin 2 Signaling Pathways during Rat Liver Regeneration. J Proteomics Computational Biol. 2014;1(1): 8.
Copyright © 2014 Xu C, et al. This is an open access article distributed under the Creative Commons Attribution License, which permits unrestricted use, distribution, and reproduction in any medium, provided the original work is properly cited.
Journal of Proteomics & Computational Biology | Volume: 1, Issue: 1
Submission: 29 August, 2014 | Accepted: 06 October, 2014 | Published: 10 October, 2014
 To validate the reliability of the protein expression abundances detected by 2D-DIGE, six randomly selected proteins, including PLCG2, PIK3R1, NFκB1, TGFβ2, AKT1 and CD47, were further tested by Western blot (Figure 1C). The results showed that the level of PLCG2 significantly increased at 2-12 h, 36 h and 120 h in rat LR after PH (Figure 1Bb), the same as PIK3R1 at 24-36 h and 120 h (Figure 1Bc), NFκB1 at 2 h and 6 h (Figure 1Bd), TGFβ2 at 120 h (Figure 1Be), AKT1 at 2-6 h and 72 h (Figure 1Bf), CD47 at 6-12 h and 168 h (Figure 1Bg). By comparing with the results of 2D-DIGE, the protein expression trends in the both were similar, suggesting that the results of 2D-DIGE were reliable.The liver regeneration-related proteins and their roleIn this study, the protein expression changes in the rat regenerating liver were detected by 2D-DIGE (Figure 2A and 2B) and mass spectrometry. The results showed that, compared with normal control, 5,631 proteins were significantly changed. F-test indicated that, compared with SO groups, 2,168 proteins (Supplementary Table 1) with significant differences (P < 0.05) in PH groups were regarded as liver regeneration-related proteins with 1,518 proteins up-regulated, 411 proteins down-regulated, and 239 proteins up-/down-regulated (that is, up-regulated at some time points after PH and down-regulated at another time points). GO annotation and IPA analysis showed that 1,659 kinds of liver regeneration-related proteins participated in 33 kinds of physiological activities including signal transduction and cell proliferation.
 The expression changes of proteins associated with the cell proliferation signaling pathways during rat liver regeneration
Proteomics Analysis of Hepatocyte Proliferation Regulated by FGF, PDGF, Insulin, Oncostatin M and Interleukin 2 Signaling Pathways during Rat Liver Regeneration
Cunshuan Xu1,2*, Xiaofang Geng1, Dan Qin1,2, Yugui He1,2, Lijun Zhao1, Juanjuan Yu1 and Jingbo Zhang1*
- 1State Key Laboratory Cultivation Base for Cell Differentiation Regulation, Henan Normal University, Xinxiang 453007, China
- 2College of Life Science, Henan Normal University, Xinxiang 453007, China
*Address for Correspondence: Cunshuan Xu, State Key Laboratory Cultivation Base for Cell Differentiation Regulation, Henan Normal University, No. 46, Construction East Road, Xinxiang 453007, Henan Province, China, Tel: +8603733326001; Fax: +8603733325410; E-mail: xucs@x263.net
Jingbo Zhang, State Key Laboratory Cultivation Base for Cell Differentiation Regulation, Henan Normal University, No. 46, Construction East Road, Xinxiang 453007, Henan Province, China, Tel: +8603733326001; Fax: +8603733325410; E-mail: cellkeylab@126.com
Citation: Xu C, Geng X, Qin D, He Y, Zhao L, et al. Proteomics Analysis of Hepatocyte Proliferation Regulated by FGF, PDGF, Insulin, Oncostatin M and Interleukin 2 Signaling Pathways during Rat Liver Regeneration. J Proteomics Computational Biol. 2014;1(1): 8.
Copyright © 2014 Xu C, et al. This is an open access article distributed under the Creative Commons Attribution License, which permits unrestricted use, distribution, and reproduction in any medium, provided the original work is properly cited.
Journal of Proteomics & Computational Biology | Volume: 1, Issue: 1
Submission: 29 August, 2014 | Accepted: 06 October, 2014 | Published: 10 October, 2014
Abstract
Liver regeneration (LR) is of great clinical significance in various liver-associated diseases. LR after partial hepatectomy (PH) can be divided into three distinct phases: priming/initiation, proliferation, and termination. To investigate the mechanism of cell proliferation during rat LR, two-dimensional fluorescence difference gel electrophoresis (2D-DIGE) combined with mass spectrometry was applied to examine the changes in the proteome that occurred at 10 time points after PH. Meanwhile, several proteins were selected to validate the protein levels by Western blot. The results showed that 5,631 proteins were significantly changed in rat LR when compared with normal control. Among them, 2,168 proteins showed significant or extremely significant differences when compared with sham operation (SO) by F-test, which were regarded as liver regeneration-related proteins. Gene Ontology annotation and Ingenuity Pathway Analysis 9.0 (IPA) software analysis indicated that 279 liver regeneration-related proteins were involved in signaling pathways which regulate cell proliferation, and 506 proteins participated in cell proliferation. Analysis of protein synergy by spectral function Ep(t) showed that signal transduction activity of FGF pathway at 2 h, PDGF, insulin and oncostatin M pathways at 12 h, interleukin 2 pathway at 2-36 h were significantly enhanced, and cell proliferation activity was also enhanced at 2-36 h in rat LR. Protein network analysis by IPA software and Kyoto Encyclopedia of Genes and Genomes (KEGG) pathway showed that phospholipase C gamma 2 (PLCG2) was located in the central node of the above-mentioned signaling pathways, and was up-regulated at 2-168 h in rat LR, suggesting that these signaling pathways might promote hepatocyte proliferation in the initial and progressive stages of rat LR via PLCG2.Keywords
Rat liver regeneration; Cell proliferation; Network analysis; Signal transduction; Two-dimensional fluorescence difference gel electrophoresis; Mass spectrometryAbbreviations
AP-1: Activator Protein 1; ATF4: Activating Transcription Factor 4; CREB: cAMP-Response Element Binding Protein; ELK1: ETS Domain-containing Protein; ERK: Extracellular Regulated Protein Kinases; FGF: Fibroblast Growth Factor; IKK: IkB Kinase; JAK: Janus Kinase; MALT: Mucosa-Associated Lymphoid Tissue; MAPK: Mitogen-Activated Protein Kinase; MEK: MAP/ERK Kinase; NF-κB: Nuclear Factor kappa B; PDGF: Platelet Derived Growth Factor; PH: Partial Hepatectomy; PI3K: Phosphatidyl Inositol 3-Kinase; PKC: Protein Kinase C; PLCG2: Phospholipase C Gamma 2; LR: Liver Regeneration; SO: Sham OperationIntroduction
The liver is an important organ with an enormous capacity to regenerate [1]. After partial hepatectomy (PH), hepatocytes can rapidly be activated to enter cell cycle to compensate for the lost liver tissues [2,3], which is called liver regeneration (LR). Studies have proved that rat hepatocytes in G0 phase are activated during 0.5-4 h after PH, and then undergo G0/G1 transition during 4-6 h after PH, cell proliferation during 6-66 h after PH, cell differentiation and structure-function reconstruction during 66-168 h after PH [4]. A number of proteomics studies have been carried out at early phases of LR, typically at 12-24 h after PH, and have pointed out the extreme complexity of the regenerative process involving multiple biochemical pathways [5-7]. Nevertheless, few studies have investigated the molecular mechanisms of cell proliferation in rat LR at the proteome level.Generally, cell proliferation is essential for LR and is regulated by lots of signaling pathways, for example, fibroblast growth factor (FGF), platelet derived growth factor (PDGF), insulin, oncostatin M and interleukin 2 (IL2) signaling pathways [8-12]. Phospholipase C (PLC), belonging to an important component of these signaling pathways, could be activated by cascade reaction. The activated PLC catalyzes the hydrolysis of phosphatidylinositol 4,5-bisphosphate (PIP2) to yield inositol trisphosphate (IP3) and diacylglycerol (DAG). Then Ca2+-dependent protein calmodulin (CALM) is activated through IP3-Ca2+ pathway [13]; IkB kinase (IKK) and extracellular regulated protein kinases (ERK1/2) are activated through DAG-PKC pathway [14]. Subsequently, transcription factors including nuclear factor-kappaB (NF-κB), activator protein-1 (AP-1), ETS domaincontaining protein (ELK1) and cAMP-response element binding protein (CREB) are activated by cascade reaction, and thus promote the expression of proliferation-related genes and cell proliferation [15-19].
To further highlight the mechanisms of hepatocyte proliferation in rat LR at the proteome level, two-dimensional differential gel electrophoresis (2D-DIGE) and mass spectrometry were used to examine protein expression changes during rat LR. Ingenuity Pathway Analysis 7.0 (IPA) software (http://www.ingenuity.com/), Kyoto Encyclopedia of Genes and Genomes (KEGG) pathway (http://www.genome.jp/kegg/) and system biology approaches were applied to analyze protein interactions and cell proliferation activity. The results suggested that FGF, PDGF, insulin, oncostatin M and IL2 signaling pathways played important roles in promoting hepatocyte proliferation in rat LR by activating transcription factors NF-κB, ELK1, AP-1 and activating transcription factor 4 (ATF4).
Materials and Methods
Preparation of rat liver regeneration modelsHealthy adult male Sprague-Dawley rats, weighing 230 ± 20 g, were taken from the Experimental Animal Center of Henan Normal University. The rats were kept in a rearing room at 21 ± 2 ºC with 60 ± 10% relative humidity and a 12 h light/dark cycle, and had free access to food and water. A total of 114 rats were randomly divided into 19 groups (n = 6 in each group). Among them, a group was set as normal group. Nine groups undergoing partial hepatectomy (PH), were taken as experimental groups (also called PH groups). Nine groups served as sham operated controls (also called SO groups). Partial hepatectomy was performed according to the method described previously [20]. The SO groups underwent the same operation as the PH groups, except for the hepatectomy. At 0, 2, 6, 12, 24, 30, 36, 72, 120 and 168 h after surgery, the right lobe of rat liver was collected and stored at -80 °C for further use. The experiment was conducted in strict accordance with the Animal Protection Law of China.
Analyzing growth index of rat regenerating livers
At the indicated time points, that is, at 0, 2, 6, 12, 24, 30, 36, 48, 72, 120 and 168 h after PH, the total body weight of the rats was measured, and the remnant and regenerated liver tissues were resected and weighed. These data were expressed as a percentage of the ratio of remnant liver weight (A) divided by the total body weight (B) and multiplied by 100% (liver-to-body weight ratio [LBWR] (%)=A/B×100%). LBWR was served as growth index of rat regenerating livers in this study. The results obtained were the mean of four to eight different animals per time point.
Protein extraction
Protein extraction was performed according to the following methods. Briefly, the liver tissues of 6 rats in a group were obtained, put together and grinded into powder in the mortar with liquid nitrogen. Then the powder was used to extract proteins. 0.5 g of the powder was lysed with 10 ml protein extraction solution I (1 M urea, pH 6.5) and then was homogenized at 4 °C for 1 h. The homogenate was centrifuged at 4 °C, 20,000 g for 1 h. Then, the supernatant was collected and marked as “supernatant I”. Subsequently, the sediment was lysed with 5 ml protein extraction solution II (3 M urea, pH 9), and then was treated according to the above-described method. The supernatant was collected and marked as “supernatant II”. Next, the sediment was again lysed with 2.5 ml protein extraction solution III (3 M urea, 2% CHAPS, pH 9), and then was treated according to the above-described method. The supernatant was collected and marked as “supernatant III”. Finally, 2.5 ml of lysis buffer (7 M urea, 2 M thiourea, 18 mM DTT and 4% CHAPS, pH 7) were added to the sediment, and then was treated according to the above-described method. The supernatant was collected and marked as “supernatant IV”. Then all supernatants were mixed together. Subsequently, the dialysis and freeze drying technology were utilized to desalt and concentrate the sample in this study. The samples were firstly desalted by dialysis using the dialysis membrane with molecular weight-cutoff (MWCO) of 1000 Da. Then desalted samples were frozen at a low temperature about -80 °C in a chamber. Next, the frozen samples underwent primary drying at -40 °C in a dryer, and underwent secondary drying at 20 °C by high vacuum. After a few hours, dry powder was obtained, and then dissolved in 6 mL lysis solution (7 M urea, 2 M thiourea, and 4% CHAPS, pH 7). Thus the samples were stored at -80 °C for further use. The protein concentration was measured using the 2D Quantification kit (GE Healthcare, USA).
Protein fluorescent labeling and 2D-DIGE
The fluorescent labeling of proteins was performed following the standard protocol for minimal labeling according to Ettan DIGE User Manual (GE Healthcare, USA). Briefly, 50 μg proteins from normal control group were labeled with Cy3. 50 μg proteins from each time point of PH groups, that is, at 2, 6, 12, 24, 30, 36, 72, 120 and 168 h after PH, were respectively labeled with Cy5. Meantime, 50 μg proteins from each time point time of SO groups, that is, at 2, 6, 12, 24, 30, 36, 72, 120 and 168 h after SO, were also respectively labeled with Cy5. On the other hand, 25 μg proteins from normal control group and 25 μg proteins from the above stated 9 time point of PH groups or SO groups were mixed together and used as internal reference, and then were labeled with Cy2. The Labeling reactions were performed on ice in the dark for 30 min, then quenched by addition of 1 μL of 10 mM lysine for 10 min and then stored at -80 °C for use [21].
The 2D-DIGE was performed according to operating manual (GE Healthcare, USA). In brief, 50 μg of Cy2-, Cy3-, Cy5-labeled samples were pooled together and then were dissolved in 450 μL rehydration buffer (7 M urea, 2 M thiourea, 2% CHAPS, 18 mM DTT, 2% IPG buffer 3-10). Then IPG gel strip (pH 3-11 NL, 24 cm) was rehydrated in the rehydration buffer for 12 h at 20 °C. The isoelectric focusing (IEF) was performed in Ettan IPGphor (GE Healthcare, USA) following the conditions: ramped to 250 V in 1 h, held at 1000 V for 3 h, ramped to 10,000 V in 3 h, and held at 10,000 V for 8h. After IEF, each gel strip was equilibrated for 15 min in 15 mL equilibration buffer (50 mM TrisHCl pH 8.8, 6 M urea, 30% glycerol, 2% SDS, 1% DTT) and subsequently alkylated for 15 min in alkylation equilibration buffer (50 mM TrisHCl pH 8.8, 6 M Urea, 30% v/v glycerol, 2% SDS, 2.5% iodoacetamide). Subsequently, the proteins in gel strip were separated by SDS-PAGE, which was performed in Ettan DALT Six electrophoresis device (GE Healthcare, USA) under the following conditions: held at 50 V for 2 h, then held at 120 V for 8 h.
Image analysis
After 2D-DIGE, all the gels were scanned at 100 μm resolution using a Typhoon FLA 9500 scanner (GE Healthcare, USA) according to the manufacturer’s protocol to obtain scanned images. Each protein spot in scanned images was quantitatively analyzed using DeCyder 7.0 Software (GE Healthcare, USA) to obtain their abundances. Then the gel images with Cy3-labeled proteins (normal control group) and the gel images with Cy5-labeled proteins (PH groups or SO groups) were respectively compared to the gel images with Cy2-labeled proteins (internal reference) gel image to get the normalized abundance values. After that, the ratio values of proteins in PH groups or SO groups were calculated through the normalized abundance values of the PH groups or SO groups divided by that of normal control group. Protein spots with ratio ≥ 2 or ratio ≤ 0.5 and P < 0.05 were regarded as significantly changed between PH groups and normal control group. Subsequently, the F-test was used to analyze the significance of protein expression difference between the PH and SO groups. The proteins found to be significantly changed with p < 0.05 at least at one time point during LR, were defined as proteins associated with LR.
Protein identification by mass spectrometry
2D was performed according to the method described in “Protein fluorescent labeling and 2D-DIGE”, except that 1,000 μg proteins were added to 450 μl rehydration buffer, and the gels were stained with Coomassie brilliant blue. Then, the spots of differentially expressed proteins identified by 2D-DIGE were matched to the Coomassie brilliant blue stained gels. The differential protein spots in the stained gels were manually excised, decolorized, dehydrated and whitened according to the instruction and operation manual (Bruker, Germany). The dried protein dot was immersed in 2-3 μL of 0.01 μg/μl trypsin at 4 °C for 30 min, and then was incubated in 10-15 μl of 25 mM NH4HCO3 at 37 °C overnight. 1 μL of digestion sample was placed on MTP AnchorChip™ 800/384 sample target, and then 1 μL 0.4 mg/ml HCCA solution was added. The protein was identified by Matrix assisted laser desorption ionization time-of-flight mass spectrometry (MALDI-TOF/MS) (Autoflex III Brucker Daltonik, Germany). The parameters of MALDI-TOF/MS were as follows: reflection mode, protein mass m/z 700-4200, trypsin as the digestion enzyme with one cleavage site, fixed modifications carbamidomethyl (C), variable modifications oxidation (M), peptide mass tolerance ± 100 ppm, fragment mass tolerance ± 0.5 Da, signal-noise ratio (SNR) of MS and MS/MS with 30 and 20 respectively, number of matched peptide fragments at least 3 pieces. The retrieval of peptide fragment was preformed if mass spectral peaks m/z ≥600. The selected peptides were analyzed using BioTools Version 3.0 (Brucker Daltonik, Germany) software, and then orderly were searched against Swiss-Prot database with taxonomy Rattus, Mus musculus and Homo sapiens using MASCOT search engine, if not found, IPI rat database and NCBI database with taxonomy Rattus was orderly searched [7]. Only those proteins identified by MASCOT search criteria with the top significant scores were considered as acceptable.
Western blot analysis
Western blot analysis was performed according to Towbin’s method [22]. Briefly, 100 μg proteins were separated by SDS-PAGE and then transferred to a PVDF membrane (GE Healthcare). After transfer, the membranes were blocked with 5% skimmed milk in Tris-buffered saline (TBS) containing 0.1% Tween-20 (TBS-T) and subsequently incubated overnight at 4 °C with primary antibodies (Bioss, 1: 1,000), including rabbit anti-PCNA, -PLCG2, -PIK3R1, -NFκB1, -TGFβ2, -AKT1, -CD47. Then the membrane was further incubated with horseradish peroxidase-conjugated secondary antibodies goat anti-rabbit IgG (Sigma, 1:5,000) for 1.5 h. Finally, protein bands were visualized with Amersham ECL substrates. The relative abundance of target proteins was measured by image analysis using ImageQuant TL software. β-actin (sigma, 1:1,000) was served as an internal reference in this study.
Exploration of key proteins in rat liver regeneration
The key proteins of rat LR were explored in accordance with the relative extraction method [23,24]. Briefly, the ratio values of liver regeneration-related proteins at each time point after PH were used to calculate protein expression differences by signal-to-noise (SNR), revised feature score criterion (RFSC), Bhattacharyya distance (BD), Euclidean distance (ED) and Pearson correlation coefficient (PCI). The differences were ordered by SNR in ascending order, and by RFSC, BD, ED and PCI in descending order. The first 10 proteins at each time point and in each algorithm were selected out. Each protein was evaluated by the decision tree algorithm, and displayed in descending order of protein differences. The selected proteins, which participated in cell proliferation signaling pathways, were regarded as key proteins.
Identification of cell proliferation-associated proteins
In this study, the cell proliferation-associated proteins were identified by three approaches [25]. One is that the keyword “cell proliferation” was searched in Gene Ontology (www.geneontology.org), NCBI (www.ncbi.nlm.nih.gov) and RGD (http://rgd.mcw.edu/) to obtain the corresponding protein types of rat, mouse and human. The second is that the proteins were collated and collected according to physiological pathway maps embodied by Ingenuity Pathway Analysis (IPA) 9.0 software, KEGG (www.genome.jp/kegg/pathway.html) and QIAGEN (www.qiagen.com/geneglobe/pathways.aspx). The third is that the cell proliferation-associated proteins were further extended and supplemented by consulting the relevant literature. Finally, the above-described repetition proteins were integrated to obtain the cell proliferation-associated proteins.
Confirmation of cell proliferation-associated signaling pathways
In this study, cell proliferation-associated signaling pathways were confirmed by two approaches [25]. Firstly, the key word “cell proliferation” was input in the websites of QIAGEN and KEGG, to obtain cell proliferation-associated signaling pathways. Secondly, the proteins associated with cell proliferation were uploaded to the “Canonical Pathway” frame of the IPA software to obtain cell proliferation-associated signaling pathways. Finally, these signaling pathways, appearing in both methods mentioned above were selected as cell proliferation-associated signaling pathways for subsequent analysis.
Correlation analysis of signal transduction activity and cell proliferation activity
In this study, the spectral function Ep(t) [26] was used to calculate the activities of signal transduction and cell proliferation. Briefly, the ratio values of the proteins associated with cell proliferation and cell proliferation signaling pathways were input into Ep(t) formula. When Ep(t) ≥ 2E(0), the signal transduction activity and cell proliferation activity of PH groups are stronger than the control. When Ep(t) ≤ 0.5E(0), the both are lower than the control. When 0.5E(0) < Ep(t) < 2E(0), the both in PH groups and control group are similar. 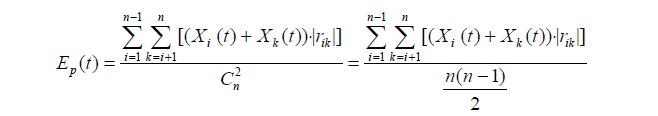
Where, n represents the number of proteins participating in a physiological activity at t time point.
Then, the Ep(t) values of signal transduction activity were compared with that of cell proliferation activity during rat LR. When the both had the same trend, signaling pathways were considered to regulate cell proliferation. When the both had inconsistent or contrary trends, the signaling pathways were not considered to regulate cell proliferation.
Statistic analysis
All data are expressed as means ± SD. Two-tailed Student’s t test was used to determine significant differences between data groups. The statistical analysis was performed using one-way analysis of variance (ANOVA). P < 0.05 was considered statistically significant. The different degrees of significance were indicated as follows: *P<0.05; **P<0.01.
Results
The growth of the rat regenerating livers after partial hepatectomy and their protein expression changesTo understand the growth of the rat regenerating livers after PH, the growth index of rat regenerating livers was analyzed by liver-tobody weight ratio (LBWR). The results showed that a higher LBWR at 48 h, 72 h, 120 h and 168 h after PH. The LBWR were 3.16±0.41%, 3.83±0.48%, 4.36±0.41% and 4.68±0.51%, respectively, at 72 h, 120 h and 168 h after PH (Figure 1A). To highlight the protein expression changes during rat LR, PCNA was detected by Western blot. The results showed that PCNA expression increased at 24 h, 30 h and 36 h after PH, suggesting that the increase of liver mass and expression changes of PCNA (Figure 1Ba) were positive correlation.
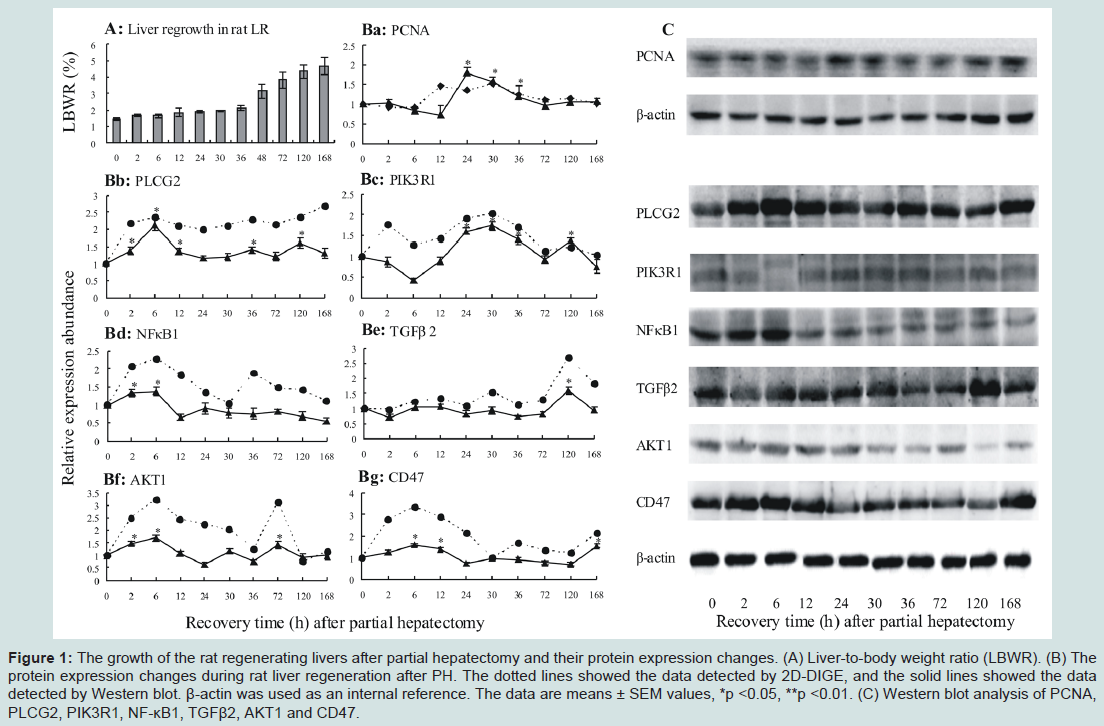
Figure 1: The growth of the rat regenerating livers after partial hepatectomy and their protein expression changes. (A) Liver-to-body weight ratio (LBWR). (B) The protein expression changes during rat liver regeneration after PH. The dotted lines showed the data detected by 2D-DIGE, and the solid lines showed the data detected by Western blot. β-actin was used as an internal reference. The data are means ± SEM values, *p <0.05, **p <0.01. (C) Western blot analysis of PCNA, PLCG2, PIK3R1, NF-κB1, TGFβ2, AKT1 and CD47.
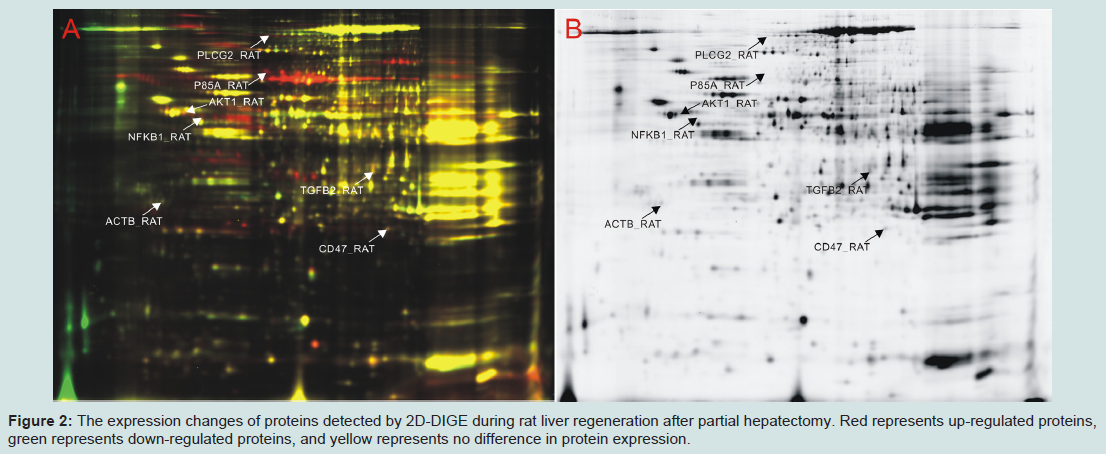
Figure 2: The expression changes of proteins detected by 2D-DIGE during rat liver regeneration after partial hepatectomy. Red represents up-regulated proteins, green represents down-regulated proteins, and yellow represents no difference in protein expression.
In the above-mentioned 1,659 kinds of liver regenerationrelated proteins, 279 proteins participated in signaling pathways that regulate cell proliferation. Among them, the expression changes of the proteins associated with FGF, PDGF, insulin, oncostatin M and IL2 signaling pathways were provided in Table 1. IPA analysis showed that protein PLC was located in the center of FGF, PDGF, insulin, oncostatin M and IL2 signaling pathways. Further analysis by the relative extraction method showed that PLC protein family member PLCG2 was a key protein and played a key role in rat LR. Of them, the signaling molecule FGF1 of FGF signaling pathway was up-regulated at 2 h during rat LR, the same as FGF7 at 2-12 h, FGF9 at 36 h and 120 h, and their receptor FGFR at 24 h. In PDGF signaling pathway, PDGFB was up-regulated at 120 h, and its receptor PDGFRA at 12 h during rat LR. In insulin signaling pathway, insulin receptor INSR was up-regulated at 2 h and 12-36 h during rat LR. In oncostatin M signaling pathway, oncostatin M receptor OSMR was up-regulated at 6 h and 120 h during rat LR. In IL2 signaling pathway, IL2 was up-regulated at 168 h, and its receptor IL2RG at 2-36 h during rat LR (Table 1).
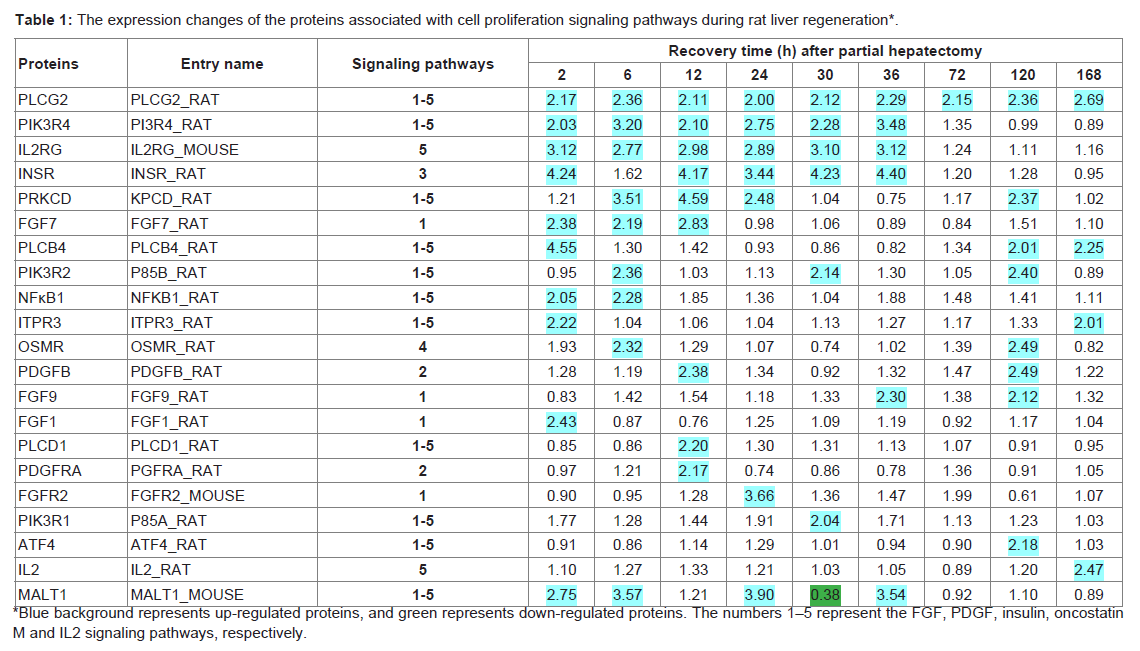
Table 1: The expression changes of the proteins associated with cell proliferation signaling pathways during rat liver regeneration*.
The expression changes of the proteins associated with cell proliferation during rat liver regeneration
In the above-mentioned 1,659 kinds of liver regenerationrelated proteins, 506 proteins participated in cell proliferation (Supplementary Tabale 2). Among the 506 proteins, 179 proteins such as IL2RG were up-regulated at 2 and 6 h during rat LR, and the same as 249 proteins such as NDUFAF2 at 12-72 h, and 149 proteins such as SMOX at 120 and 168 h. On the other hand, 42 proteins such as NUMB were down-regulated at 2 and 6 h during rat LR, and the same as 62 proteins such as DAP3 at 12-72 h, and 3 proteins such as GAK at 120 and 168 h. Meantime, 7 proteins such as SIRPA were up-/down-regulated at 2 and 6 h during rat LR, and the same as 39 proteins such as SUMO3 at 12-72 h.
Correlation of signal transduction activity and cell proliferation activity during rat liver regeneration
The correlation of signal transduction activity and cell proliferation activity during rat LR was analyzed by spectral function Ep(t). The results showed that the signal transduction activity of the FGF pathway at 2 h, the PDGF, insulin and oncostatin M pathways at 12 h, the IL2 pathway at 2-36 h during rat LR, were significantly stronger than SO control groups (Table 2). Meanwhile, the cell proliferation activity at 2-36 h during rat LR was also significantly enhanced (Table 2), suggesting that a positive correlation existed in the signal transduction activity of the above-mentioned signaling pathways and cell proliferation activity in rat LR.
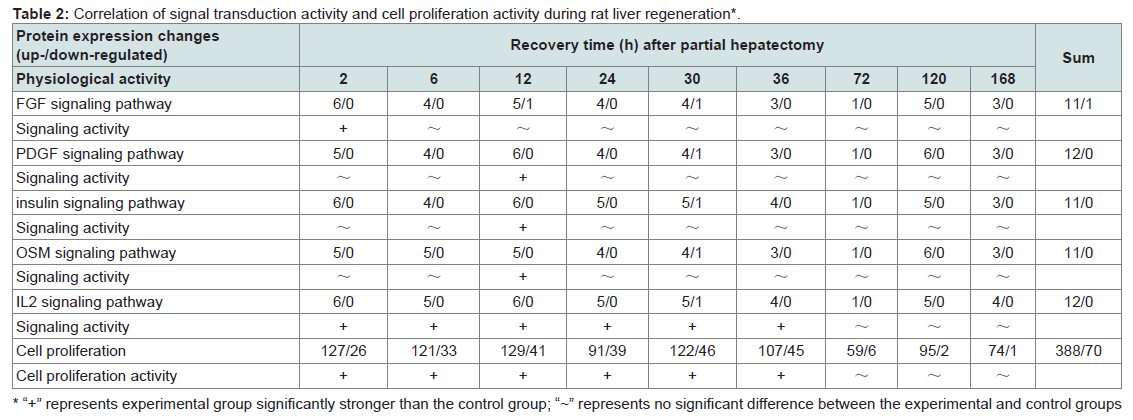
Table 2: Correlation of signal transduction activity and cell proliferation activity during rat liver regeneration*.
Discussion
The liver is one of the organs with intensive regenerating ability, and partial hepatectomy (PH) model is a common model to study the mechanism of liver regeneration (LR) [2]. Generally, the number of hepatocytes account for 70-80% of the liver, so hepatocyte function could represent the function of liver and the regenerating liver, and hepatocyte proliferation could reflect the growth of liver and the regenerating liver, which have been also confirmed by LBWR analysis and western blot analysis of PCNA expression. In order to elucidate the mechanisms of hepatocyte proliferation in rat LR, this study qualitatively and quantitatively detected the protein expression changes by 2D-DIGE, mass spectrometry and Western blot, and analyzed cell proliferation mechanism in rat LR at the proteome level.Generally, hepatocyte proliferation is regulated by several signaling pathways. In PDGF, FGF, insulin, oncostatin M and IL2 signaling pathways, the binding of signaling molecules to their receptors activates PI3K and PLC by cascade reaction [8-10,27,28]. It was reported that FGF7, PDGF, IL2, INSR and OSMR regulated cell proliferation by activating PI3K/AKT and ERK1/2 [7,29-33]. Studies have proved that the activation of PI3K/AKT and ERK1/2 was critical for hepatocyte proliferation and liver regeneration after PH [12,34,35]. This study found that signaling molecules FGF7 and IL2 were up-regulated during rat LR, the level of their receptors PDGFR, INSR, OSMR and IL2RG were enhanced, the expression of the PI3K family members PIK3R1, PIK3R2 and PIK3R4 were also significantly increased. Meanwhile, the protein level of PIK3R1 was confirmed by our Western blot analysis. These results suggested that growth factors, oncostatin M and IL2 played important roles in promoting hepatocyte proliferation during rat LR by activating PI3K/AKT and ERK1/2.
Meanwhile, the activated PLC mentioned above hydrolyzes PIP2 into IP3 and DAG, thus leading to the activation of PKC and calmodulin (CALM). Then PKC and CALM activate transcription factors such as NF-κB, ELK1, ATF4 and AP-1 by cascade reaction [13,14]. Albi et al. reported that the activity and expression of PLC was enhanced in LR, and PLC was involved in the cell cycle progression during LR [36]. In this study, PRKCD of the PKC family, and PLCB4, PLCD1 and PLCG2 of the PLC family were up-regulated during rat LR. More important, PLCG2 was located in the central node of these signaling pathways, and was up-regulated at 2-168 h in rat LR, which was also confirmed by our Western blot analysis, suggesting that PLCG2 plays a key role in rat LR.
It was reported that the transcription factors NF-κB, ELK1, CREB and AP-1 promoted cell proliferation by regulating the expression of cell proliferation-related genes such as cyclins and CDKs [15-19,37,38]. Our current research found that transcription factors NF-κB1, ATF4 and c-FOS were up-regulated in rat LR, and cell proliferation-related proteins CCNB1, CCNC, CCND1, CCNE1, CDK1, CDK2 and CDK4 were also up-regulated. Meantime, the protein level of NF-κB1 was verified by our Western blot analysis. Furthermore, spectral function Ep(t) analysis demonstrated that the signal transduction activity of the FGF pathway at 2 h, PDGF, insulin and oncostatin M pathways at 12 h, IL2 pathway at 2-36 h, were significantly enhanced in rat LR after PH, and the same as cell proliferation activity at 2-36 h, suggesting that a positive correlation existed in the signal transduction activity and cell proliferation activity in rat LR.
In summary, this study showed that FGF, PDGF, insulin, oncostatin M and IL2 signaling pathways might promote hepatocyte proliferation in the initial stage (2-6 h after PH) and progressive stage (6-72 h after PH) of rat LR through PLC/NF-κB and PLC/ERK. Meanwhile, PLCG2 was up-regulated in LR and was located in the central node of the six signaling pathways, suggesting that PLCG2 maybe play a key role in rat LR (Figure 3). In future, we will further validate the regulation mechanisms of cell proliferation in rat LR by several molecular biological techniques, such as gene over-expression, gene knockout, RNA interference, inhibitors of signaling pathways, and so on.
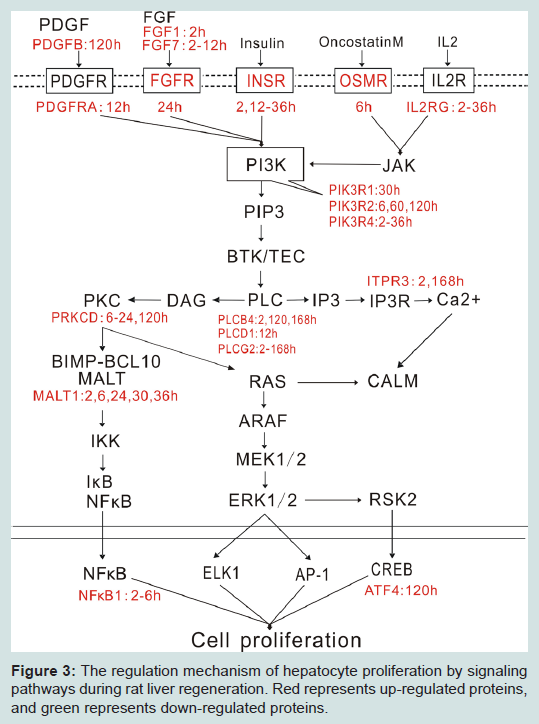
Figure 3: The regulation mechanism of hepatocyte proliferation by signaling pathways during rat liver regeneration. Red represents up-regulated proteins, and green represents down-regulated proteins.
Acknowledgements
This work was supported by the National Basic Research 973 Preresearch Program of China (No. 2012CB722304), the Major Scientific and Technological Projects of Henan (No. 111100910600), and the Henan Scientific and Technological Research Project (No. 122300410339).References
- Yokoyama Y, Nagino M, Nimura Y (2007) Mechanisms of hepatic regeneration following portal vein embolization and partial hepatectomy: a review. World J Surg 31: 367-374.
- Fausto N, Campbell JS, Riehle KJ (2006) Liver regeneration. Hepatology 43: S45-S53.
- Riehle KJ, Dan YY, Campbell JS, Fausto N (2011) New concepts in liver regeneration. J Gastroenterol Hepatol 26: 203-212.
- Ning QJ, Qin SW, Xu CS (2006) Expression patterns and action analysis of genes associated with drug-induced liver diseases during rat liver regeneration. World J Gastroenterol 21: 6966-6972.
- Guo F, Nian H, Zhang H, Huang L, Tang Y, et al. (2006) Proteomic analysis of the transition from quiescent to proliferating stages in rat liver hepatectomy model. Proteomics 6: 3075-3086.
- Strey CW, Winters MS, Markiewski MM, Lambris JD (2005) Partial hepatectomy induced liver proteome changes in mice. Proteomics 5: 318-325.
- Sun Y, Deng X, Li W, Yan Y, Wei H, et al. (2007) Liver proteome analysis of adaptive response in rat immediately after partial hepatectomy. Proteomics 7: 4398-4407.
- Utley S, James D, Mavila N, Nguyen MV, Vendryes C, et al. (2014) Fibroblast growth factor signaling regulates the expansion of A6-expressing hepatocytes in association with AKT-dependent β-catenin activation. J Hepatol 60: 1002-1009.
- Bowen WC, Michalopoulos AW, Orr A, Ding MQ, Stolz DB, et al. (2014) Development of a chemically defined medium and discovery of new mitogenic growth factors for mouse hepatocytes: mitogenic effects of FGF1/2 and PDGF. PLoS One 9: e95487.
- Celton-Morizur S, Merlen G, Couton D, Desdouets C (2010) Polyploidy and liver proliferation: central role of insulin signaling. Cell Cycle 9: 460-466.
- Dey G, Radhakrishnan A, Syed N, Thomas JK, Nadig A, et al. (2013) Signaling network of Oncostatin M pathway. J Cell Commun Signal 7: 103-108.
- Benczik M, Gaffen SL (2004) The interleukin (IL)-2 family cytokines: survival and proliferation signaling pathways in T lymphocytes. Immunol Invest 33: 109-142.
- Francis HL, Demorrow S, Franchitto A, Venter JK, Mancinelli RA, et al. (2012) Histamine stimulates the proliferation of small and large cholangiocytes by activation of both IP3/Ca2+ and cAMP-dependent signaling mechanisms. Lab Invest 92: 282-294.
- Li JW, Wang GP, Fan JY, Chang CF, Xu CS (2011) Eight paths of ERK1/2 signalling pathway regulating hepatocyte proliferation in rat liver regeneration. J Genet 90: 435-442.
- Gieling RG, Elsharkawy AM, Caamaño JH, Cowie DE, Wright MC,et al. (2010) The c-Rel subunit of nuclear factor-kappaB regulates murine liver inflammation, wound-healing, and hepatocyte proliferation. Hepatology 51: 922-931.
- Malato Y, Ehedego H, Al-Masaoudi M, Cubero FJ, Bornemann J, et al. (2012) NF-κB essential modifier is required for hepatocyte proliferation and the oval cell reaction after partial hepatectomy in mice. Gastroenterology 143: 1597-1608.
- Stepniak E, Ricci R, Eferl R, Sumara G, Sumara I, et al. (2006) c-Jun/AP-1 controls liver regeneration by repressing p53/p21 and p38 MAPK activity. Genes Dev 20: 2306-2314.
- Mancinelli R, Onori P, Gaudio E, DeMorrow S, Franchitto A, et al. Follicle-stimulating hormone increases cholangiocyte proliferation by an autocrine mechanism via cAMP-dependent phosphorylation of ERK1/2 and Elk-1. Am J Physiol Gastrointest Liver Physiol 297: G11-G26.
- Della Fazia MA, Servillo G, Sassone-Corsi P (1997) Cyclic AMP signalling and cellular proliferation: regulation of CREB and CREM. FEBS Lett 410: 22-24.
- Jiang Y, Zhang LX, Chang CF, Wang GP, Shi RJ, et al. (2011) The number of the genes in a functional category matters during rat liver regeneration after partial hepatectomy. J Cell Biochem 112: 3194-3205.
- Di Luca A, Elia G, Hamill R, Mullen AM (2013) 2D DIGE proteomic analysis of early post mortem muscle exudate highlights the importance of the stress response for improved water-holding capacity of fresh pork meat. Proteomics 13: 1528-1544.
- Towbin H, Staehelin T, Gordon J (1979) Electrophoretic transfer of proteins from polyacrylamide gels to nitrocellulose sheets: procedure and some applications. Proc Natl Acad Sci U S A 76: 4350-4354.
- Cunshuan X, Chunling Y, Yun J, Yun Z, Ying H, et al. (2013) Establishing same kind extraction method to find the hepatocyte key genes in rat liver regeneration from the data of gene microarray. Henan Science 31: 762-767.
- Yunqing L, Ying H, Yun Z, Juntao L, Cunshuan X (2013) Predicting rat hepatocyte key genes in liver regeneration by same kind extraction method coupled with sequential-forward-selection method. Henan Science 31: 964-967.
- Li M, Zhou X, Mei J, Geng X, Zhou Y, et al. (2014) Study on the activity of the signaling pathways regulating hepatocytes from G0 phase into G1 phase during rat liver regeneration. Cell Mol Biol Lett 19: 181-200.
- Wang WB, Fan JM, Zhang XL, Xu J, Yao W (2009) Serial expression analysis of liver regeneration-related genes in rat regenerating liver. Mol Biotechnol 43: 221-231.
- Pratsinis H, Constantinou V, Pavlakis K, Sapkas G, Kletsas D (2012) Exogenous and autocrine growth factors stimulate human intervertebral disc cell proliferation via the ERK and Akt pathways. J Orthop Res 30: 958-964.
- Poli A, Faenza I, Chiarini F, Matteucci A, McCubrey JA, et al. (2013) K562 cell proliferation is modulated by PLCβ1 through a PKCα-mediated pathway. Cell Cycle 12: 1713-1721.
- Tsai SM, Wang WP (2011) Expression and function of fibroblast growth factor (FGF) 7 during liver regeneration. Cell Physiol Biochem 27: 641-652.
- Jia C (2011) Advances in the regulation of liver regeneration. Expert Rev Gastroenterol Hepatol 5: 105-121.
- Amaya MJ, Oliveira AG, Guimarães ES, Casteluber MC, Carvalho SM, et al. (2014) The insulin receptor translocates to the nucleus to regulate cell proliferation in liver. Hepatology 59: 274-283.
- Nakamura K, Nonaka H, Saito H, Tanaka M, Miyajima A (2004) Hepatocyte proliferation and tissue remodeling is impaired after liver injury in oncostatin M receptor knockout mice. Hepatology 39: 635-644.
- Vollmer S, Kappler V, Kaczor J, Flügel D, Rolvering C, et al. (2009) Hypoxia-inducible factor 1α is up-regulated by oncostatin M and participates in oncostatin M signaling. Hepatology 50: 253-260.
- Jackson LN, Larson SD, Silva SR, Rychahou PG, Chen LA, et al. (2008) PI3K/AKT activation is critical for early hepatic regeneration after partial hepatectomy. Am J Physiol Gastrointest Liver Physiol 294: G1401-G1410.
- Nechemia-Arbely Y, Shriki A, Denz U, Drucker C, Scheller J, et al. (2011) Early hepatocyte DNA synthetic response posthepatectomy is modulated by IL-6 trans-signaling and PI3K/AKT activation. J Hepatol 54: 922-929.
- Albi E, Rossi G, Maraldi NM, Magni MV, Cataldi S, et al. (2003) Involvement of nuclear phosphatidylinositol-dependent phospholipases c in cell cycle progression during rat liver regeneration. J Cell Physiol 197: 181-188.
- Daniel P, Filiz G, Brown DV, Hollande F, Gonzales M, et al. (2014) Selective CREB-dependent cyclin expression mediated by the PI3K and MAPK pathways supports glioma cell proliferation. Oncogenesis 3: e108.
- Kurinna S, Barton MC (2011) Cascades of transcription regulation during liver regeneration. Int J Biochem Cell Biol 43: 189-197.