
Research Article
Effect of Phosphorus Rates in Blended Fertilizer (NPS) and Row Spacing on Production of Bushy Type Common Bean (Phaseolus Vulgaris L.) at Mid-land of Guji, Southern Ethiopia
Deresa Shumi1,2*, Demissie Alemayehu1, Tekalign Afeta1 and Belachew Debelo1
- 1Oromia Agricultural Research Institute (IQQO), Bore Agricultural Research Center (BOARC, Ethiopia, Africa
- 2Department of Plant Science (Agronomy), Madawalabu University, Bale Robe 247, Ethiopia, Africa
*Address for Correspondence: Deresa Shumi, Department of Plant Science (Agronomy), Madawalabu University, Bale Robe 247, Ethiopia, Africa, E-mail: deresashumi@gmail.com
Citation: Shumi D, Alemayehu D, Afeta T, Debelo B. Effect of Phosphorus Rates in Blended Fertilizer (NPS) and Row Spacing on Production of Bushy Type Common Bean (Phaseolus Vulgaris L.) at Mid-land of Guji, Southern Ethiopia. J Plant Biol Soil Health. 2018;5(1): 7.
Copyright: © 2018 Shumi D, et al. This is an open access article distributed under the Creative Commons Attribution License, which permits unrestricted use, distribution, and reproduction in any medium, provided the original work is properly cited.
Journal of Plant Biology & Soil Health | ISSN: 2331-8996 | Volume: 5, Issue: 1
Submission: 14 March, 2018 | Accepted: 24 April, 2018 | Published: 04 May, 2018
Keywords
Blended fertilizer, Ibado, Inter-row, Phosphorus
Abstract
In Ethiopia, common bean (Phaseolus Vulgaris L.) is usually grown by smallholder farmers and its average yield is low. The low yield of common bean in Ethiopia is attributed to several production constraints, which include poor agronomic practices such as low soil fertility management, untimely and inappropriate field operations, rainfall variability and diseases and insect pests. Hence, a field experiment was conducted in Adola sub-site of Bore Agricultural Research Center during the 2016-2017 main cropping seasons to determine optimum phosphorus rates in blended NPS and appropriate inter-row spacing for common bean production. The factors studied were four rates of phosphorus in blended in NPS (0, 50, 100 and 150 kg ha-1) that contain 19% N, 38% P2O5 and 7% S and four inter row spacing of common bean (30, 40, 50, 60 cm). These were laid out in a factorial arrangement in randomized complete block design with three replications. Significantly the highest number of plant height (51.84 cm), number of total pods per plant (8.64), days to maturity (93.92), hundred seed weight (60.62) and grain yield (2494 kg ha-1) were recorded at the highest rate of 150 kg P ha-1 whereas highest number of days (40.33 days) to reach flowering was recorded due to nil application.
Among the inter-row spacing, 60 cm gave significantly the highest number of total pods per plant (9.25) and number of seeds per plant (2.99). The interaction of inter-row spacing and phosphorus rates had non-significant effect on almost all parameters except on number of primary branches per plant. Significantly the highest number of primary branches per plant (4.7) was recorded with nil application of P under wider inter-row spacing of 60 cm and it was statistically at par with P rates of 150 kg ha-1 for inter-row spacing of 40 cm. However, the highest net benefit (34167.56 Birr ha-1) was obtained from combination of inter-row spacing of 50 cm with application of 150 kg ha-1 NPS. Thus, it can be concluded that combined application of 150 kg ha-1 of P in blended NPS with variety Ibado proved to be superior and recommended for study area.
Introduction
Common bean (Phaseolus vulgaris L.) is an annual herbaceous plant domesticated independently in ancient Mesoamerica and in the Andes, and now is grown worldwide for both dry seeds or as a green bean. Thousands of legume species exist but common bean in any forms is the most eaten by human beings compared to any other legumes [1]. When common bean is used for its unripe fruits, it is termed as green bean or snap bean. About 23.9 million tons of dry bean, 20.7 million tons of green bean, and 1.9 million tons of string or common bean were produced worldwide in 2012 [2]. It is estimated that the common bean meets more than 50% of dietary protein requirements of households in Sub-Saharan Africa. The annual per capita consumption of common bean is higher among low-income people who cannot afford to buy nutritious food stuff, such as meats and fish [1]..
Common bean is highly preferred by Ethiopian farmers because of its fast maturing characteristics that enable households to get cash income required to purchase other food and household needs when other crops have not yet matured. It is also an important food and cash crop in Guji zone with an area of 15,850 ha and average productivity of 1.52 tons per hectare. Similarly, it contributed 39.49% for household consumption, 13.33% for seeds, 44.1% for sale, 0.58% for animal feed and 2.05% for other uses in the study zone [3].
Improved common bean production encompasses a proper use of different agronomic practices which include improved variety, seed rate, spacing, fertilizer rate and pesticide application as per recommendation [4]. However, the current national average yield of common bean (1485 kg ha-1) is far less than the attainable yield (2500-3000 kg ha-1) under good management conditions for most improved varieties. This low yield of common bean in Ethiopia is attributed to several production constraints, which include lack of improved varieties for the different agro-ecological zones, poor agronomic practices such as low soil fertility management, untimely and inappropriate field operations, rain fall variability, diseases and insect pests’.
In Ethiopia, a standard spacing of 40 cm×10 cm has been adopted, irrespective of the growing conditions and locations. It was not clear that how this spacing was considered as the standard spacing without having planting density study. However, most farmers are not sure of the appropriate planting density to use. They use either very high or very low plant density which consequently results in poor grain yield in quality and quantity.
Adola midlands of Guji Zone of southern Ethiopia is also one of the midland parts of the country that grows common bean where it covered area of about 15,850 ha with average annual productivity of 1.52 t ha-1 [3]. But it shares the same production problem with other midland part of the country. To address these nutrient deficiencies, the farmers in the country have been using uniform blanket application of 100 kg ha-1 DAP (18 kg N and 46 kg ha-1 P2O5) fertilizer and spacing of 40 cm×10 cm for common bean to increase crop yield for about half century and this did not consider soil fertility status and crop requirement. Therefore, our study/experiment was carried out to determine optimum phosphorus rates in blended NPS and appropriate inter-row spacing for common bean production in Adola.
Materials and Methods
Description of the study area
The experiment was conducted at Adola sub-site of Bore Agricultural Research Center (BOARC), Guji Zone, Oromia Regional State in southern Ethiopia under rain-fed conditions during the 2016 cropping season (September-December). The site (55°36'31”N, 38°58'91”E, 1721 M) is located in Adola town in Dufa ‘Kebele’ just on the West side of the main road to Negelle town. It is located at about 463 km south from Addis Ababa, the capital city of the country.
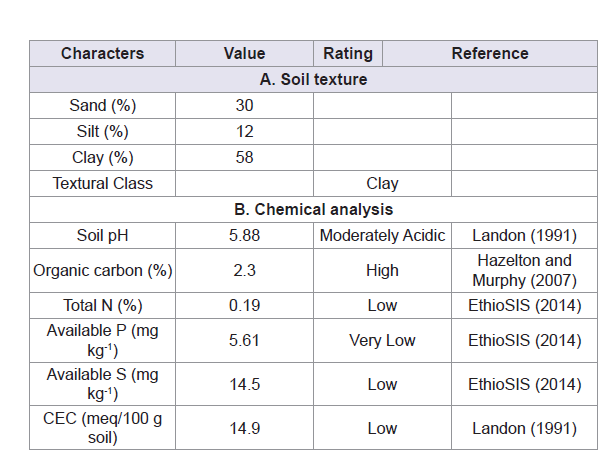
The climatic condition of the area is a humid moisture condition, with a relatively shorter growing season. The area receives annual rainfall of 1084 mm with a bimodal pattern extending from April to November. The mean annual minimum and maximum temperature is 15.9 °C and 9.9 °C, respectively. The type of the soil is red basaltic soil (Nitisols) and Orthic Aerosols [5]. The soil is clay in texture and moderately acidic with pH of around 5.9 (Table 1).
Experimental materials and design
The common bean variety Ibado was used for the study. The variety was released by Hawassa Research Centre of Southern Agricultural Research Institute in 2003. Ibado has large sized red food types and white flower colour with a maturity period of 90-120 days with a determinate growth habit. The variety is adapted to an altitude range of 1400-2250 meter above sea level with rainfall of more than 500 mm in growing season. Ibado variety was chosen for the study because it is high yielder, well adapted, preferred red seed colour and widely grown in the area by smallholder farmers in the study area.
Four inter row spacing (30, 40, 50 and 60 cm) and four phosphorus rates (0, 50, 100 and 150 kg ha-1 ) were used. Blended NPS (19% N, 38% P2O5 and 7% S) was used as source of phosphorus for the study.
The treatments were factorial combinations of four phosphorus fertilizer rates in blended NPS (0, 50, 100 and 150 kg ha-1) and four inter-row spacing (30, 40, 50 and 60 cm). The experiment was laid out as Randomized Complete Block Design (RCBD) and replicated three times per treatment in factorial combination. The gross plot size was 3.0 m×2.8 m=8.4 m2. The spacing between blocks and plots was 1.0 m and 0.6 m, respectively. Each plot had 6 rows spaced 40 cm apart.
Soil sampling and analysis
Pre-planting soil samples was taken randomly in a zigzag fashion from the experimental plots at the depth of 0-30 cm before planting. Twenty soil core samples were taken by an auger from the whole experimental field and combined to form a composited sample in a bucket. Then, the collected samples were air-dried at room temperature under shade and ground to pass through a 2 mm sieve for laboratory analysis of soil pH, and available phosphorus. Small quantity of this 2 mm sieved soil material allowed passing through 0.2 mm sieve for soil organic carbon (OC) and total nitrogen. The composite soil samples were analyzed for selected physicochemical properties mainly textural analysis (sand silt and clay), soil pH, total nitrogen (N), available sulphur (S), organic carbon (OC), available phosphorus (P), cation exchange capacity (CEC) (c mol kg-1), exchangeable potassium, magnesium and calcium using the appropriate laboratory procedures at Horticoop Ethiopia (Horticultural) PLC Soil and Water Analysis Laboratory.
Soil textural class was determined by Boycous Hydrometer Method [6]. Organic carbon (OC) was estimated by wet digestion method and organic matter was calculated by multiplying the OC% by a factor of 1.724 [7]. Total nitrogen was analyzed by Kjeldhal method. The soil pH was measured potentiometrically in 1:2.5 soil-water suspensions with standard glass electrode pH meter [8]. Cation Exchangeable Capacity (CEC) was determined by leaching the soil with neutral 1N ammonium acetate [2]. Available phosphorus was determined by the Olsen’s method using a spectrophotometer [9]. Available sulfur (S) was measured using turbidimetric method [10]. Exchangeable potassium, magnesium, and calcium were determined by Melich-3 methods [11].
Crop data collection and measurements
Phenological and growth parameters
Days to flowering: Were recorded as the number of days from sowing to when 50% of plants in a net plot produced flower through visual observation.
Days to physiological maturity: This was recorded as the number of days from sowing to the time when about 90% of the plants in a plot had mature pods in their upper parts with pods in the lower parts of the plants turning yellow. The yellowness and drying of leaves were used as indication of physiological maturity.
Plant height: It was measured as the height (cm) of ten randomly taken plants from the ground level to the apex of each plant at the time of physiological maturity from the net plot area and the means were recorded as plant height.
Number of primary branches per plant: The average number of primary branches emerged directly from the main shoot was counted from ten randomly taken plants at physiological maturity and the average number of primary branches was reported as number of primary branches per plant.
Yield and yield components
Number of pods per plant: Number of pods was counted from ten randomly taken plants from the net plot area at harvest and the means were recorded as number of total pods per plant.
Number of seeds per pod: It was recorded from ten randomly taken pods from each net plot at harvest.
Hundred seed weight (g): It was determined by taking weight of 100 randomly sampled seeds from the total harvest from each net plot area and the weight was adjusted to 10% moisture level.
Grain yield (kg ha-1): The four central rows were threshed to determine seed yield and the seed yield was adjusted to moisture level of 10%. Finally, yield per plot was converted to per hectare basis and the average yield was reported in kg ha-1.
Statistical data analysis
All the measured parameters were subjected to analysis of variance (ANOVA) appropriate to factorial experiment in RCBD according to the General Linear Model (GLM) of SAS software version 9.0 and the interpretations were made following the procedure described by Gomez KA et al. [12]. Least Significance Difference (LSD) test at 5% probability level was used for mean comparison when the ANOVA showed significant differences.
Results and Discussion
Physico-chemical properties of the experimental site soil
Soil texture is an important soil physical characteristic as it determines water intake rate (infiltration), water holding capacity of the soil, the ease of tilling, the amount of aeration, and also influences soil fertility [13]. It is one of the inherent soil properties less affected by management and determines nutrient status, organic matter content, air circulation and water holding capacity of a given soil. According to the soil textural class determination triangle, soil of the experimental site was found to be clay (Table 1). High clay content might indicate the better water and nutrient holding capacity of the soil of the experimental site.
According to the soil analysis test, the soil pH of the experimental site was 5.88 (Table 1). Thus, according to Landon’s rating, the chemical reaction of the experimental site is moderately acidic [14]. The available P level in the experimental site was which is 5.61 mg kg-1 is very low according to the rating of EthioSIS (Table 1) [10]. This low available phosphorus could be due to fixation in such acidic soils.
The result of laboratory analysis showed that the total nitrogen percentage (0.19%) was low as per the rating of EthioSIS [10]. Cation exchange capacity is the capacity of the soil to hold and exchange cations. It provides buffering effect to changes in pH, available nutrients, calcium levels and soil structural changes. The result showed that the CEC of the experimental soil to be 14.9 meq/100 g soils rated as moderate according to rating of Landon JR [14]. The total carbon content in the soil was 2.30% which was rated as high as per the classification of Hazelton PA et al. [15]. Thus, the OM content of the soil was optimum as rated by EthioSIS [10]. On the other hand, the available sulphur content in the soils has values of 14.50 mg kg-1 which was rated as low as per the classification of EthioSIS [10].
Phenological and growth parameters of common bean
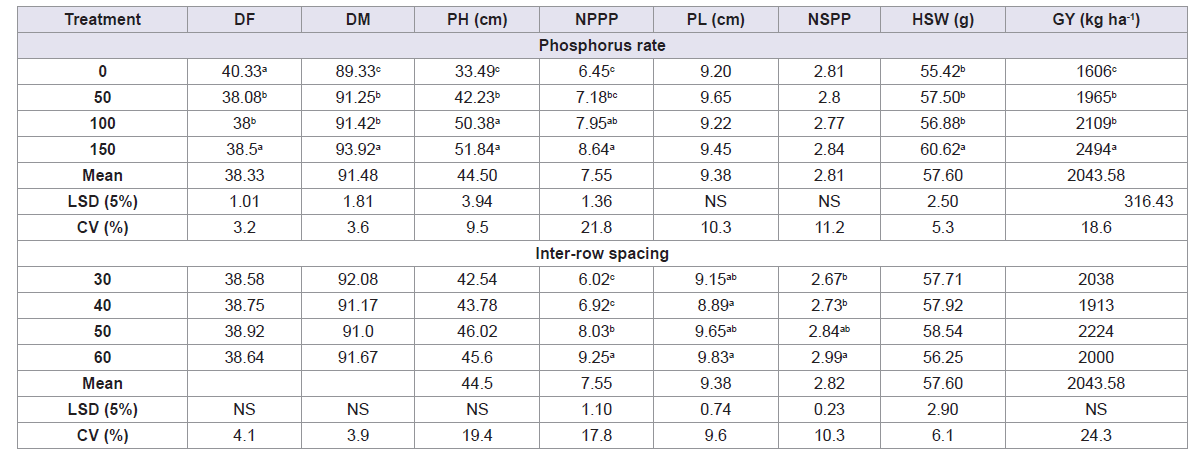
Days to 50% flowering: The interaction of P rate in blended NPS and inter row and main effect of inter-row spacing had non-significant effect on days to 50% flowering, but the main effect of P rate were found to be highly significant (P <0.01) on days to reach 50% flowering (Table 2). Significantly, highest number of days (40.33) to reach flowering was recorded due to nil application while the earliest days to flowering (38) was recorded due to application of 50, 100 and 150 kg ha-1 P.
The result obtained from the current study clearly revealed that the increasing P rates from 0 to 150 kg P ha-1 shortened the time required to attain days to 50% flowering which was two days earlier than control. This variation may be due to stimulatory effect of phosphorus on growth hormones, induce early flowering in common bean. This result was in line with the findings of Wondimu W et al. who reported that increasing the NP application rate from 0 kg N, 0 kg ha-1 P2O5 to 36 kg N, 92 kg ha-1 P2O5 significantly shortened the time required to attain 50% flowering [16]. However, Tewari JK et al. reported no significant effects of P application on number of days to reach 50% flowering on common bean [17]. Similarly, Tesfaye T et al. also reported that interaction of P with variety to be non-significant common bean [18].
Days to physiological maturity: The analysis of variance showed that the number of days required to reach physiological maturity of common bean was highly significantly (P<0.01) influenced by the main effect of P application rate. However, main effect of inter-row spacing and interaction effects of inter-row spacing with P application rates had no significantly influence physiological maturity. Increase in P application rate from 0 to 150 kg ha-1 led to a significant increase in the number of days required to reach physiological maturity. The highest number of days required to physiological maturity (93.92 days) was recorded for the highest rate of P application rate (150 kg ha-1) while the shortest days to physiological maturity (89.33 days) was recorded in the treatment without the P application. This finding was in contrary with that of Boutraa T who reported that number of days required to 90% physiological maturity of common bean was decreased significantly from 70, 68 to 67 days, due to increased phosphorus fertilization from 25, 50 to 75 kg ha-1 P2O5 [19].
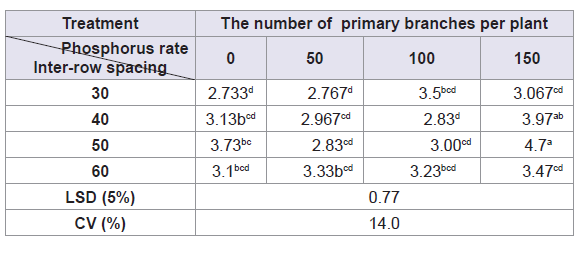
Number of primary branches: The interaction of P rate and inter-row spacing had significant (P<0.05) effect on number of primary branches. Significantly, highest number of number of primary branches (4.7) recorded with highest application of 150 kg ha-1 P for wider inter-row spacing of 60 cm and it was statistically at par with P rates of 150 kg ha-1 for inter-row spacing of 40 cm while the lowest number of primary branches (2.73) was recorded with nil application of P for inter-row spacing of 40 cm. This might be due to the fact that, as plant density decreased the available growth resources and more interception of sunlight for photosynthesis as well as optimal supply of P in the early stage of plant growth enhanced the crop lateral growth. This result was in line with the findings of Mehmet OZ who obtained increased number of branches at the wider plant spacing for soybean and which may have resulted in production of more assimilate for partitioning towards the development of more branches [20].
Plant height: The analysis of variance showed highly significant (P<0.01) main effect of P levels in blended NPS fertilizer, while interaction of P levels and inter-row spacing did not significantly influence plant height in common bean.
Increasing rates of P levels in blended NPS fertilizer from 0 to 150 kg ha-1 showed progressive increase in plant height (Table 3). However, no significant variation was observed for these parameters due to the main effect of inter-row spacing. Thus, the highest plant height (56.79) was recorded at the highest rate of application of (150 kg ha-1 P) and it was statistically at par with P rates of 100 kg ha-1 P, while the lowest plant height (38.01 cm) was recorded for the control. The increase in plant height in response to the increased P application rate in blended NPS might be due to the maximum vegetative growth of the plants under higher P availability. In agreement with this result, Dejene T et al. reported that phosphorus have significantly increased plant height at application of 30 kg ha-1 P on common bean [21].
Yield and yield components
Number of total pods per plant: Significant (P<0.05) effects of P application rate in blended NPS fertilizer and inter-row spacing were observed on the number of total pods per plant while the interaction effect did not significantly influence the number of total pods. The highest number of total pods per plant (8.64) was recorded at application rate of 150 kg ha-1 P whereas the lowest number of total pods (6.45) was obtained from the control.
The increase in number of total pods with the increased P rates might be possibly due to adequate availability of P which might have facilitated the production of primary branches and plant height which might in turn have contributed for the production of higher number of total pods. In conformity with this result, Tesfaye T et al. reported that number of pods per plant increased from 2.31 to 10.62 with the increase in P rate from 0 to 39.6 kg ha-1 [26]. Thus, the increment of number of pods per plant due to application of P fertilizer confirms the fact that P fertilizer promotes the formation of nodes and pods in legumes. In agreement with this result, Shanka D et al. also found that the number of pods per plant of common bean significantly increased in response to increasing rate of phosphorus up-to the highest rate (92 kg ha-1 P2O5) [22].
The main effects of inter- row spacing had a highly significant (P<0.01) effect on the number of pods per plant. The highest number of pods per plant (9.25) was obtained with wider inter-row spacing (60 cm) while the lowest number of pods per plant (6.02) was recorded for narrow inter-row spacing (30 cm). The variation in the number of pods per plant among the inter-row spacing might be related as the plant population increased there was high competition for the growth factors as compared to wider spacing which had impact on the number of pods per plant. The reduced competition for light and reduced overlapping from adjacent common bean plants could have enabled the plants grown at wider spacing to utilize its energy for more branching and subsequently, the greater number of pods per plant. In agreement to the present result, Khan EA et al. reported higher number of pods plant-1 (41.47) in the wider inter-row spacing (45 cm) of chickpea [23].
Number of seed per pod: The analysis of variance showed that the interaction effect of P application rates and inter-row spacing were not significant, but the main effects of inter-row spacing had significantly (P<0.05) effect on the number of seeds per pod. The highest number of seeds per pod (2.99) was recorded for wider inter row spacing (60 cm) whereas the least number of seeds per pod (2.67) was recorded for inter-row spacing of 40 cm which statistically at par with that of 30 cm and 50 cm. In agreement with the present result, Idris AL et al. reported that number of seeds per pod increased with decreased plant density of faba bean [24]. Khan EA et al. also reported decreased number of seeds per pod from 1.87 to 1.81 as seed rate increased from 60 kg ha-1 to 75 kg ha-1 on chickpea [23].
Pod length: Analysis of means indicated significant variations in pod length due to the main effects of inter-row spacing. However, applied P fertilizer and it’s interaction with inter-row spacing did not show significant variations in pod length (Table 3). On average, the longest pod was recorded under wider inter-row spacing of 60 cm. This might be under wider row spacing, there is better photo-assimilate translocation to other plant parts that would contribute to increments in yield attributing traits such as pod length.
Grain yield: Grain yield was highly significantly (P<0.01) affected by the main effect of P rates, and was not affected due to main effects of inter-row spacing and the interaction of inter row spacing with P fertilizer rates combination. The highest grain yield (2494) was recorded highest rate of P application at 150 kg ha-1 P which was followed by 2109 and 1965 kg ha-1 application of 100 and 50 kg ha-1 P) respectively while the lowest yield (1606) was observed for nil application of P fertilizer.
The result might be attributed to the fact that applying P fertilizer increases crop growth and yield on soils which are naturally low in P and in soils that have been depleted. Similar results were reported by Murat G et al. that P application at the rate of 46 kg ha-1 P2O5 gave higher number of pods per plant and yield as compared to unfertilized plots in common bean [25]. This result is also in agreement with that of Negash F et al. who reported that the application of 27 kg N and 69 kg ha-1 P2O5 had significantly improved grain yield of common bean [26].
Hundred seed weight: The analysis of variance revealed that P application rates and inter-row interactions had no significant effect on hundred seed weight. But main effect of P application rates had significant (P<0.05) effect on hundred seed weight. The highest hundred seed weight (60.62 g) was recorded due to the application of highest rate of P fertilizer (150 kg ha-1 P), whereas the lowest hundred seed weight (55.42 g) was obtained under the control which was statistical in parity with 50 and 100 kg ha-1 P. This might be because nutrient use efficiency by crop was enhanced at optimum level of P since grain weight indicates the amount of resource utilized during critical growth periods.
The increase in hundred seed weight as a result of increased P application might be attributed to important roles the nutrient plays in regenerative growth of the crop, leading to increased seed size, which in turn may improve hundred seed weight [27]. Similarly, Girma A et al. observed significant increase in thousand seed weights of common bean as a result of phosphorus application up to 40 kg ha-1 [28]. In conformity with this result, Loha G et al. found that varieties and their interactions with P fertilizer had significant effect on bean thousand seed weight [29].
Economic analysis: The agronomic data upon which the recommendations are based must be relevant to the farmers' own agro-ecological conditions, and the evaluation of those data must be consistent with the farmers' goals and socio-economic circumstances [30].
The net benefit was computed due to common bean varieties, application of blended NPS fertilizer and interaction of varieties with application of blended NPS fertilizer. The economic analysis revealed that highest net benefit (34167.56 Birr ha-1) was obtained from combination of inter row spacing of 50 cm with application of 150 kg ha-1 NPS while the lowest net benefit (19228.69 Birr ha-1) was obtained from wider inter row spacing of 60 cm with no application fertilizer (Table 4).
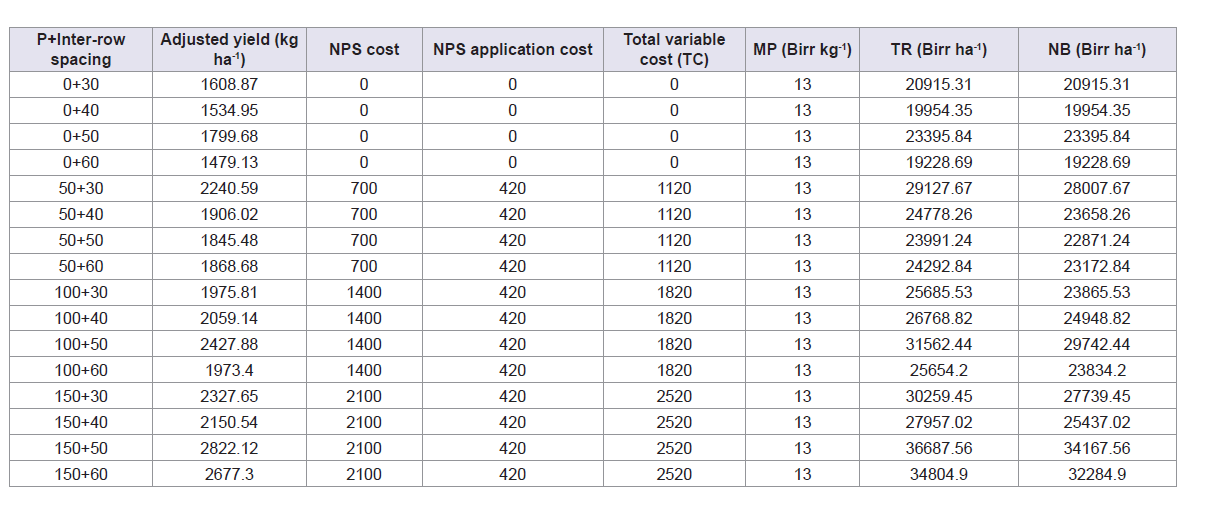
Therefore, production of Ibado variety with inter row spacing of 50 cm and 150 kg ha-1 NPS was most productive for economical production and can be recommended for the study area. Shanka D et al. reported that planting of the cultivar Nasir produced the highest net benefit (15903.1 Birr ha-1) with acceptable marginal rate of return (30-40%) compared to other cultivars at Areka [22]. Negash F et al. also reported net benefit of 21, 070 ETB ha-1 with marginal rate of return of 80% by the application of 69 kg ha-1 P2O5 at Areka [26].
Summary, Conclusion and Recommendation
In Ethiopia, common bean is usually grown by smallholder farmers and the average yield of the crop is low. This low yield of common bean in Ethiopia is attributed to several production constraints, which include poor agronomic practices such as low soil fertility management, untimely and inappropriate field operations, rainfall variability and diseases and insect pests. Hence, a field experiment was conducted in Adola sub-site of Bore Agricultural Research Centre during the 2016-2017 main cropping seasons to determine optimum phosphorus rates in blended NPS and appropriate inter-row spacing for common bean production in the study area. The factors studied were four rates of phosphorus in blended in NPS (0, 50, 100 and 150 kg ha-1 ) that contain 19% N, 38% P2O5 and 7% S and four inter-row spacing of common bean (30, 40, 50, 60 cm). These were laid out in a factorial arrangement in randomized complete block design with three replications.
The main effect of P rate in blended NPS was significant on plant height, number of total pods per plant, days to flowering, days to maturity, hundred seed weight, number of primary branches per plant and grain yield. Significantly the highest number of plant height (51.84 cm), number of total pods per plant (8.64), days to flowering (40.5), days to maturity (93.92), hundred seed weight (60.62) and grain yield (2494 kg ha-1 ) were recorded at the highest rate of 150 kg ha-1 P whereas the highest number of days (40.33) to reach flowering was recorded due to nil application.
Inter-row spacing exhibited significant effect on number of total pods per plant and number of seed per plant. Among the inter-row spacing, 60 cm gave significantly the highest number of total pods per plant (9.25) and number of seed per plant (2.99). The interaction of inter-row spacing and phosphorus rates had non-significant effect on almost all parameters except number of primary branches per plant. The significantly highest number of primary branches per plant (4.7) was recorded with nil application of P under wider inter-row spacing of 60 cm and it was statistically at par with P rates of 150 kg ha-1 for inter-row spacing of 40 cm. The economic analysis revealed that the highest net benefit (34167.56 Birr ha-1 ) was obtained from combination of inter-row spacing of 50 cm with application of 150 P kg ha-1 while the lowest net benefit (19228.69 Birr ha-1 ) was obtained from wider inter-row spacing of 60 cm with no application fertilizer (Table 3).
Therefore, production of Ibado variety with inter-row spacing of 50 cm and 150 P kg ha-1 was most productive for economical production and can be recommended for the study area.
References
- Broughton WJ, Hernandez G, Blair M, Beebe S, Gepts P, et al. (2003) Beans (Phaseolus spp.) - model food legumes. Plant Soil 252: 55-128.
- FAO (2008) Fertilizer and Plant Nutrition Bulletin. Food and Agricultural Organization, Rome, Italy.
- CSA (2017) Agricultural sample survey, area and production of temporary crops, private holdings for the 2017, Meher season. Central Statistical Agency.
- Mulugeta A (2011) Factors affecting adoption of improved haricot bean varieties and associated agronomic practices in Dale woreda. SNNPRS M.Sc. Thesis in Plant Sciences (Agronomy), Hawassa University, Hawassa, Ethiopia, Africa.
- Etefa Y, Dibaba K (2011) Physical and socio-economic profile of Guji zone districts. Bureau of Finance and Economic Development, The National Regional Government of Oromia, Finfinne, Ethiopia.
- Anderson JM, Ingram JS (1993) Tropical soil biology and fertility: a handbook of methods (2ndedn). CAB International, Wallingford, UK, pp. 93-95.
- Black WA, Armstrong BI (1934) An examination of the Degtjareff method for determining soil organic matter, and a proposed modification of the chromic acid titration method. Soil Sci 37: 29-38.
- van Reewijk LP (1992) Procedures for soil analysis (3rdedn). International Soil Reference Information Center (ISRIC), Wageningen, Netherlands, pp. 1-341.
- Olsen SR, Cole CV, Watanabe FS, Dean LA (1954) Estimation of available phosphorous in soils by extraction with sodium bicarbonate. Department of Agriculture, Washington, USA.
- Ethiopian Agricultural Transformation Agency (ATA), Ministry of Agriculture (2014) Soil fertility status and fertilizer recommendation atlas for Tigray regional state, Addis Ababa, Ethiopia.
- Mehlich A (1984) Mehlich 3 soil test extractant: a modification of Mehlich 2 extractant. Commun Soil Sci Plant Anal 15: 1409- 1416.
- Gomez KA, Gomez AA (1984) Statistical procedures for agricultural research (2ndedn). John Wiley and Sons, New York, USA, pp. 1-680.
- Gupta PK (2000) Handbook of soil fertilizer and manure. Anis Offset Press, Paryapuni, New Delhi, India, pp. 1-431.
- Landon JR (1991) Booker tropical soil manual: a handbook for soil survey and agricultural land evaluation in the tropics and sub-tropics. Longman Scientific and Technical, Longman Group, New York, USA, pp. 1-474.
- Hazelton PA, Murphy B (2007) Interpreting Soil Test Results: What Do All the Numbers Mean? (2ndedn). CSIRO Publishing, Victoria, Australia, pp.1-160.
- Wondimu W, Tana T ( 2017) Yield Response of common Bean (Phaseolus vulgaris L.) varieties to combined application of nitrogen and phosphorus fertilizers at Mechara, Eastern Ethiopia. J Plant Biol Soil Health 4: 1-7.
- Tewari JK, Singh SS (2000) Effect of nitrogen and phosphorus on the growth and seed yield of French bean (Phaseolus vulgaris L.). Vegetable Sci 27: 172-175.
- Tesfaye T, Balcha A (2015) Effect of phosphorus application and varieties on grain yield andyield components of common bean (Phaseolus vulgaris L.). Am J Plant Nutr Fertilization Technol 5: 79-84.
- Boutraa T (2009) Growth and carbon partitioning of two genotypes of bean (Phaseolus vulgaris) grown with low phosphorus availability. Eurssian J Biosci 3: 17-24.
- Mehmet OZ (2008) Nitrogen rate and plant population effects on yield and yield components in soybean. Afr J Biotechnol J 7: 4464-4470.
- Dejene T, Tana T, Urage E (2016) Response of common bean (Phaseolus vulgaris L.) to application of lime and phosphorus on acidic soil of Areka, Southern Ethiopia. J Nat Sci Res 6: 90-100.
- Shanka D, Dechassa N, Gebeyehu S (2015) Response of common bean cultivars to phosphorus application in Boloso Sore and Sodo Zuria Districts, Southern Ethiopia. East Afr J Sci 9: 49-60.
- Khan EA, Aslam M, Ahmad NA, Hussain A (2010) Effect of row spacing and seeding rates on growth yield and yield components of chickpea. Sarhad J Agric 26: 201-211.
- Idris AL (2008) Effect of seed size and plant spacing on yield and yield components of faba bean (Vicia faba L.). Res J Agric Biol Sci 4: 146-148.
- Murut G, Tsehaye H, Abay F (2014) Agronomic performance of some haricot bean varieties (Phaseolus vulgaris L.) with and without phosphorus fertilizer under irrigated and rain fed conditions in the Tigray and Afar regional states, northern Ethiopia. Momona Ethiop J Sci 6: 95-109.
- Negash F, Rezene Y (2015) Nitrogen and phosphorus fertilizers rate as affecting common bean production at Areka, Ethiopia. J Agric Crops 1: 33-37.
- Fageria NK (2008) The use of nutrients in crop plants. CRC Press, Boca Raton, Florida, USA, pp. 1-448.
- Girma A, Demelash A, Ayele T (2014) The Response of haricot bean varieties to different rates of phosphorus at Arba-Minch, Southern Ethiopia. ARPN J Agric Biol Sci 9: 344-350.
- Gobeze L, Legese H (2015) Evaluation of common bean varieties at P deficient and sufficient conditions in southern Ethiopia. AshEse J Agric Sci 1: 20-27.
- CIMMYT (1988) From agronomic data to farmer recommendations: an economics work book. The International Maize and Wheat Improvement Center, Mexico, pp. 1-63.