
Research Article
Effect of Plant Spacing on Yield and Yield Related Traits of Common Bean (Phaseolus vulgaris L.) Varieties at Areka, Southern Ethiopia
Maguje Masa1*, Tamado Tana2 and Abdulatif Ahmed2
- 1College of Agriculture and Natural Science, Mizan-Tepi University, Ethiopia, Africa
- 2College of Agriculture and Environmental Science, Haramaya University, Ethiopia, Africa
*Address for Correspondence: Maguje Masa, College of Agriculture and Natural Science, Mizan-Tepi University, P.O Box 260, Mizan-Teferi, Ethiopia, Africa, E-mail: maguje700@gmail.com
Citation: Masa M, Tana T, Ahmed A. Effect of Plant Spacing on Yield and Yield Related Traits of Common Bean (Phaseolus vulgaris L.) Varieties at Areka, Southern Ethiopia. J Plant Biol Soil Health. 2017;4(2): 13.
Copyright: © 2017 Masa M, et al. This is an open access article distributed under the Creative Commons Attribution License, which permits unrestricted use, distribution, and reproduction in any medium, provided the original work is properly cited.
Journal of Plant Biology & Soil Health | ISSN: 2331-8996 | Volume: 4, Issue: 2
Submission: 01 November, 2017 | Accepted: 02 December, 2017 | Published: 11 December, 2017
Keywords
Common bean; Grain yield; Intra-row spacing; Inter-row spacing; Seed size
Abstract
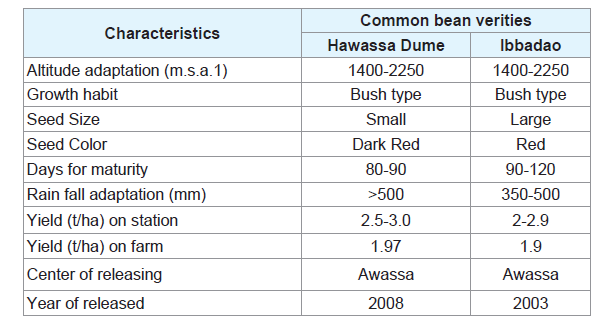
The productivity of common bean is low due to use of inappropriate inter and intra row spacing for varieties with different seed sizes and growth habits in the study area. Thus, a field experiment was conducted at Areka, in the ‘meher’ season of 2015 to assess the effects of inter and intra row spacing on yield and yield related traits of common bean varieties. The two common bean varieties [Hawassa dume (small seed sized) and Ibbado (large seed sized)], three inter (30 cm, 40 cm and 50 cm) and three intra (7 cm, 10 cm and 13 cm) row spacing were factorially combined in randomized complete block design with three replications. The result showed significantly (P<0.01) higher days to 50% flowering (45.7), days to 90% physiological maturity (78.3) and hundred seed weight (44.07 g) for variety Ibbado, while significantly (P<0.01) highest number of total nodules (29.64), effective nodules (14.93), pod per plant (19.5), primary branches (2.6) and grain yield (2264 kg ha-1) were recorded for variety Hawassa dume. As inter row increased from 30 cm to 50 cm; plant height, days to physiological maturity and grain yield decreased, while pods per plant and hundred seed weight increased. Also, as intra row increased from 7 cm to 13 cm; leaf area index, plant height, dry biomass and grain yield were decreased, whereas leaf area, pods per plant, seeds per pod and hundred seed weight were increased. Among the interaction combinations of variety Hawassa dume in 40 cm, 30 cm and 50 cm row spacing gave significant (P<0.01), highest leaf area (1099.9 cm2), leaf area index (3.41) and seeds per pod (5.24), respectively, while highest dry biomass (4137 kg ha-1) for variety Hawassa dume and (4533 kg ha-1) for variety Ibbado in 30 cm. From the results of this study it can preliminary be concluded that the 30 cm inter-row and 7 cm intra-row spacing can be used for both varieties (Hawassa dume and Ibbado) to improve the productivity of the crop under study area.
Introduction
Common bean (Phaseolus vulgaris L.) is one of the most important grain legumes of Ethiopia. It belongs to family Fabaceae, cultivated in tropics, sub-tropics, and temperate zones for its edible bean, popular both dry and as a green bean [1]. There are diverse botanical varieties of the species Phaseolus that vary in terms of growth habit, seed and pod characteristics, agronomic features, and response to biotic and a biotic stresses [2]. The crop is now widely distributed throughout the world and is grown in all continents except Antarctic and occupies more than 90% of production areas sown to Phaseolus species [3].
As it is quick maturing and can be cropped under different cropping systems for different purpose, bean serves as a key component in intensifying production in small holder farmer systems. Its ability to fix nitrogen also means that it can encourage much-needed, even longer term improvements in soil fertility, and it provides an economic advantage to small farm holdings as an alternative source of protein, cash income, and food security [4].
Apart from this, common bean has been cultivated as a field crop for a very long time and hence, it is the important food legume produced as food crop for home consumption and later on it is grown as an export crop for a much long period in the Ethiopia [5].
Almost all common beans production (more than 99 percent) comes from five major producing regions; Oromia, Amhara, Southern Nations Nationalities and Peoples Region State (SNNPRS), Benishangul-Gumuz and Tigray regions [6]. In all parts of Ethiopia, the crop is grown by subsistence farmers as a sole crop and intercropped with either cereals (maize and sorghum) or tree crops (enset, coffee, etc) and root crops (yam and taro) [7]. The total area under production of common bean currently in Ethiopia is (323,317.99 hectares), and the production of (513,724.807 tons) with the productivity of 1.6 tons ha-1 and 1.58 tons ha-1 for white and red common bean, respectively [8].
Wolaita Zone is one of highly common bean producing Zones of the SNNPRS for a long period of time. Due to bi-modal cropping season of the study area, common bean is normally grown twice a year under rain fed agriculture. The first production is during the short rainy season (April to June) and second is during the long rain season (July to October) [9]. About (25,994.67 hectares) was covered by common bean during the ‘Meher’ season of 2014/2015 cropping season and produced 37,712.213 tons with average productivity of 1.45 tons ha-1 [8]. This yield is far less than the achievable production potential value of the crop which is 2-3 tons ha-1 [10].
Low yield of common bean in Ethiopia is attributed to several production constraints which include lack of seeds of improved varieties for the agro-ecological zones, poor cultural practices such as untimely and inappropriate field operations, inappropriate plant density, weed infestation, low soil fertility, water stress, diseases and insect pests [11].
Increase in yield can be ensured, by maintaining appropriate plant population through different planting patterns. Planting pattern influences radiation interception and utilization of moisture from soil [12]. Main role of planting pattern on plant growth is due to differences in distributing and dispersion of light energy quality and quantity among plants which induced improving grain yield and biological yield with increasing ratio uptake [13].
Plant density affects early ground cover, competitive ability of crops with weed, soil surface evaporation, light interception, lodging and development of an optimum number of fruiting sites in a crop canopy. It also affects canopy development, plant architecture and distribution of pods [14]. However, optimum plant density varies depending on crop species or varietal differences in vigor, height and branching, time of sowing, and the nature of the season [15]. Selecting optimal row spacing is important to improve crop productivity as plants growing in too wide of a row may not efficiently utilize light, water, and nutrient resources. However, crops grown in too narrow rows may result in severe inter row competition. Row spacing also modifies plant architecture, photosynthetic competence of leaves, and dry matter partitioning in several field crops [16].
Low productivity of common bean varieties might be associated with inappropriate crop geometry can affect yield of different varieties. As described by MoA about 50 common bean varieties are released nationally from different institutes (Universities and Research Centers), for those all varieties inter and intra row spacing recommended nationally for different locations is the same (40 cm×10 cm) while the varieties have phenotypic and genotypic characters variations that might respond differently for crop geometry [17].
Workineh E et al. concluded that the yield variation in common bean is associated with seed size which requires different breeding approaches in order to improve the yield of different seed size groups of common bean [18]. Melaku B also reported significant variety and plant density interaction on the phenology, growth, yield components and yield of common bean [19]. The characteristics of different common bean varieties are different each other in terms of their growth habit, days to maturity, seed color, seed size, and seed weight, and agroecological adaptation [20]. The seed size of Phaseolus vulgaris varies considerably, but most commercial cultivars of common beans have a seed size in the range of 200 to 350 mg [21]. According to Seyum EG, plant spacing of 40 cmx7 cm resulted in the highest total pod yield and lowest total pod yield was obtained from a green bean spaced at 40 cm×10 cm [22]. Blackshaw RE et al. demonstrated that reduction in row spacing from 69 to 23 cm resulted in increased yield of dry bean [23]. Melaku B stated that the highest grain yield for row spacing combination of 30 cm×15 cm on common bean [19].
However, there is difference in growth habit and seed size among common bean varieties, only one plant density of 40 cm×10 cm has 250,000 plants ha-1 adopted; irrespective of rain-fed or irrigated conditions, soil type, varieties, climatic conditions [24]. Moreover, the optimum plant population differs with the availability of soil moisture, relative humidity and nutrients. Spatial arrangement of the plant directly or indirectly affects the production potential of common bean varieties. Thus, there is no site and variety specific recommendation on the plant spacing of common bean varieties in Ethiopia. In view of the above facts the present investigation was undertaken with the objective to assess the effects of inter and intra row spacing on yield and yield related traits of common bean varieties.
Materials and Methods
Description of the study area
The study was conducted at Areka Agricultural Research Center (ArARC), Wolaita Zone, South Nations Nationalities and Peoples Regional State (SNNPRS), during the ‘meher’ season from June to August, 2015. The experimental site is located 300 km south of Addis Ababa and 29 km away from Zonal town, Sodo. The geographical location is 7°4'24'' N latitude and 37°41'30'' E longitude and at altitude of 1830 m.a.s.l. It receives mean annual rainfall of 1520 mm in a bi-modal pattern with extended rainy season from March to October. The mean annual maximum temperature is 26 °, whereas the mean annual minimum temperature is 14 °C. The type of the soil is Nitisols [25,26]. The cropping season (July to November) total rain fall distribution was 638.4 mm and, average minimum and maximum temperature was 14.58 °C and 25.12 °C, respectively.
Experimental materials
The varieties of common bean used for the study were Hawassa dume and Ibbado which have different seed size. The description of the varieties is indicated in Table 1.
Treatments and experimental design
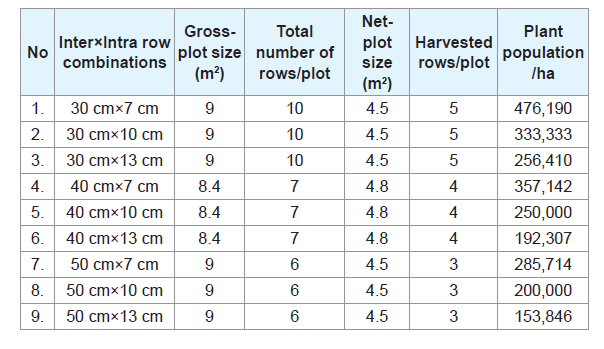
The factors studied were two varieties of common bean (Hawassa Dume and Ibbado), three inter row spacing (30 cm, 40 cm and 50 cm) and three intra row spacing (7 cm, 10 cm and 13 cm). Treatments were arranged in a factorial combination using randomized complete block design (RCBD) with three replications. A single plot size for 30 cm and 50 cm inter row spacing was 3 m×3 m, while inter row spacing of 40 cm was 2.8 m×3 m. One row was used for destructive sampling from all plots (Table 1).
Soil sampling and analysis
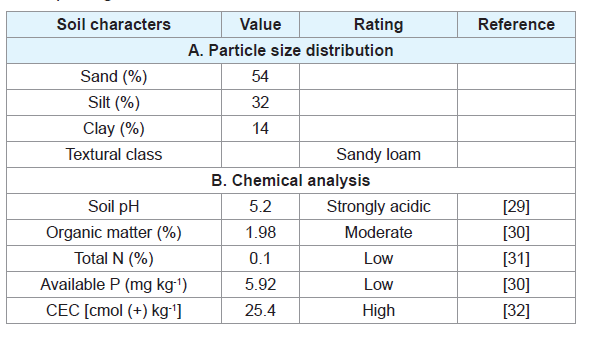
Pre-planting one composite soil sample from the experimental site was collected in a zigzag pattern from the depth of 0-30 cm before planting. A uniform volume of soil was obtained from each plot by vertical insertion of an auger. The samples were air dried in laboratory, ground using a pestle and a mortar and allowed to pass through a 2 mm and 0.2 mm sieve. Working samples were obtained from each submitted samples and analyzed for organic matter, total N, soil pH, available phosphorus, cation exchange capacity (CEC) and textural analysis using standard laboratory procedures in Wolaita Sodo soil laboratory.
Management of the experiment
The land was plough and disked by a tractor, and leveled manually. The field was cleared from all unwanted materials and layout was prepared against soil fertility gradient and slope. The field layout was prepared, divided in to blocks, and again each blocks divided into plots. After randomization of treatment was done, the proposed inter-intra row spacing prepared. The spacing between blocks and plots was 1.0 m and 0.6 m, respectively. The seed was obtained from Areka research center and sowed in mid-August after land prepared in the depth of about 5 cm. Two seeds per hole were sown and thinned one plant per hill a week after emergence throughout the plots. The recommended rate of Urea (50 kg ha-1) and DAP (100 kg ha-1) were applied as the sources of N and P; respectively, during planting. All other necessary agronomic management practices were carried out uniformly as the recommendation.
Data collected
Phenological parameters: Days to 50% emergence was recorded as the number of days from sowing to when 50% of plants were emerged in each plot. Similarly, days to flowering was recorded as the number of days from planting to when 50% of the plants produced flower; and days to physiological maturity was recorded as the number of days from planting to when 90% the plants in a plot showed yellowing of pods.
Growth parameters: Leaf area was measured in (cm2) by taking a destructive sample of five plants from each plot just before flowering using pictorial method and average area was calculated. From the leaf area, leaf area index was calculated as the ratio of total leaf area to the respective ground area occupied by the plant for each plot. The total number of nodules was determined by counting from five plants randomly taken from destructive sampling row of each plot at flowering. Roots were carefully exposed with the bulk of root mass and nodules. The nodules were separated from the soil, washed and the total number of nodules was determined by counting. Then, effective and non-effective nodules were separated by their colors where a cross section of an effective nodule made with a blade showed a pink to dark-red color, whereas a green and white color indicates ineffective nodules.
Plant height was measured from 10 randomly selected plants from the ground level to the apex of each plant at the time of physiological maturity from the net plot area. Number of primary branches per plant was determined by counting of primary branches on the main stem from randomly selected 10 plants from the net plot area.
Yield components and yield: The initial plant stand count was recorded by counting the total number of plants per net plot area immediately after thinning at establishment and final plant stand count was taken from net plot areas when the plants attained harvest maturity and converted to hectare, and then the percent mortality was calculated to determine the change in stand count due to competition effect. Number of pods per plant was determined by counting the number of pods per plant of 10 randomly selected plants from each net plot area at harvest. Similarly, number of seeds per pod was counted from 10 randomly selected pods from each net plot at harvest.
Hundred seed weight (g) was determined by taking weight of 100 randomly sampled seeds from the total harvest from each net plot area and adjusted to 10% moisture level. Total above ground dry biomass (g) was determined by taking 10 plants from each net plot area, then the total weight of the harvest including the seeds after oven drying for 48 hrs at 70 °C the biomass at physiological maturity and converted to kg ha-1. Seed yield (kg) was determined after threshing the seeds harvested from each net plot and adjusted to 10% moisture level and converted to kg ha-1. Harvest index (HI) was computed as the ratio of seed yield (kg ha-1) to the total above ground dry biomass (kg ha-1)×100.
Statistical data analysis
All measured parameters were subjected to analysis of variance (ANOVA) appropriate to factorial experiment in RCBD according to the GenStat version 15 and interpretations were made following the procedure described by Gomez KA et al. [27,28]. Whenever the effects of the factors were found to be significant, the means were compared using the least significant differences (LSD) test at 5% level of significance.
Results and Discussion
Physico-chemical properties of the experimental site soil
Selected physico-chemical properties of the experimental site soil before planting in Table 3.
Phenological parameters of common bean
Days to 50% emergence: The main effect of variety was highly significant (P<0.01) on days to emergence, while both main effect of inter and intra row spacing, and all the interactions were non-significant (Table 4).
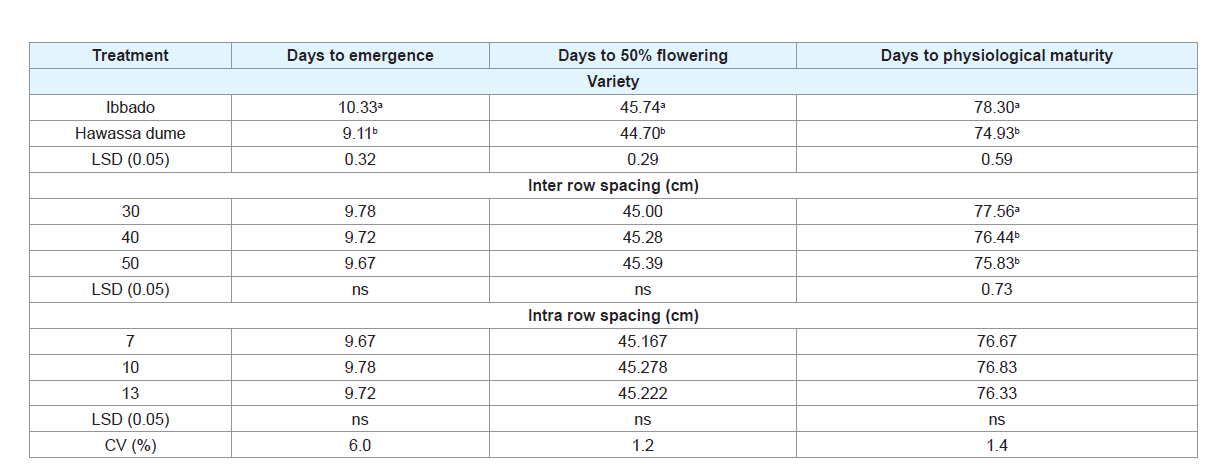
The smaller sized variety Hawassa dume emerged earlier (9.11 days) than large seeded variety Ibbado (10.33 days) (Table 5). The reason for difference among varieties in days to emergence might be due to seed size where varieties with large seed size take more time to imbibe water and germinate than varieties with small seed size. This result was in agreement with the study of Li PH et al. who reported that small seeded cultivars of common bean tended to germinate and grow more rapidly than large seeded ones when grown at relatively high temperature (28 °C) [33]. In contrast, Austin RB et al. reported that at low temperatures (12 °C) large seeded cultivars of common bean tended to germinate more quickly than small seeded ones [34].
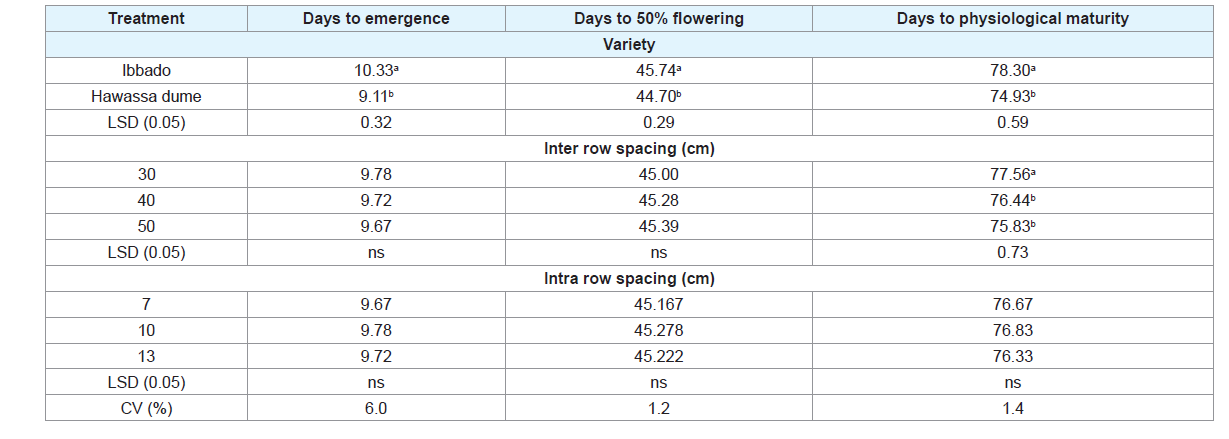
Days to 50% flowering: There was highly significant (P<0.01) main effect of variety on days to 50% flowering, while main effect of inter and intra row spacing, and all interaction effects were not significant (Table 4).
Variety Hawassa dume was early flowering which required 44.7 days than Ibbado which flowered on 45.74 days after planting (Table 5). This might be due to the genetic makeup differences among the two varieties. In addition, the variety early emerged grows faster at early stage and starts flower initiation earlier than later emerged variety. In line with this result, Al-Rifaee M et al. reported that faba bean originating from small seeds were faster in emergence, earlier in flowering and in maturity [35]. In conformity to this result, Tripathi S et al. reported differences among varieties of chickpea in days to 50% flowering [36]. Similar report by CIAT, flowering of (Phaseolus vulgaris) is usually initiated 28-42 days after planting, but varieties growing at high elevation flowering later [37].
Days to 90% physiological maturity: The main effect of variety and inter row spacing had significant (P<0.01) effect on days to physiological maturity while the main effect of intra row spacing and any of the interactions were not significant on days to physiological maturity (Table 4).
Variety Hawassa dume with smaller seed size matured early (74.93) than variety Ibbado with large seed size which took, 78.30 days to mature (Table 5). However, days to physiological maturity of both varieties reduced from normally recorded days of maturity, which might be due to moisture stress caused by erratic rain fall during growing season. This difference might be attributed to the fact that small seeded varieties emerge early and reach flowering and maturity early than the late emerged large seeded varieties. This result was in conformity with the study by Al-Rifaee M et al. who reported that small seeds of faba bean matured earlier than large seeded and had higher harvest indices [35]. In line with this result, Lima ER et al. reported plants originating from small seed presented a higher relative growth rate and net assimilation rate than plants from large seeded of common bean [38]. Similarly, Woku W obtained significant difference among varieties on days to physiological maturity of common bean [39].
Among inter row spacing, narrow spacing with 30 cm required more days to physiological maturity than wider spacing of both 40 cm and 50 cm. As the inter row spacing increased from 30 cm to 50 cm, the days to maturity decreased from 77.56 days to 75.83 days (Table 5). This might be due to high amount of radiation energy accepted at wider row spacing destroys growth regulating hormones at the cell differentiating parts of the plant that resulted in stopping further growth increments and forced to mature. In agreement with this result, Melaku B reported that days to maturity increased from 79.89 days to 82.33 days as plant density increases from 133,333 plants ha-1 (50 cm×15 cm) to 333,333 plants ha-1 (30 cm×10 cm) on common bean [19]. In contrast, Mebrat S et al. obtained increasing days to maturity as inter-row spacing increased from 20 to 30 and 40 cm of check pea, while Holshouser DL et al. found no significant effect of row spacing on maturity on soybean [40,41].
Growth parameters of common bean
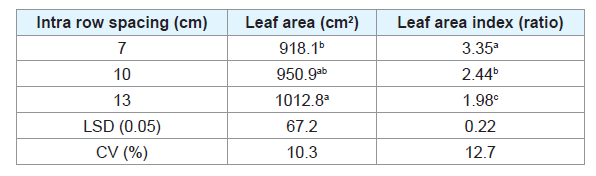
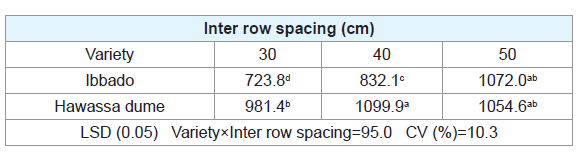
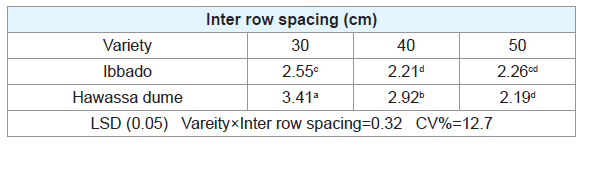
Leaf area and leaf area index: The main effect of intra row spacing was significant (P<0.05) on leaf area and highly significant (P<0.01) on leaf area index, while the main effect of variety and inter row spacing, and the interaction effect of variety and inter row spacing were highly significant (P<0.01) on both leaf area and leaf area index (Table 4).
As intra row spacing increases from 7 cm to 13 cm, the leaf area increase from 918.1cm2 to 1012.8 cm2 irrespective of variety, while leaf area index decreases from 3.35 to 1.99 (Table 6). This might be due to low amount of resources for leaf area increment under crowding density with narrow spacing which reduces ground cover area of a plant. In agreement to this result, Mehmet OZ observed that leaf area index (LAI) of soybean increased with increasing plant population from 7 to 21 plants m-2 [42]. Similarly, Mekonnen SA reported that as plant density increased, leaf area and leaf number decreased, whereas leaf area index increased on common bean [43].
Variety Hawassa dume at inter row spacing of 40 cm had the highest leaf area (1099.9 cm2) which was statistically at parity with inter row spacing of 50 cm for both varieties (Table 7). On the other hand, variety Ibbado at the narrowest inter row spacing of 30 cm gave the lowest leaf area (723.8 cm2). Between the varieties, Hawassa dume had higher leaf area at 30 cm and 40 cm inter row spacing. The higher leaf area per plant with wider inter row spacing might be due to more availability of growth resources such as light, soil moisture and nutrients which consequently increased number of leaves produced and the size of individual leaves in plants at wider row spacing. This result was in line with the work of Kueneman EA who reported that the low plant population tended to enhance vegetative growth of dry bean (Phaseolus vulgaris) plant resulting in the development of large leaf area compared to the high and moderate plant populations resulting in sink limitation to photosynthesis [44].
Variety Hawassa dume at inter row spacing of 30 cm resulted in the highest leaf area index of 3.41 while the lowest LAI of 2.19 was recorded for variety Hawassa dume at spacing of 50 cm (Table 8). The reduction in the LAI at the widest row spacing might be due to wider ground area occupied per plant. In general, variety Hawassa dume had higher LAI at all the row spacing than variety Ibbado possibly due to higher number of leaves produced. Wider inter and intra row spacing results in higher plant geometric area which reduces leaf area index per plant. Similarly, higher light interception in narrow rows results from either larger leaf area index (LAl) and/or increased light interception per unit leaf area due to more uniform plant arrangement [45]. In line with this result, Mekonnen SA reported that leaf area index increased as plant population of common bean increased [46]. Similarly, Idris AL also reported that increased plant density increased leaf area index on faba bean [47]. In contrast, El-Naim AM et al. reported that leaf area index decrease with increasing plant densities of cowpea from 30,000 to 120,000 plants ha-1 [48].
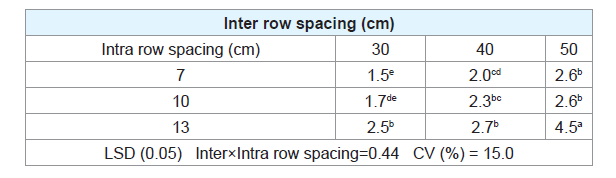
Number of primary branches: The result of analysis showed that, the main effect of inter and intra row spacing was highly significant (P<0.01), while the main effect of variety significant (P<0.05). Moreover, interaction of inter and intra row spacing was highly significant (P<0.01) on number of primary branches per plant (Table 4). Variety Hawassa dume had higher number of primary branches with mean value of 2.6 than variety Ibbado (2.38). This might be due to cultivars difference for branching and lateral differentiation. Branch formation and the overall balance between reproductive and vegetative growth associated with photoperiod of the cultivars. In line to this study White LW et al. observed that small seeded genotypes were day neutral and large seeded genotypes were predominantly photoperiod sensitive which affects branching [49].
The highest number of primary branches per plant of (4.5) was recorded for the widest inter and intra row spacing combination of 50 cm with 13 cm while the lowest number of branches of (1.5) was recorded at the combination of the narrowest inter row (30 cm) and intra row (7 cm) spacing regardless of variety (Table 9). The narrowest inter and intra row spacing combination resulted in the lowest number of primary branches per plant than wider spacing combinations. The increased numbers of branches at the wider inter and intra row spacing could also be attributed to more interception of sunlight and nutrients that might have resulted in higher axillary buds formation and differentiation leading to higher number of branches per plant. In line with this result, Tuarira M et al. reported the highest number of branches (8.56) on the lowest population of 125,000 plants ha-1 and the lowest (5.45) on the highest plant population of 320,000 plants-1 of green bean [50]. Likewise, Amany MA reported that the increase of planting density from 25 to 33 plant m-2 increased plant height while decreased number of branches per plant of faba bean [51]. Similarly, Wells R et al. on soybean indicated that radiation penetrating in to canopy was decreased with high plant population and reduced number of branches per plant [52].
Plant height: The analysis of variance showed that the main effect of inter row spacing was highly significant (P<0.01), while the main effect of intra row spacing was significant (P<0.05) on plant height. However, the main effect of variety and any of the interaction effects were not significant on plant height (Table 4).
The narrowest inter row spacing of 30 cm and intra row spacing of 7 cm resulted in the highest plant height of 47.2 cm and 46.07 cm, respectively. In general, as inter and intra row spacing increased, the plant height decreased showing that row spacing to be inversely related to plant height for both varieties (Table 10). This might be increasing light, air and space demand for narrow spaced plant population which resulted in increase of height in search of light. Also at early stage of growth there is high rate of growth regulating hormones production which fastens cell division, growth and height of the plant. But cell division decreased as plant grows and further height increment stops and goes to maturity. Similar results were reported by Caliskan S et al. where the tallest plants were obtained in a 30 cm row width, while the shortest was obtained in a 70 cm row width of soybean [53]. Similarly, Selim MM et al. reported that plant height was increased with increasing population density up to 33.3 plants m-2 or up to 44.4 plants m-2 of faba bean [54]. In line with this result, Khalil SK et al. and Thalji T indicated that the denser plant population increased the plant height of faba bean due to competition among plants [55,56]. Likewise, Tuarira M et al. reported that the tallest plants (61.14 cm) with highest plant density of 320,000 plants ha-1 and the lowest plant height of 52.55 cm in the lowest plant density of 125,000 plants ha-1 of green bean [50].
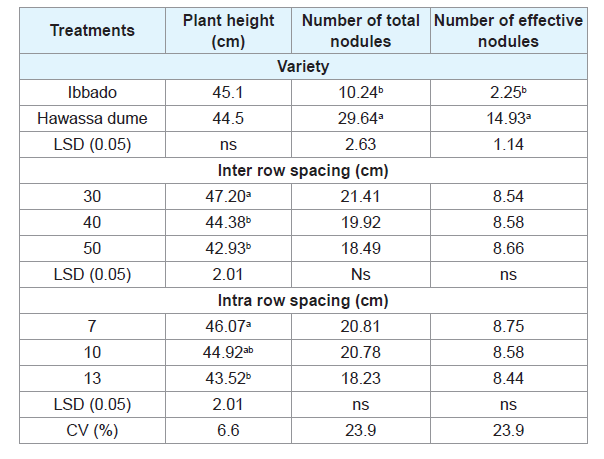
Nodulation: The main effects of variety was highly significant (P<0.01) on total, effective and non-effective nodules per plant. However, main effects of inter and intra row spacing, and any of the interactions were not significant (Table 11).
Variety Hawassa dume with small seed size had higher total nodules (29.64) and effective nodules (14.93) than variety Ibbado which had large seed size (Table 10). This might be the varietal difference for symbiotic relationship with bacterial strain. This result was in agreement with the study of Salema MP who reported that the amount of nitrogen fixed by the common bean is dependent on the interaction among three factors: the host (bean) plant, the Rhizobium strain and the environment [57]. Similarly, Nyemba RE et al. reported that differences exist among cultivars in their respective abilities to fix nitrogen [58].
Yield components of common bean
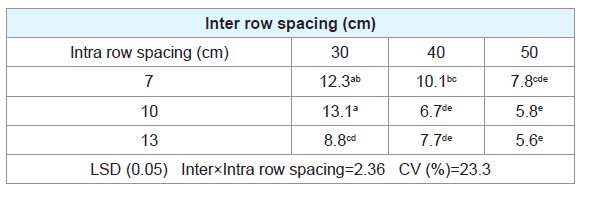
Stand count: The main effects of inter and intra row spacing were highly significant (P<0.01) on percent stand count reduction at harvest as compared to the stand count at establishment. Moreover, the interaction effect of inter and intra row spacing was significant (P<0.05) while the main effect of variety was not significant on sand count (Table 11).
The highest stand count reduction (13.1%) was recorded at inter and intra row spacing combination of 30 cm×10 cm which was statistically at parity with inter and intra row spacing of 30 cm×7 cm (12.3%). Whereas, the wider inter and intra row spacing combinations of 50 cm×10 cm, and 50 cm×13 cm resulted in the lowest stand mortality of 5.8%, and 5.6%, respectively (Table 12). In general, closer inter and intra row spacing combination resulted in higher stand reduction than wider spacing combinations. The reasons for the highest percent reduction of stand count at the narrowest inter and intra row spacing might be due to crowding effect. There is a possibility that at narrower inter and intra row spacing (with higher population density) smaller plants crowded out and die due to intense competition for growth resources. This result was in line with the study by Njoka EM et al. who reported increased plant mortality as density of plant increased in common bean [59]. Similarly, Idris AL reported reduced plant competition and plant mortality at lower plant population on faba bean [47].
Number of pods per plant: The result of ANOVA showed that the main effect of variety and inter row spacing was highly significant (P<0.01), while the main effect of intra row spacing was significant (P<0.05) on the number of pods per plant. However, interaction effects were not significant (Table 11).
Variety Hawassa dume with smaller seed size had higher number of pods per plant (19.52) than variety Ibbado which had larger seed size (11.24) (Table 13). This might be due to inherent varietal difference associated with formation of pods and other sink that determines the yield of variety. In agreement with this result, Tripathi S et al. reported significant differences among genotypes of chickpea for number of pods per plant [36].
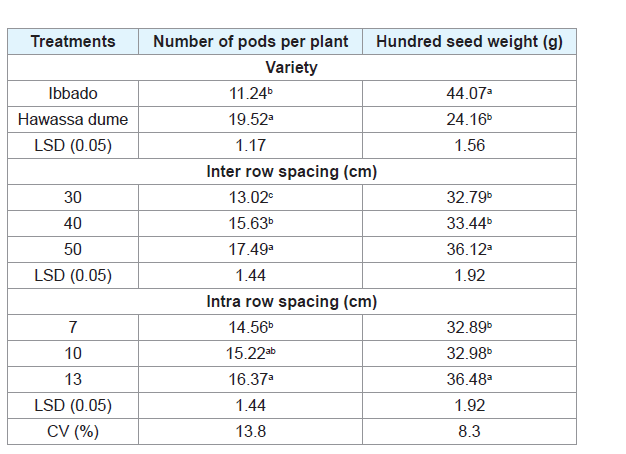
Wider inter row spacing (50 cm) resulted in higher pods per plant (17.49) than narrow inter row spacing of (30 cm) with 13.02 pods per plant. Similarly, wider intra row spacing of (13 cm) resulted in higher number of pods per plant (16.37) which was statistically at parity with intra row spacing of 10 cm (15.22) than closely spacing of 7 cm with 14.56 pods per plant (Table 13). In general, as row spacing decreases, the number of pods per plant decreases due to increasing population and resource competition. The number of pods per plant is directly related with number of primary branches per plant. This might be due to the fact that lower resources (nutrients, light and soil moisture) for narrow row spacing resulted in few lateral branching and pod initiation due to its higher population with closely planting which have nutrient scarcity for sink formation.
This result was in agreement with the study of Mebrat S et al. who obtained higher number of pods per plant (24.06) at 15 cm and lower (22.34) at 10 cm intra-row spacing of check pea [41]. Likewise, Abubaker S reported that wider row spacing of 60 cm gave significantly higher number of pods compared to 30 cm row spacing in common bean [60]. Similarly, Chandhla J reported that the highest number of pods per plant (7.2) at 40 cm inter row spacing and the lowest (5.0) at narrowest spacing of 20 cm of dry bean (Phaseolus vulgaris L) [61]. In line to this result Khalil SK et al., Bakry BA et al. and Singh SP et al. observed increase in number of pods with increase in the row spacing because lower populations are more efficient in utilizing the resources of production than the higher plant densities [55,62,63].
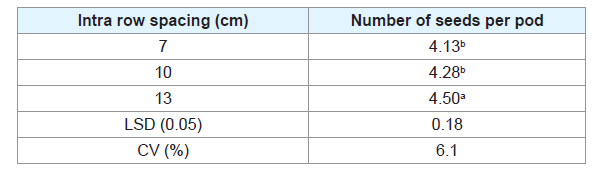
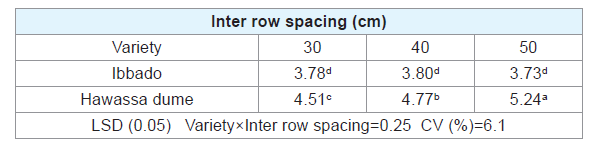
Number of seeds per pod: The main effect of intra row spacing and variety was highly significant (P<0.01), and the main effect of inter row spacing was significant (P<0.05) on number of seeds per pod. Moreover, interaction of variety and inter row spacing was highly significant (P<0.01) on the number of seeds per pod (Table 11).
The number of seeds per pod of wider intra row spacing of 13 cm was 4.5, which were the highest as compared to the other intra row spacing (Table 14). The number of seeds per pod decreased with decreasing intra row spacing. This might be due to the fact that closely spaced plants encountered more inter plant competition for resources which reduced the number of seeds per pod. In agreement with this result, Melaku B obtained the highest number of seeds per pod (5.9) at the lowest plant population of 133,333 plants ha-1 and the lowest seeds per pod (5.6) at the highest plant population of 333,333 plants ha-1 of common bean [19]. In line with this result, Osman AA et al. the increase on the number of seeds per plant with increase in plant spacing to more nutrients available for fewer plants at lower plant density [64]. Similar, Chandhla J reported that the highest number of seeds per pod (3.7) at the widest inter and intra-row spacing of 20 cm×30 cm and lowest (3.2) at the narrowest row spacing of 20 cm×15 cm on dry bean [61].
The variety Hawassa dume with widest inter row spacing of 50 cm had the highest number of seeds per pod of 5.24 while significantly lower number of seeds per pod were recorded for variety Ibbado at all the row spacing (Table 15). Smaller seeded variety Hawassa dume produced higher seeds per pod with respective of wider and narrower row spacing than large seeded variety Ibbado. Large seeded variety had larger pods but less number of seed while smaller seeded variety had thinner pod which contained more number of seeds per pod. This might be inherent difference between the varieties for number of seeds per pod production. In conformity with this result, Fageria NK et al. reported that the number of seeds per pod of different common bean genotypes varied in the range of 3.1 to 6 and they attributed the difference due to the genetic variation of cultivars [65]. Similarly, Lima ER et al. obtained that large seed did not affect grain yield, but reduced the number of seeds per pod, increased the hundred seed mass of common bean [38].
Hundred seed weight: The main effect of variety and intra row spacing was highly significant (P<0.01), and the main effect of inter row spacing was significant (P<0.05) on hundred seed weight. However, the interaction effects were not significant (Table 11).
Variety Ibbado had higher hundred seed weight (44.07 g) than variety Hawassa dume with hundred seed weight of 24.16 g (Table 13). This might be due to the variation between the varieties where the variety Ibbado had inherently large seed than variety Hawassa dume was small seed size. In agreement with this result, Tesfaye K reported that small seeded genotypes produced higher number of pods per plant and seeds per pod [66]; whereas hundred seed weight were higher for the large seeded genotypes of common bean. Similarly, Lima ER et al. reported that plants originating from large seed had lower number of seeds per pod but higher hundred seed mass of common bean [38].
Wider inter and intra row spacing of 50 cm and 13 cm resulted in higher hundred seed weight of 36.12 g and 36.48 g, respectively, than narrow inter and intra row spacing of 30 cm and 7 cm with 32.79 g and 32.89 g hundred seed weight, respectively (Table 13). Higher hundred seed weight was recorded for lower plant populations of wider inter and intra row spacing, than denser plant population with narrow inter and intra row spacing. This might be due to enough growth resource availability under wider inter and intra row spacing which converted biological yield to economic yield and stored in seed yield. In addition, in wider spaced plants, the improved supply of assimilates to be stored in the seed, hence, the weight of hundred seeds increased. The result of this study was in line with result obtained by Melaku B who obtained the highest hundred seed weight of 27.47 g at the lowest plant population of 133, 333 plants ha-1 and the lowest 24.99 g at the highest plant population of 333,333 plant ha-1 of common bean [19]. Similarly, Amany MA reported that the increase of planting density from 25 to 33 plant m-2 increased plant height while decreased number of branches per plant, number of pods per plant, number of seeds per plant, hundred seed weight and seed yield per plant [51].
Yield and Harvest Index of Common Bean
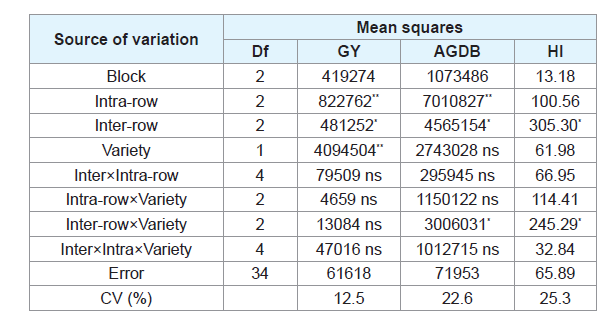
Total above ground dry biomass: Main effect of intra row spacing was highly significant (P<0.01) whereas, main effect of inter row spacing and, interaction effect of variety and inter row spacing were significant (P<0.05) on above ground dry biomass. But the main effect of variety was not significant on dry biomass (Table 16).
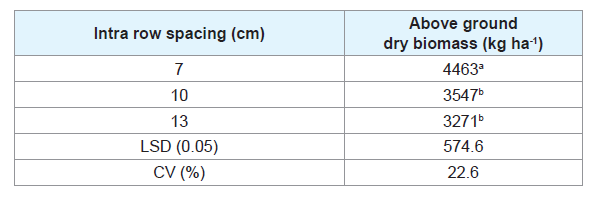
The highest above ground dry biomass (4463 kg ha-1) was recorded for the narrowest intra row spacing of 7 cm, whereas the lowest 3271 kg ha-1 was recorded for the widest intra row spacing of 13 cm (Table 17). The above ground dry biomass decreased as intra row spacing increased from 7 cm to 13 cm. This might be due to the high vegetative growth to become more competitive for light and increased plant population under narrow intra row spacing. In agreement with this, Kazemi E et al. obtained the highest biological yield 5761 kg ha-1 for plant density of 13 plants m-2 and lowest 5050 kg ha-1 for plant density of 22 plants m-2 of white beans [67].
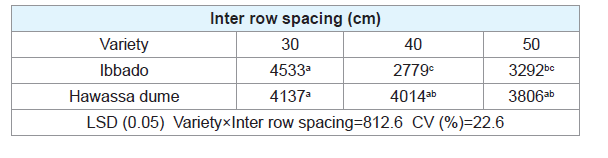
The highest above ground dry biomass (4533 kg ha-1) was recorded for variety Ibbado at inter row spacing of 30 cm followed by variety Hawassa dume at inter row spacing of 30 cm (Table 18). On the other hand, the lowest above ground dry biomass of 2779 kg ha-1 was obtained for variety Ibbado at inter row spacing of 40 cm which was statistically at parity with inter row spacing of 50 cm for same variety. In general, as the inter row spacing increased, the above ground dry biomass was decreased for both varieties Hawassa dume and Ibbado. Highest above ground dry biomass obtained with narrower inter row spacing might be highest vertical vegetative growth with less lateral branching and reproductive organ production before physiological maturity. It could also be that at the narrow row spacing there is more number of plants per unit area resulting in higher above ground dry biomass. In line of this result, Rasul F et al. reported that narrow inter row spacing (30 cm) produced the highest biological yield as compared to wider inter-row spacing (45 cm and 60 cm) on mung bean [68]. Similarly, Pawar SU et al. reported that dry biomass per hectare was significantly increased with increased plant density on haricot bean [69].
Grain yield: Main effect of variety and intra row spacing was highly significant (P<0.01), and the main effect of inter row spacing was significant (P<0.05) on grain yield. However, there was no significant effect of interaction of variety, inter and intra row spacing (Table 16).
Small size seeded variety Hawassa dume had significantly higher grain yield of 2264 kg ha-1 than large size seeded variety Ibbado with the mean yield of 1714 kg ha-1 (Table 19). This might be due to the inherent variation in the genetic makeup for photosynthesis and translocation of dry matter to grain yield production among the varieties where variety Hawassa dume had higher LAI, number of pods, seeds, primary branches and above ground dry biomass there by resulting in higher grain yield than variety Ibbado. This result agreed with previous study that showed higher rate of photosynthesis in small seeded bean varieties than the large seeded ones which ultimately resulted in more grain yield [70].
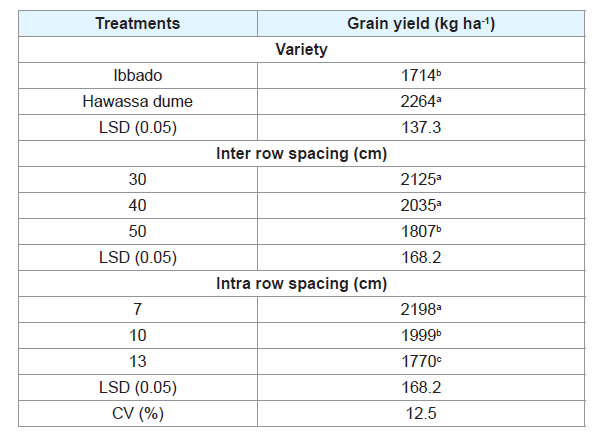
The highest grain yield of 2125 kg ha-1 was recorded with the narrowest inter row spacing of 30 cm and as the row spacing increased the grain yield was decreased. Similarly, the highest grain yield of 2198 kg ha-1 was recorded with the lowest intra row spacing of 7 cm, and as intra row spacing increased, the grain yield was decreased significantly (Table 19). This might be higher plant stand at dense population contributes to high grain yield and effective light interception than sparse population. In line with this result, Egli DB reported that high population ensured early canopy coverage and maximizes light interception, greater crop growth rate and crop biomass resulting in increased yield in soybean [71]. Similarly, Aslam M et al. found that narrow inter-row spacing (30 cm) gave the highest seed yield as compared to wider spacing of 45 and 60 cm on soybean [72].
Sparse plant population with wider spacing results in higher yield per plant but lower yield per unit area. This was also in agreement with the study of Ball RA et al. who reported that increasing plant population reduced yield of individual plants but increased yield per unit area of common bean [73]. Similarly, Abubaker S reported superior yield from the high plant populations over that of low plant population of haricot beans [60]. Also, Kazemi E et al. obtained the highest grain yield (2393 kg ha-1) from plant density of 13 plants m-2 and lowest grain yield (2010 kg ha-1) from 22 plants m-2 of white beans (Phaseolus vulgaris L.) [67]. In line with this result, Mekonnen SA reported highest seed yield per plant with the minimum plant population (150000 plants ha-1) and lowest seed yield per plant with the highest plant population (350000 plants ha-1) of haricot bean [43].
Harvest index: The main effect of inter row spacing and, interaction of variety and inter row spacing were significant (P<0.05) on harvest index, where the main effects of variety and intra row spacing were not significant (Table 16).
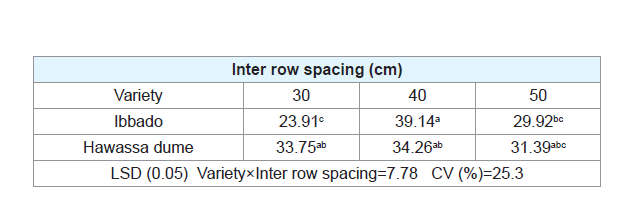
The highest harvest index of 39.14% was recorded for variety Ibbado at inter row spacing of 40 cm and it was statistically at parity with inter row spacing of 30 cm, 40 cm and 50 cm for variety Hawassa dume (Table 20). Variety Ibbado recorded lowest harvest index (23.91%) for narrowest inter row spacing of 30 cm. In wider inter row spacing of 40 cm and 50 cm, there was no significant difference between the varieties on the harvest index while under narrow inter row spacing of 30 cm there was significant difference between varieties. In this experiment, it was generally observed that the response of varieties on harvest index to different inter-row spacing were different. This might be due to the varietal difference which responds differently for inter row spacing that enables them more competitive for resources and in hence more translocation of biological yield to economical yield occurs. In line with this result, Kazemi E et al. reported significant interaction between cultivar×plant densities on harvest index of white bean (Phaseolus vulgaris L.) [67]. In agreement with this result, Crothers SE et al. indicated that harvest index was reduced with increasing plant density of common bean [74]. Similarly, Mekonnen SA (2003) who found that harvest index was reduced with increase in plant density on haricot bean [46].
Summary and Conclusion
Low yield of common bean in Ethiopia is attributed to several production constraints which include lack of seeds of improved varieties for the agro-ecological zones, poor cultural practices such as untimely and inappropriate field operations, use of inappropriate plant density, weed infestation, low soil fertility, moisture stress, diseases and insect pests. Increase in yield of common bean can be ensured, by maintaining appropriate plant population through different planting patterns. In view of this, a field experiment was conducted at Areka, Southern Ethiopia, during ‘Meher’ season from June to August of 2015 to assess the effect of inter and intra row spacing on yield and yield related traits of common bean varieties. The factors studied were two common bean varieties (Hawassa dume and Ibbado), three inter row spacing (30 cm, 40 cm and 50 cm) and three intra row spacing (7 cm, 10 cm and 13 cm) in factorial combination of randomized complete block design with three replications.
The main effect of variety highly significantly (P<0.01) affected days to 50% emergence, 50% flowering , 90% physiological mature, number of total and effective nodules, pods per plant, hundred seed weight and grain yield, while significantly (P<0.05) affected number of primary branches. The highest number of primary branches (2.6), total nodules (29.6), effective nodules (14.9), pods per plant (19.5) and grain yield (2264 kg ha-1) were recorded for variety Hawassa dume and the lowest yield (1714 kg ha-1) was for variety Ibbado, while the highest days to 50% emergence (10.33), 50% flowering (45.74), 90% physiological maturity (78.3) and hundred seed weight (44.07 g) were recorded for variety Ibbado.
The main effect of intra row spacing highly significantly (P<0.01) affected leaf area index, number of seeds per pod, hundred seed weight, above ground dry biomass and grain yield, while significantly (P<0.05) affected leaf area, plant height and number of pods per plant. The highest leaf area index (3.35), plant height (46.07 cm), above ground dry biomass (4463 kg ha-1) and grain yield (2198 kg ha-1) were recorded for intra row spacing of 7 cm, while the lowest for 13 cm. On the other hand, the highest leaf area (1012.8 cm2), number of pods per plant (16.37), number of seeds per pod (4.5) and hundred seed weight (36.48 g) were recorded for intra row spacing of 13 cm, while lowest for 7 cm.
The main effect of inter row spacing highly significantly (P<0.01) affected days to 90% physiological maturity, plant height and number of pods per plant, while significantly (P<0.05) affected hundred seed weight and grain yield. The highest mean days to 90% physiological maturity (77.56 days), plant height (47.2 cm) and grain yield (2125 kg ha-1) were recorded for inter row spacing of 30 cm, while the lowest for 50 cm. On the other hand the highest number of pods per plant (17.49) and hundred seed weight (36.12 g) were obtained for inter row spacing of 50 cm.
Interaction of variety and inter row spacing had highly significant (P<0.01) effect on leaf area and leaf area index. Variety Hawassa dume at inter row spacing of 40 cm had the highest leaf area (1099.9 cm2) which was statistically at parity with spacing of 50 cm for both varieties, while variety Ibbado at inter row spacing of 30 cm had the lowest leaf area (723.8 cm2); and variety Hawassa dume had the highest leaf area index (3.41) and the lowest LAI (2.19) at inter row spacing of 30 cm and 50 cm, respectively.
Interaction of inter and intra row spacing highly significantly (P<0.01) affected number of primary branches, while significantly (P<0.05) affected stand count reduction. The wider inter and intra row spacing combinations of (50 cm×13 cm) showed the highest number of primary branches (4.5), while the lowest number of primary branches (1.5) was for the narrowest combinations of 30 cm×7 cm. The highest stand count reduction (13.1%) was recorded at combinations of 30 cm × 10 cm which was statistically at parity with 30 cm×7 cm (12.3%); whereas the combinations of 50 cm×10 cm, and 50 cm×13 cm resulted in the lowest percent reduction of 5.8% and 5.6%, respectively.
Number of seed per pod was highly significantly (P<0.01) affected by interaction of variety and inter row spacing; where variety Hawassa dume with widest inter row spacing of 50 cm had the highest number of seeds per pod (5.24), while the lowest were recorded for variety Ibbado at all the inter row spacing. Above ground dry biomass was significantly (P<0.05) affected by interaction of variety and inter row spacing where, the highest (4137 kg ha-1) was for variety Hawassa dume and 4533 kg ha-1 for Ibbado at inter row spacing of 30 cm, and the lowest (3806 kg ha-1) for Hawassa dume and 3292 kg ha-1 for variety Ibbado at inter row spacing of 50 cm. Harvest index was significantly affect by the interaction of variety and inter row spacing, the highest harvest index of 39.14% was recorded for variety Ibbado at inter row spacing of 40 cm and it was statistically at parity with spacing of 30 cm, 40 cm and 50 cm for variety Hawassa dume; while variety Ibbado recorded the lowest harvest index (23.91%) at the spacing of 30 cm.
In conclusion, variety and, inter-intra row spacing had a significant influence on the phenology, growth, yield components and yield of common bean. The grain yield was significantly increased as inter and intra row spacing decreased from 50 cm to 30 cm, and 13 cm to 7 cm, respectively. Thus, the closest inter-row spacing of 30 cm and intra-row spacing of 7 cm gave the highest yield irrespective of varieties and can be tentatively recommended for both varieties (Hawassa dume and Ibbado) in the study area. However, as this result was done for one season and location; the experiment has to be repeated over locations and seasons to reach at a more reliable conclusion and recommendation.
References
- Zeka D, Iwarsson M, Fetahu S (2007) Inventory of phenotype diversity of landraces of common bean (Phaseolus vulgaris L) in Kosova for a national gene bank. M.Sc. Thesis, Swedish Biodiversity Center, Uppsala University, Sweden.
- Kay DE (1979) Food legumes. TPI Crops and Product Digest, Tropical Products Institute, UK, pp. 1-435.
- Singh SP (1999) Common bean breeding in the twenty first century. Developments in plant breeding. Springer Publishers, Dordrecht, Boston, London, UK.
- Ferris S, Kaganzi E (2008) Evaluating marketing opportunities for haricot beans in Ethiopia. Improving productivity and market success of Ethiopian farmers. International Livestock Research Institute, Nairobi, Kenya, pp. 1-68.
- Ali K (2006) Food and forage legumes of Ethiopia: progress and prospects. International center for agricultural research in the dry areas, Syria, pp. 351.
- Mulugeta F (2010) Profile of haricot bean production, supply, demand and marketing issues in Ethiopia. Ethiopia Commodity Exchange Authority, Addis Abeba, Africa.
- Tesfaye E (2002) Uptake and response of haricot bean (Phaseolus vulgaris L.) varieties to different levels of phosphorus application to entisoils of Alemaya. M.Sc. Thesis, Alemaya University, Ethiopia, Africa, pp. 1-90.
- CSA (2015) Area and production of major crops private peasant holdings, Meher season (20014/15(2006). Central Statistical Agency, Addis Abeba, Ethiopia, Africa.
- Simane B, Wortmann CS, Hoogenboom G (1998) Haricot bean agroecology in Ethiopia: definition using agroclimatic and crop growth simulation models. Afr Crop Sci J 6: 9-18.
- MoARD (2009) Animal and plant health regulatory directorate. Crop Variety Register, Ministry of Agriculture and Rural Development, Addis Ababa, Ethiopia, pp. 1-78.
- Teshale A, Setegn G, Berhanu A, Kassaye N, Kidane T (2008) Experiences in common bean research, Ethiopia Institute of Agricultural Research, Addis Ababa, Ethiopia.
- Ihsanullah, Jan A, Taj FH, Khan IA, Khan N (2002) Effect of sowing dates on yield and yield components of mashbean varieties. Asian J Plant Sci 1: 622-624.
- Orcutt DM, Nilsen ET (2000) The physiology of plants under stress: soil and biotic factors. John Wiley and Sons, Inc., USA, pp. 1-683.
- Matthews PW, Armstrong EL, Lisle CJ, Menz ID, Shephard PL, et al. (2008) The effect of faba bean plant population on yield, seed quality and plant architecture under irrigation in southern NSW. In: Unkovich MJ (Ed.), Global issues, paddock action -Proceedings of the 14th Australian Society of Agronomy Conference, Australian Society of Agronomy.
- Anderson WK, Sharma DL, Shackley BJ, D’Antuono MF (2004) Rainfall, sowing time, soil type and cultivar influence optimum plant population for wheat in Western Australia. Aust Agric Res J 55: 921-930.
- Hussain M, Mehmood Z, Khan MB, Farooq S, Lee DJ, et al. (2012) Narrow row spacing ensures higher productivity of low tillering wheat cultivars. Int J Agric Biol 14: 413-418.
- MoA (2014) Plant variety release, protection and seed quality control diroctorate. Crop Variety Register, Ministry of Agriculture, Addis Ababa, Ethiopia, pp. 1-103.
- Workineh E, Tesfaye K (2007) Comparison of the growth, photosynthesis and transpiration of improved and local varieties of common bean (Phaseolus vulgaris L.) at Haramaya. M.Sc. Thesis, Haramaya University, Ethiopia, Africa, pp. 1-52.
- Melaku B (2012) Response of Common Bean (Phaseolus vulgaris L.) cultivars with different growth habits to plant density at Haramaya, Eastern Ethiopia. M.Sc. Thesis, Haramaya University, Haramaya, Ethiopia, Africa, pp. 1-68.
- Mulatu E, Zeleke A, Bechere E (1997) Research and development strategy in Ethiopia; progress and prospects on food and forage legume. Proceeding of the Workshop, 22-26 September 2003, Addis Ababa, Ethiopia, Africa.
- Davis JH (1997) Phaseolus beans. In: Wien H (Ed.), Physiology of vegetable crops. CAB International, UK, pp. 409-428.
- Seyum EG (2014) Influence of plant spacing and date of sowing on yield and yield components of two snap bean (Phaseolus vulgaris L.) varieties in Jimma, Southwestern Ethiopia. Merit Res J Agric Sci Soil Sci 2: 86-95.
- Blackshaw RE, Muendel HH, Saindon G (1999) Canopy architecture, row spacing and plant density effects on yield of dry bean (Phaseolus vulgaris) in the absence and presence of hairy nightshade (Solanum sarrachoides). Can J Plant Sci 79: 663-669.
- Sam-Aggrey GW, Haile Y, Assefa T (1987) Review of green bean research in Ethiopia and proposals for future research and development direction.
- Ayalew A (2011) The influence of applying lime and NPK fertilizers on yield of maize and soil properties on acid soil of Areka, Southern region of Ethiopia. Innov Syst Des Eng 2: 7.
- Esayas A (2003) Soils of Areka agricultural research center. Technical Paper No.77, Ethiopian Agricultural Research Organization, Addis Ababa, Ethiopia, Africa.
- GenStat (2012) GenStat procedure library release (15thedn). VSN International Ltd.
- Gomez KA, Gomez AA (1984) Statistical procedures for agricultural research (2ndedn). An International Rice Research Institute (IRRI), John Wiley and Sons, Inc., New York, USA, pp. 1-657.
- Dragun J (1988) The soil chemistry of hazardous materials (2ndedn). Amehurst Scientifc Publishers, Massachusetts, USA, pp. 1-458.
- Hazelton PA, Murphy BW (2007) Interpreting soil test results: what do all the numbers mean? CSIRO Publishing, Australia, pp. 1-152.
- Bruce RC, Rayment GE (1982) Analytical methods and interpretations used by Agricultural Chemistry Branch for soil and land use surveys. Queensland, USA, pp. 1-10.
- Landon JR (1991) Booker tropical soil manual: a handbook for soil survey and agricultural land evaluation in the tropics and subtropics. Longman Scientific and Technical, New York, USA, pp. 1-474.
- Li PH, Davies DW, Shen ZY (1991) High-temperature-acclimation potential of the common bean: can it be used as a selection criterion for improving crop performance in high-temperature environments? Field Crops Res 27: 241-256.
- Austin RB, Maclean MS (1972) A method for screening Phaseolus genotypes for tolerance to low temperatures. J Hortic Sci 47: 279-290.
- Al-Rifaee M, Turk MA, Tawaha AR (2004) Effect of seed size and plant population density on yield and yield components of local faba bean (Vicia faba L. Major). Int J Agri Biol 6: 294-299.
- Tripathi S, Sridhar V, Jukanti AK, Suresh K, Rao BV, et al. (2012) Genetic variability and inter-relationships of phenological, physicochemical and cooking quality traits in chickpea. Plant Genet Resour 10: 194-201.
- CIAT (1975) Annual Report Cali. Centro Intemacional de Agricultura Tropical, Colombia, USA, pp. 14-24.
- Lima ER, Santiago AS, Araújo AP, Teixeira MG (2005) Effects of the size of sown seed on growth and yield of common bean cultivars of different seed sizes. Braz J Plant Physiol 17: 273-281.
- Woku W (2005) Evaluation of common bean (Phaseolus vulgaris L.) varieties intercropped with maize (Zea mays L.) for double cropping at Alemaya and Hirna areas, Eastern Ethiopia. M.Sc. Thesis, Haramaya University, Haramaya, Ethiopia.
- Holshouser DL, Whittaker JP (2002) Plant population and row-spacing effects on early soybean production systems in Mid-Atlantic USA. Agron J 94: 603-611.
- Mebrat S, Tana T (2013) Response of kabuli chickpea (Cicer arietinum L.) varieties to plant spacing at debre zeit, Central Ethiopia. M.Sc. Thesis, Haramaya University, Haramaya, Ethiopia. pp. 43.
- Mehmet OZ (2008) Nitrogen rate and plant population effects on yield and yield components in soybean. Afr J Biotechnol 7: 4464-4470.
- Mekonnen SA (2012) Irrigation frequency and plant density affect phenology and crop growth of haricot bean (Phaseolus vulgaris L.). Afr J Plant Sci Biotechnol 6: 34-39.
- Kueneman EA (1978) Evaluation of the yield potential of growth habits of dry beans (Phaseolus vulgaris L.) and determination of plant types for high density plantings. Ph.D. Thesis, Cornell University, Ithaca, USA, pp. 1-442.
- Board JE, Harville BG (1992) Explanation for greater light interception in narrow- vs. wilde-row soybean. Crop Sci 32: 198-202.
- Mekonnen SA (2003) Effects of irrigation frequency and plant population density on growth, yield components and yield of haricot bean (Phaseolus vulgaris L.) in dire Dawa area. M.Sc. Thesis, Haramaya University, Haramaya, Ethiopia.
- Idris AL (2008) Effect of seed size and plant spacing on yield and yield components of faba bean (Vicia faba L.). Res J Agric Biol Sci 4: 146-148.
- El-Naim AM, Jabereldar AA (2010) Effect of plant density and cultivar on growth and yield of cowpea (Vigna unguiculata L. Walp). Aust J Basic Appl Sci 4: 3148-3153.
- White LW, Laing DR (1989) Photoperiod response of flowering in diverse genotypes of common beans (Phaseolus vulgaris L.). Field Crops Res 22: 113-128.
- Tuarira M, Moses M (2014) Effects of plant density and planting arrangement in green bean (Phaseolus vulgaris L.) seed production. J Glob Innov Agric Soc Sci 2: 152-157.
- Amany MA (2014) Response of faba bean (Vicia faba L.) to different planting densities and bio-mineral fertilization systems. Am-Eurasian J Agric Environ Sci 14: 541-545.
- Wells R, Burton JW, Kilen TC (1993) Soybean growth and light interception response to differing leaf and stem morphology. Crop Sci 33: 520-528.
- Caliskan S, Arslan M, Uremis I, Caliskan ME (2007) The effect of row spacing on yield and yield components of full season and double-cropped soybean. Turk J Agric Forum 31: 147-154.
- Selim MM, El-Seessy MA (1991) Productivity of faba bean as effected by plant population, phosphorus fertilization and sowing methods. Egypt J Agron 16: 239-251.
- Khalil SK, Wahab A, Rehman A, Muhammad F, Wahab S, et al. (2010) Density and planting date influence phenological development assimilate partitioning and dry matter production of faba bean. Pak J Bot 42: 3831-3838.
- Thalji T (2010) Effect of plant density on seed yield and agronomic characters of faba bean (Vicia faba L.) under greenhouse conditions. Bios Res 7: 22-25.
- Salema MP (1987) Variation in nodulation, nitrogen fixation and yield in various bean (Phaseolus vulgaris L.) genotypes. In Salema MP, Minjas AN (Eds) Proceedings of the Sixth Bean Research Workshop held at Sokoine University of Agriculture, Morogoro, Tanzania, Africa.
- Nyemba RE, Munyinda K, Tembo H, Mwale M, Sakala, G (1989) Evaluating biological nitrogen fixation of bean in Zambia. In Smithson LB (Ed.), Proceedings of the first SADC regional bean research workshop. CIAT Series No. 6, Mbabane, Swaziland, Africa, pp. 7-14.
- Njoka EM, Muraya MM, Okumu M (2005) The influences of plant density on yield and yield components of common beans (Phaseolus vulgaris L.). Agricultura Tropica et Subtropica 38: 22-29.
- Abubaker S (2008) Effect of plant density on flowering date, yield and quality attribute of bush beans (Phaseolus vulgaris L.) under center pivot irrigation system Am J Agric Biol Sci 3: 666-668.
- Chandhla J (2005) Optimisation of dry bean (Phaseolus Vulgaris L.) seed production under greenhouse conditions. MSc Thesis, Submitted to University of Pretoria, Pretoria, South Africa, pp. 1-61.
- Bakry BA, Elewa TA, El Karamany MF, Zeidan MS, Tawfik MM (2011) Effect of row spacing on yield and its components of some faba bean varieties under newly reclaimed sandy soil condition. World J Agric Sci 7: 68-72.
- Singh SP, Singh NP, Pandey RK (1992) Performance of faba bean varieties at different plant densities. FABIS Newsl 30: 29-31.