
Research Article
Yield Response of Common Bean (Phaseolus vulgaris L.) Varieties to Combined Application of Nitrogen and Phosphorus Fertilizers at Mechara, Eastern Ethiopia
Wondwosen Wondimu1* and Tamado Tana2
- 1Department of Plant Science, Mizan-Tepi University, College of Agriculture and Natural Resources, Ethiopia, Africa
- 2School of Plant Science, College of Agriculture, Haramaya University, Ethiopia, Africa
*Address for Correspondence: Wondwosen Wondimu, Department of Plant Science, Mizan-Tepi University, College of Agriculture and Natural Resources, P.O Box 260, Mizan Teferi, Ethiopia, Africa, E-mail: wondu770@gmail.com
Citation:Wondimu W, Tana T. Yield Response of Common Bean (Phaseolus vulgaris L.) Varieties to Combined Application of Nitrogen and PhosphorusFertilizers at Mechara, Eastern Ethiopia. J Plant Biol Soil Health. 2017;4(2): 7.
Copyright: © 2017 Wondimu W, et al. This is an open access article distributed under the Creative Commons Attribution License, which permits unrestricted use, distribution, and reproduction in any medium, provided the original work is properly cited.
Journal of Plant Biology & Soil Health | ISSN: 2331-8996 | Volume: 4, Issue: 2
Submission: 22 June, 2017 | Accepted: 24 July, 2017 | Published: 31 July, 2017
Keywords
Common bean varieties; Nitrogen; Phosphorus; Rates; Nodulation
Abstract
A field experiment was conducted in 2012 cropping season to determine the optimum rates of nitrogen and phosphorus fertilizers for maximum yield of common bean and to select the best combination of varieties and fertilizer levels for optimum yield on nitisols at Mechara research station. The treatment consists of four common bean varieties (Awash Melka, Awash 1, Chercher and Red Wolayita) and five combined nitrogen and phosphorus rates [0,0; 9,23; 18,46; 27,69; and 36,92 kg N and P2O5/ha) laid out in randomized complete block design with three replications. The main effect of common bean varieties and NP rates were significant (P<0.05) on days to 50% flowering, 90% physiological maturity, number of pods per plant, seeds per pod and hundred-seed weight. Similarly, the interaction effect of variety and NP rate was significant (P<0.05) on days to 50% emergence, number of nodules, and grain yield, biological yield, and harvest index, nitrogen and phosphorus concentration of shoot tissue. Accordingly, variety Awash Melka with the application of 27 kg N: 69 kg P2O5 ha-1 gave the highest value for grain yield (3127 kg ha-1), biological yield (7446 kg ha-1). The highest number of seeds per pod (4.60) and the highest nitrogen content (3.89%) of the shoot tissue also recorded from Awash Melka and application of 27 kg N: 69 kg P2O5 ha-1. Whereas, the lowest grain yield (574 kg ha-1) was recorded for variety Awash 1 in response to no fertilizer application. Thus variety Awash Melka with the application of 27 kg N: 69 kg P2O5 ha-1 was found to be the best combination under Mechara’s agro-ecology as it gave higher values for yield and most of yield related traits.
Introduction
Common bean is the most important pulse crops grown in central, southern, eastern and western lowland and mid altitudes of Ethiopia. Besides, its use as a readily available source of protein for farmers, it is also an important cash crop and export commodity that generate foreign exchange for the country [1]. It is also the major staple food supplementing the protein source for the poor farmers who cannot afford to buy expensive meat. Common bean is high in starch 49%, protein 21.4% and dietary fiber 22.9% and is also a good source of minerals and vitamins including iron, potassium, selenium, molybdenum, thiamine, vitamin B6, and folic acid [2].
The national total area of common bean production is estimated at 331,708.15 ha of land and from which about 387,802.301 tons was produced per annum. According to this report, the current national average yield of common bean is 1.77 tons ha-1. However, this yield is far less than the attainable yield (2.5-3.6 tons ha-1) under good management conditions [3].
Low phosphorus and nitrogen in the soil often limits production of common bean [4]. Thus addition of inorganic fertilizer primary nitrogen and phosphorus to satisfy nutrient demand of the crop is crucial. In addition, determining the optimum rates for higher yield is economically profitable, socially acceptable and environmentally sustainable. Hence this research aims to quantify nitrogen and phosphorus fertilizer to be applied under Mechara condition and similar agro ecologies. Therefore, this experiment was conducted with the objectives to determine the optimum rates of nitrogen and phosphorus fertilizers for maximum yield of common bean and to select the best combination of common bean varieties and NP levels for optimum yield on nitisols of Mechara.
Materials and Methods
Description of the study site
Geographical description: The field experiment was conducted at Mechara Agricultural Research Center (McARC) in Darolebu District during the 2011-2012 main cropping season. Mechara is situated in West Hararghe zone of Oromiya Regional State in eastern part of Ethiopia at 434 km east of Addis Ababa and 110 km distance from Chiro town. Geographically it is located at 08°36" N latitude and 40°19" N E longitude with an altitude of 1773 meters above sea level.
Soil types and its physic-chemical characteristics: The type of soil on which the field experiment conducted was Nitosols. It consists of 61.36% sand, 21% silt and 17.64% clay. Hence, the soil is sandy loam in texture with a pH value of 6.16. The soil had an organic matter content 3.73% (which is high), total nitrogen 0.18% (moderate) and available phosphorus 6.43 mg/kg (low). The value of exchangeable potassium was 0.34 meq/100 g soil which was medium and cation exchange capacity 28.985 cmol/kg which was considered moderate.
Rain fall amount and distribution: The site has a bimodal rainfall distribution and is representative of a mid-altitude agro climatic zone. It receives a total of 1294 mm annual rainfall with a mean minimum, maximum, and average temperature of 18.1, 33.1 and 25.6 °C, respectively. A total 593.3 mm of rainfall was recorded during the experimental period. This amount is in the range of 350 to 700 mm which was considered as suitable rainfall for common bean production.
Treatments and experimental design
The trial consisted of five levels of combined NP fertilizers (0 Kg N: 0 Kg P2O5, 9 kg N: 23 kg P2O5, 18 kg N: 46 kg P2O5, 27 kg N: 69 kg P2O5 and 36 kg N: 92 kg P2O5 ha-1), varieties (Awash 1, Awash Melka, Red Wolayita and Chercher) laid out in randomized complete block design (RCBD) in factorial arrangement with three replications. The gross plot size was 3 m x 2.4 m (7.2 m2) with spacing of 40 cm between rows and 10 cm between plants to give a final population density of 250,000 plants ha-1. Each plot had 6 rows of plants from which the central four rows (4.48 m2) were used for data collection.
Data collection and analysis
Soil sampling and plant analysis: Pre-planting soil samples (0-30 cm depth) were collected from nine spots diagonally and composited based on the procedure outline by Sertsu S et al. [5]. Then the soil samples were air dried at room temperature under shade by spreading on plastic sheet. The dried samples were crushed with mortar and pestle to pass through a 2 mm sieve and then packed in a polythene bag, labeled and stored in the laboratory for analysis. Soil laboratory analysis was conducted in Haramaya University soil laboratory to determine different physical and chemical properties. The physio-chemical characteristics were determined using their respective methods. Composite soil sample was analyzed for soil texture, pH, organic matter (OM), total nitrogen (TN), available phosphorus (AP), cation exchange capacity (CEC) and exchangeable potassium (EK).
Five plants were randomly sampled from the net plot just before flowering. Eighty fully grown leaves were taken from each plot. The samples were oven dried to a constant weight, grounded to pass through a 0.5 mm sieve. Total nitrogen in plant tissue was estimated by Kjeldhal digestion, distillation and titration method [6]. Similarly, phosphorus was estimated by wet digestion with a mixture of nitric acid (HNO3) and perchloric acid (HClO4). The available phosphorus was determined by the vanadomolybdate yellow color using spectrophotometer at 460 nm as described by Sertsu S et al. [5].
Crop phonology, growth parameters, yield and yield components: Days to 50% emergence, days to 50% flowering, 90% physiological maturity was recorded as the number of days from planting to 90% of the plants reached physiological maturity. Leaf area, index was calculated as the ratio of the total green foliage area per plant to area allocated to each plant. Number of nodules per plant was determined by carefully uprooting the whole plant using spade so as to obtain intact roots and nodules. Total number of nodules per plant and effective nodules were determined as described by Dadson RB et al. [7]. Size and color was used to identify effective nodules. Hence, those nodules with large size and pink color are considered as effective nodules.
Number of pods per plant, number of seeds per pod was recorded from ten randomly sampled plants and pods, respectively from the net plot at harvest. Total biomass yield per net plot was recorded and converted to kg ha-1. Grain yield per plot was determined from the whole harvestable rows of the net plot and converted to kg ha-1 after adjustment, to 10% moisture content by using moisture tester. Hundred seed weight was recorded by counting hundred seeds from a bulk of threshed seeds and weighed using a sensitive balance and the weight was adjusting to 10% moisture. Harvest index was calculated as the ratio of grain yield to above ground dry biomass per plot and multiplied by 100 for the respective treatments phenology.
Statistical data analysis
Data were subjected to the analysis of variance (ANOVA) phenology using (SAS Version 9) statistical software. Mean separation was done by least significant difference test (LSD) at 5% probability levels.
Results and Discussion
Growth and crop differences in leaf area and leaf area index among the varieties
There was highly significant (P<0.01) difference in days to 50% flowering among the varieties (Appendix Table 1). Early flowering in 39 days was recorded for variety Red Wolayita that flowered ten days earlier than variety Chercher (Table 1). Similarly, effect of NP rates on days to 50% flowering was highly significant (P<0.01) (Appendix Table 1).
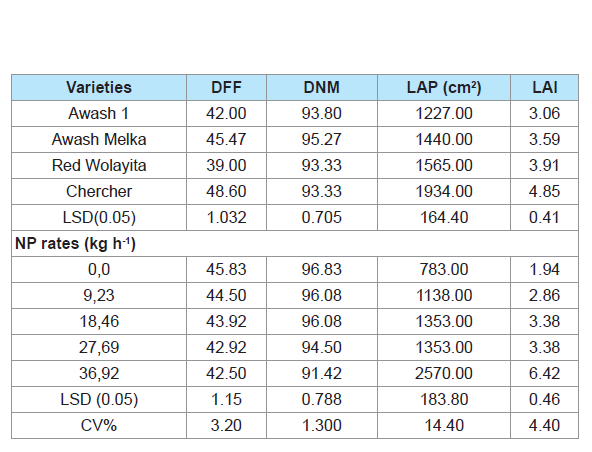
The result also revealed that increasing NP application from 0 kg N, 0 kg P2O5 ha-1 to 36 kg N, 92 kg P2O5 ha-1 shortened the time required to attain 50% flowering. Early flowering (42.50 days) was recorded for the application of 36 kg N, 92 kg P2O5 ha-1 which was three days earlier than the control (Table 1). This variation may be due to stimulatory effect of phosphorus on growth hormones, induce early flowering in haricot bean.
Common bean varieties showed highly significant (P<0.01) difference on days to 90% physiological maturity (Appendix Table 1). Variety Red Wolayita was the earliest (93.33 days) to 90% physiological maturity while Awash Melka was the late maturing variety (95.27 days) (Table 1). These variations in their days to 90% physiological maturity could be attributed to genotypic differences.
Days to 90% physiological maturity was highly significant (P<0.01) (Appendix Table 1). Increasing NP rates from 0 kg N, 0 kg P2O5 to 36 kg N, 92 kg P2O5 ha-1 shortened physiological maturity from 1 to 5 days. This might had been due to the effect of phosphorus and nitrogen on cell division and flowering. This finding was in agreement with Boutraa T, who reported that number of days required to 90% physiological maturity of common bean was decreased significantly from 70, 68 to 67 days, due to increased phosphorus fertilization from 25, 50 to 75 kg P2O5 ha-1 [8].
Leaf area and leaf area index
There was highly significant (P<0.01) (Appendix Table 1). Variety Chercher had the highest (1934 cm2 and 4.851) followed by Red Wolayita (1565 cm2 and 3.91) difference in leaf area and leaf area index among common bean varieties, respectively. While Awash 1 had lowest (1227 cm2 and 3.063) leaf area and leaf area index respectively (Table 1).
The effect of NP rates on leaf area and leaf area index was also highly significant (P<0.01) (Appendix Table 1). There was increase in leaf area and leaf area index with increased rates of NP application from 0 kg N, 0 kg P2O5 to 36 kg N, 92 kg P2O5 ha-1 among the varieties. The highest leaf area (2570 cm2) and leaf area index (6.421) was recorded for the application of 36 kg N, 92 kg P2O5 ha-1 while the lowest leaf area (783 cm2) and leaf area index (1.944) was recorded at no fertilizer plot (Table 1).
Thus, increased leaf area and leaf area index with increasing rates of NP application might have been due to the positive effect of NP on branches formation, leaf expansion and canopy development. This finding was inline with Shubhashree KS et al. who reported significant improvement in leaf area of haricot bean (P. vulgaris L) [9].
Number of nodules per plant
There was highly significant (P<0.01) difference in number of effective nodules due to the interaction effect of variety and NP rates (Appendix Table 1). Accordingly, variety Chercher with 36 kg N, 92 kg P2O5 ha-1 had the highest (231) number of effective nodules while Awash Melka at no fertilizer had the lowest (19.50) number of effective nodules per plant (Table 2). This could be due to the importance of nitrogen to initiating nodulation and the effect of phosphorus for better root development and nitrogen fixation in common bean. Numbers of effective increased significantly with increased rates of NP fertilizer from 0 kg N, 0 kg P2O5 ha-1 to 27 kg N, 69 kg P2O5 ha-1 for variety Awash 1, Chercher and Red wolayita. 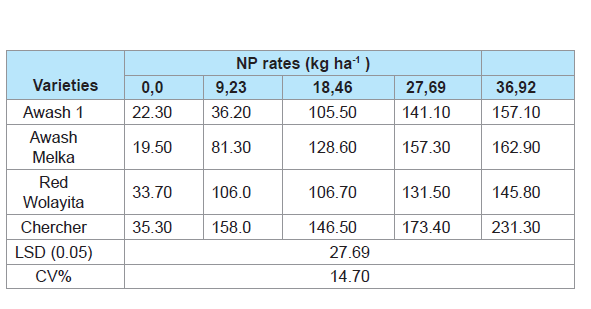
Yield components and yield
Number of pods per plant and number of seeds per pod: The analysis of variance showed highly significant (P<0.01) difference among haricot bean varieties on number of pods per plant (Appendix Table 2). Accordingly, the highest (26.90) number of pods per plant was recorded for variety Chercher, while the lowest (20.26) was obtained for variety Red Wolayita (Table 3). Except for variety Chercher, statistically there were no significant (P<0.05) differences among varieties Awash 1, Awash Melka and Red Wolayita on number of pods per plant. Similarly highly significant (P<0.01) difference was recorded due to the application of different levels of combined NP fertilizer (Appendix Table 2) [10].
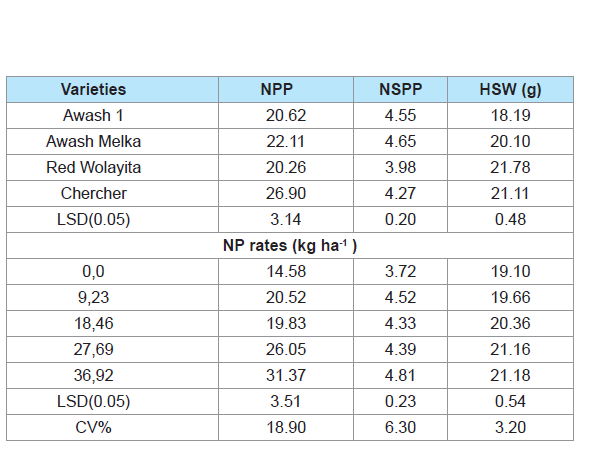
There was increase number of pods per plant with increased levels of NP fertilization from 0 kg N; 0 kg P2O5 to 36 kg N; 92 kg P2O5 ha-1 (Table 3). Hence the highest number (31.37) of pods per plant was recorded from the application of 36 kg N; 92 kg P2O5 ha-1 whereas, the lowest (14.58) pods per plant was observed from the no fertilizer plot. This highest number of pods at the highest rates of NP might be attributed by the fact that NP enhance promote the formation of branches and canopy development and pod setting in common beans. This result was in line with previous study by [11] who reported that the application of different levels of nitrogen and phosphorus significantly affected number of pods per plant in common bean. Shubhashree KS et al. also reported that number of pods per plant in common beans showed significantly linear increase with increasing levels NP fertilization [9].
The number of seeds per pod showed highly significant (P<0.01) differences among the varieties (Appendix Table 2). Accordingly, variety Awash Melka had the highest number (4.65) of seed per pod and Red Wolayita was found to be the lowest number (3.98) of seeds per pod (Table 3). This could be due to genotypic difference of the varieties. Number of seed per pod was also highly significantly (P<0.01) affected by different rate of NP application (Appendix Table 1).
Hence, the highest (4.81) number of seeds per pod was recorded from the application of 36 kg N: 92 kg P2O5 ha-1. While the lowest (3.72) number of seeds per pod was obtained at no fertilizer plot (Table 3). This variation might be, due to the effect of NP on physiological processes (increase leaf area and improve root growth and development) and the conversion of dry matter produced into fruit and seeds. This result was in agreement with Woldesellasie T et al. who reported that number of seeds per pod on common bean differed significantly due to NP application while significantly higher number of seeds (4.07) was obtained with 120 kg N ha-1 as compared to 40 kg N ha-1 (3.08 per pod) [13].
Hundred seed weight
Highly significant (P<0.01) difference in hundred seed weight was recorded among the varieties (Appendix Table 2). The highest hundred seed weight (21.78 g) was recorded for variety Red Wolayita whereas the lowest value of hundred seed weight (18.19 g) was obtained for variety Awash 1 (Table 3). This variation might be attributed by genotypic difference of the varieties.
Hundred seed weight was highly significant at (P<0.01) (Appendix Table 2). The highest (21.18) and the lowest (19.10) of hundred seed weight was recorded from the application of 36 kg N: 92 kg P2O5 ha-1 and no fertilized plot, respectively (Table 3). In this regard, application of NP from 0 kg N: 0 kg P2O5 ha-1 to 36 kg N: 92 kg P2O5 ha-1 had showed increased hundred seed weight. This result is in line with Olofintoye TJ who reported increased hundred seed weight might be due to the influence of phosphorus on cell division, phosphorus content in the seeds and the formation of fat in the seed of haricot bean [14]. But, hundred seed weight was not influenced by the interaction effect of common bean varieties and rates of combined NP application.
Grain yield
The analysis of variance indicated highly significant (P<0.01) differences on grain yield among the varieties, due to the application of NP and their interactions (Appendix Table 2). The highest grain yield (3127.00 kg ha-1) was obtained from the interaction of variety Awash Melka with 27 kg N: 69 kg P2O5 ha-1 followed by variety Awash Melka (3102.00 kg ha-1) with 36 kg N, 92 kg P2O5 ha-1 and variety Red Wolayita (2600.00 kg ha-1) at the rate of 36 kg N: 92 kg P2O5 ha-1 (Table 4). The lowest grain yield (574.00 kg ha-1) was recorded for variety Awash 1 at no fertilizer.
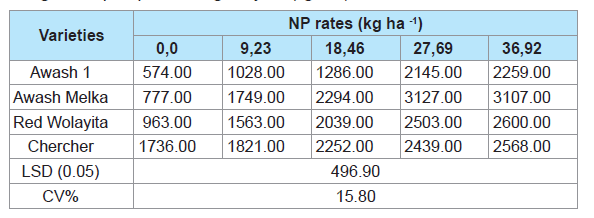
There were no significant differences in grain yield between 27 kg N: 69 kg P2O5 ha-1 and 36 kg N, 92 kg P2O5 ha-1 for all varieties which means application of NP beyond 27 kg N: 69 kg P2O5 ha-1 did not increase grain yield of common bean (Table 4). This indicates application of 27 N, 69 kg P2O5 ha-1 was optimum for maximum yield of common bean for Mechara and similar conditions. The average yield of no fertilizer plots 938.00 kg ha-1 was lower than the national average yield (1437 kg ha-1) of common bean in the country [3]. This could be due to poor fertility status of the soil. Poor nodulation and poor plant vigor have been observed in beans grown in soils low in extractable NP. Hence, increased phosphorus fertilization increases yield of common bean and cause optimum nodulation early during bean growth. Therefore, it is indispensible to use mineral fertilizers basically NP in common bean for sustainable production and to get optimum yield of the crop. Similarly, Singh Y et al. also recorded significantly higher grain yield (1917 kg ha-1) of (Phaseolus vulgaris L.) with 80 kg N ha-1 application [4].
Harvest index
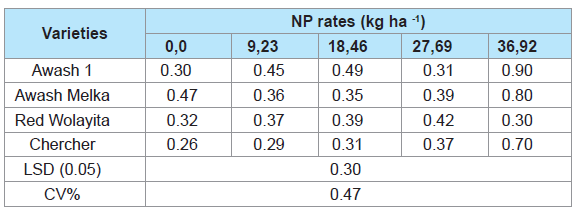
Analysis of variance revealed the presence of significant (P<0.05) differences with respect to harvest index among the varieties, rates of NP application and the interaction effect of common bean varieties and NP rates (Appendix Table 2).
The highest harvest index (0.49) was obtained for variety Awash 1 with the application of 18 kg N: 46 kg P2O5 ha-1 whereas the lowest harvest index (0.26) was recorded for variety Chercher with no fertilizer (Table 5). This could be due to poor growth and development of the varieties in unfertilized plots as a result of poor soil fertility. The result of this study was in agreement with Fageria NK who reported significant improvement in harvest index due to nitrogen application up to 50 kg ha-1 [15].
Plant tissue analysis
The interaction effect of common bean varieties and rates of nitrogen and phosphorus application showed highly significant (P<0.01) difference on nitrogen and phosphorus content of the shoot tissues (Appendix Table 2). Accordingly, the highest value of nitrogen in the leaf (3.89%) was recorded for the interaction of variety Awash Melka with the application of 36 kg N, 92 kg P2O5 ha-1 followed by variety Chercher (3.51%) with the application of 36 kg N, 92 kg P2O5 ha-1 while the highest value of phosphorus in the shoot tissue was recorded for variety Awash 1 (1.22 %) with the application of 36 kg N, 92 kg P2O5 ha-1 followed by variety Awash Melka (1.15%) for the same nitrogen and phosphorus application (Tables 6 and 7). This variation might be attributed by the genetic characteristics of the varieties in terms of response to the applied levels of nitrogen and phosphorus fertilizer.
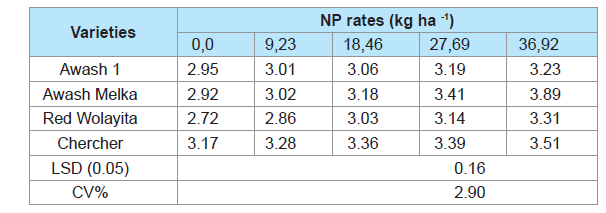
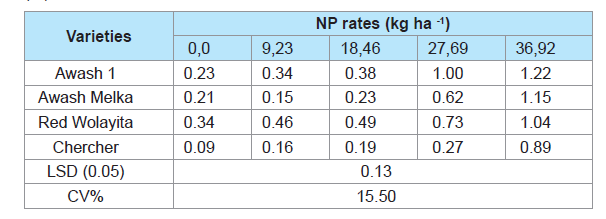
The phosphorus status of the experimental soil is expected to encourage a positive response to the applied rates of NP fertilizer. Therefore the highest concentration of phosphorus (1.22%) in the shoot tissue with the highest rate of phosphorus and nitrogen application 36 kg N, 92 kg P2O5 ha-1 might be due to low available phosphorus in the soil at the experimental site (6.43 mg/kg) as well as pH (6.16) which is suitable for nutrient adsorption particularly phosphorus since fixation is high below and above the pH ranges of 6.0-7.50. The minimum values of nitrogen (2.72%) and phosphorus (0.09%) contents in the shoot tissue were recorded for variety Red Wolayita and for variety Chercher, respectively from no fertilizer plots (Tables 6 and 7). This could be due to genotypic differences of the respective varieties and the presence of insufficient amount of the available nitrogen and phosphorus in the soil solution of the experimental field.
Increasing rates of phosphorus steadily enhanced the phosphorus concentration in the tissue and increasing nitrogen rate led to increased nitrogen concentration in common bean leaves. This could be due to the fact that higher rates of applied nitrogen and phosphorus increased the concentration of nitrogen and phosphorus elements in the soil solution, which in turn may have improved plant growth and development thereby increasing nutrient uptake by the plants, with subsequent increase in the amount of nutrient concentration in the leaf [15].
The result of this study is in agreement with the finding of Amare et al. who reported that the differences among crop varieties in their ability to absorb phosphorus from soils may be due to at least three distinct root attributes; the physiological activity to absorb P from dilute solution; metabolic activity resulting in solubilization of absorbed P; and the ability of the root system to explore the soil phosphorus [16].
The study visualized that uptake of both the nutrients increased significantly with increase in phosphorus levels up to 26.4 kg ha-1. Higher uptake of phosphorus (108.9 kg ha-1) at higher levels of phosphorus fertilization (100 kg P2O5 ha-1). Mean nitrogen and phosphorus uptake values were 75.53 and 24.44 kg ha-1, respectively.
Concentration of phosphorus in plant leaves showed similar response like that recorded for nitrogen concentration. The increase in phosphorus content in common bean shoot tissue due to phosphorus nutrition compared to the control is associated with greater and extensive root system developed by common bean, leading to a greater soil volume exploited. A larger root system provides greater root-soil contact and thereby higher uptake of soluble phosphorus in the surrounding area of the roots and such larger contact is especially important for uptake of low mobility nutrients such as phosphorus and increase the concentration in the shoot tissue [15].
The critical concentration of a nutrient in plant tissues is the concentration of the nutrient in a particular plant part usually a mature leaf sampled at a given growth stage (usually just before flowering) below which plant growth and yield are suppressed by up to 20% [15]. Critical concentrations of nitrogen and phosphorus in the dry matter of leaf of common bean sampled just before flowering generally amount to 3.0% and 0.3%, respectively [13]. Concentration of phosphorus which is as high as 1% in shoot dry matter may become toxic to the plants. The results of this experiment showed that the common bean plants had above critical concentrations of nitrogen in the shoot dry matter for all treatments when supplied with 27 kg N and 69 kg P2O5 per hectare. Similarly, the concentrations of phosphorus remained above the critical level for all treatments when the plants were supplied with 27 kg N and 69 kg P2O5 per hectare. These results may explain the optimum grain yield of the common bean plants at the above mentioned rates of combined nitrogen and phosphorus application, above which no significant increases in grain yield were detected. This shows that at least 80% of the potential yield of the bean crop was obtained at these levels of the nutrients. Above these levels of fertilizers, toxicity effects of phosphorus as well as lodging effect of nitrogen are likely to occur [17].
Conclusion
Sustaining soil and soil fertility in intensive cropping systems for higher yields and better quality can be achieved through higher levels of fertilizer application. Thus, information on fertility status of the soils and crop response to different soil fertility management is very important to come up with profitable and sustainable crop production. In line with this, research was undertaken to investigate the effect of nitrogen and phosphorus rates, (0:0, 9:23, 18:46, 27:69 and 36 kg N: 92 kg P2O5 ha-1) on yield and yield components of four common bean (Pharsalus vulgaris L) varieties, (Awash 1, Awash Melka, Red Wolayita, Chercher) on nitisols at the research field of Mechara Agricultural Research Center during the 2011/12 cropping season (Table 8).

The interaction effect of common bean varieties and rates of nitrogen and phosphorus showed significant (P<0.05) differences on, number of effective nodules, number of non-effective nodules and total number of nodules, stand count at harvest, biological yield, grain yield, shoot tissue nitrogen and phosphorus concentration. Accordingly, the highest number of effective nodules (231.30) was recorded for variety Chercher with the rate of 36 kg N: 92 kg P2O5 ha-1. The highest number of non-effective nodules (93.20) and total number of nodules (292.8) were recorded for variety Red Wolayita and for variety Chercher with the application of 27 kg N: 69 kg P2O5 ha-1 and 36 kg N: 92 kg P2O5 ha-1, respectively. While, the lowest number of effective nodules (19.50), number of non-effective nodules (12.30) and total number of nodules (31.80) recorded for variety Awash Melka at no fertilizer. The highest biological yield (8068 kg ha-1) and grain yield (3127 kg ha-1) was recorded for variety Awash Melka with the application of 36 kg N: 92 kgP2O5 ha-1 and 27 kg N: 69 kg P2O5 ha-1, respectively while the lowest biological yield (1922 kg ha-1) and grain yield (574 kg ha-1) was recorded for Awash 1 at no fertilizer. Similarly the highest harvest index (0.49) and stand count at harvest (101.00) were recorded for variety Awash 1 with application of 18 kg N: 46 kg P2O5 ha-1 and Red Wolayita 9 kg N: 23 kg P2O5 ha-1, respectively. Whereas the lowest harvest index (0.26) and stands (56) was recorded for variety Chercher and Awash 1 at no fertilizer (Table 9).

A significant difference in shoot tissue NP content of the leaves was observed due to the main effect of varieties, NP rates and their interactions. Accordingly, the highest nitrogen content in the leaf tissue (3.89%) was recorded for variety Awash Melka with the application of 36 kg N, 92 kg P2O5 ha-1. Similarly the highest phosphorus content in the tissue (1.22%) was recorded for variety Awash 1 with the application of 36 kg N, 92 kg P2O5 ha-1. Thus, results from this experiment clearly demonstrate that the common bean varieties have different performance on Nitisols of Mechara. Accordingly, Awash Melka with the rate of 27 kg N, 69 kg P2O5 ha-1 (150 DAP ha-1) was found to be the best combination under Mechara’s agro ecology owing to its higher biological yield (7446 kg ha-1), highest grain yield (3127 kg ha-1), harvest index (0.39), tissue nitrogen and phosphorus contents 3.88% and 0.62% respectively. In addition, variety Awash Melka also highly preferred for export market.
The results also demonstrated no significant increase in growth and phonological characters as well as yield attribute with increased rates of NP fertilizers above 27 kg N: 69 kg P2O5 ha-1. Optimum grain yields were obtained in response to combined application of 27 kg N and 69 kg P2O5 ha-1 for Awash 1, Awash Melka and Red Wolayita respectively. However, variety Chercher attained optimum grain yield at the application of 18 kg N and 46 kg P2O5. Thus, the already existing blanket recommendation is sufficient for its optimum production in the study area. Therefore, different variety responds differently for application of nitrogen and phosphorus fertilizer. Generally, variety Awash Melka with the rate of 27 kg N: 69 kg P2O5 ha-1 was the best combination for Mechara and similar agro ecologies.
Acknowledgement
Major-advisor and Dr. Nigussie Dechassa (Co-advisor) for their continued guidance, inspiration, encouragement and support, which made the completion of this study smooth and successful. I would like also to express my sincere gratitude to Ministry of Education for financial support, Mizan-Tepi University for granting me leave of absence to pursue my post graduate study and Haramaya University for facilitating the process and services required for the completion of the Thesis.
My special thanks go to Mechara Agricultural Research Center (Officer, Assistants, Drivers and Field Assistants for their contribution to facilitate field operation and other activities). I would like to extend my heartfelt gratitude Mr. Aschalew Sisay, Mrs. Mulu Amare, Mrs. Soreti Mohammed, Mrs. Tizita Getaneh, Mr. Wubishet Mekonin, and Mr. Tariku Getaneh, for facilitating all materials and gadgets that I required to do my research work.
References
- Abebe G (2009) Effect of NP fertilizer and moisture conservation on the yield and yield components of haricot bean (Phaseolus vulgaris L.) in the semi arid zones of the central rift valley in Ethiopia. Adv Environ Biol 3: 302-307.
- Ferris S, Kaganzi E, International Livestock Research Institute (2008) Evaluating marketing opportunities for haricot beans in Ethiopia. Improving Productivity and Market Success (IPMS) of Ethiopian farmers project working paper 7, International Livestock Research Institute (ILRI), Nairobi, Kenya, pp. 1-68.
- Central Statistical Authority (2011/12) Agricultural sample survey, Area and production of temporary crops, private holdings for the 2008/09 Meher season.
- Singh Y, Singh ON, Sharma SN (2006) Effect of nitrogen and micronutrients on growth, yield and nutrient uptake by French bean. Indian J Pulse Res 19: 67-69.
- Sertsu S, Bekelet T (2000) Procedures for soil and plant analysis. National Soil Research Center, Ethiopian Agricultural Research Organization, Addis Ababa, Ethiopia, pp. 1-110.
- Bremner JM, Mulvaney CS (1982) Nitrogen-total. In: Page AL, Miller RH, Keeney DR (Eds) Methods of soil analysis. Part 2. Chemical and biological properties. Am Soc Agron 9: 595-624.
- Dadson RB, Acqach G (1984) Nitrogen and phosphorus effect on nodulation, symbiotic N fixation and yield of soybean. Field Crops Res 9: 101-108.
- Boutraa T (2009) Growth and carbon partitioning of two genotypes of bean (Phaseolus vulgaris) grown with low phosphorus availability. Eur Asia J BioSci 3: 17-24.
- Shubhashree KS (2007) Response of Rajmash (Phaseolus vulgaris L.) to the levels of nitrogen, phosphorus and potassium during rabi in the Northern transition zone. University of Agricultural Sciences, Karnataka, India, pp. 1-88.
- Tesfaye E, Kidan HG (2002) Uptake and response of haricot bean (Phaseolus vulgaris L.) varieties to different levels of phosphorus application on entisol of Alemaya. Alemaya University, Alemaya, Ethiopia, Africa, pp. 17.
- Nitrogen, phosphorus and potassium during rabi in the Northern transition zone.
- Emishaw W, Tesfaye K (2007) Comparison of the growth, photosynthesis and transpiration of improved and local varieties of common bean (Phaseolus vulgaris L.) at Haramaya. Alemaya University, Ethiopia, Africa, pp. 61.
- Woldesellasie T, Tana T, Fininsa C (2007) Response of improved lentil (Lens culinaris Medik) varieties to phosphorus application on vertisols at Haramaya. Haramaya University. Haramaya, Africa, pp. 65.
- Olofintoye TJ (2007) Effects of phosphorous fertilizer on growth and yield of soybean (Glycine max (L) Merrill). University of Ilorin, Nigeria, pp. 1-80.
- Fageria NK (2009) The use of nutrients in crop plants. CRC press, Taylor & Francis group, New York, USA, pp. 1-127.
- Girma A, Demelash A, Ayele T (2014) The response of haricot bean varieties to different rates of phosphorus at Arba Minch, Ethiopia. ARPN J Agric Biol Sci 9: 344-350.
- Veeresh NK (2003) Response of French bean (Phaseolus vulgaris L.) to fertilizer levels in Northern transitional zone of Karnataka. University of Agricultural Sciences, Karnataka, India, pp. 37-79.