
Journal of Plant Biology & Soil Health
Download PDF
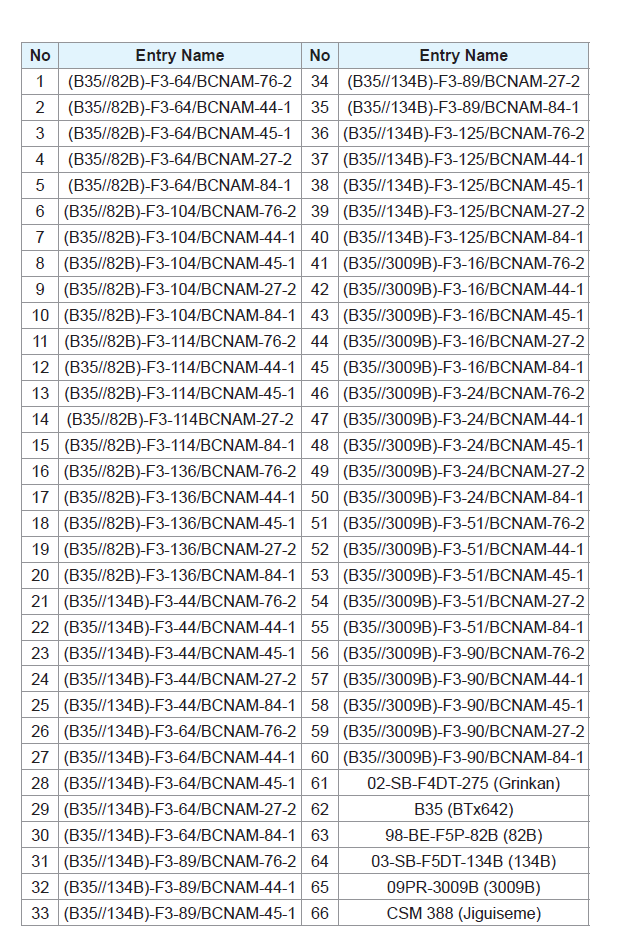
Study drought effect on various traits Identify hybrids with appropriate performance in water stressed condition Conduct yield stability analysis for hybrids using GGE biplot method.  Table 1: List of entries for hybrids trial.
 Seedling vigor Days to 50% flowering Leaf chlorophyll index Plant height Lodging tolerance Number of leaves per plant Thousand grains weight Vitreousness Panicle appreciation Grain appreciation Grain yield per plant Biomass Observations on traits used in drought tolerance indices 


 [12]
[12]  Table 2: ANOVA of Mean squares from across well-water and water stress management for various traits of genotypes.
  Table 3: Drought stress indices and yield under normal and drought stress conditions.
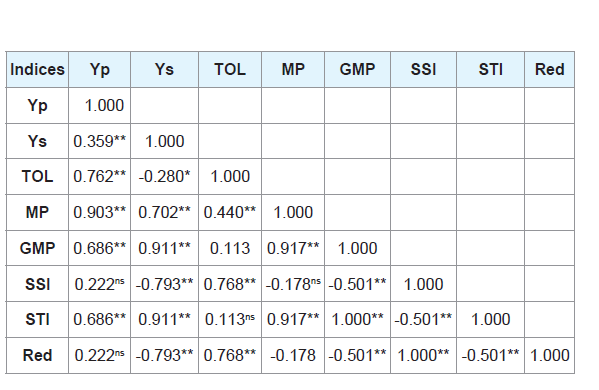
  Table 4: Coefficients of correlation between grain yields and drought stress indices under stress and well-watered conditions.
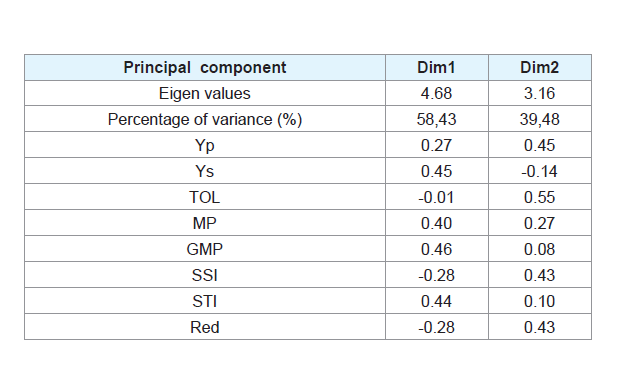
  Table 5: Principal component analysis of Potential Yield (Yp), Yield under Stress (Ys) and drought tolerance indices.
  Figure 1: Dendrogram from cluster analysis based on drought tolerance indices and grain yield of genotypes in both normal and stress environments.
  Figure 2: The GGE biplot showing which hybrids yielded best in eachenvironment for grain yield.
Research Article
Genetic Analysis of Various Traits of Hybrids Sorghum (Sorghum bicolor (L) Moench),Correlated with Drought Tolerance
Sissoko Sory1,2*, Diallo Abdoulaye Gaoussou2, Coulibaly Mamadou Mory2, Teme Niaba2, Vernon Gracen3,4 and Danquah Eric4
- 1Faculté des Sciences et Techniques, Universite des Sciences des Techniques et des Technologies de Bamoko (USTTB), Mali, Africa
- 2Institut d’Economie Rurale (IER) Mali, Africa
- 3Cornell University, USA
- 4West Africa Centre for Crop Improvement (WACCI), University of Ghana, Legon, Africa
*Address for Correspondence: Sissoko Sory, Faculté des Sciences et Techniques, Universite des Sciences des Techniques et des Technologies de Bamoko (USTTB), BP E 3206, Mali, Africa, Tel: (00223) 20 22 32 44 / 20 79 32 4; E-mail: sorysis@yahoo.fr
Citation: Sory S, Gaoussou DA, Mory CM, Niaba T, Gracen V, et al. Genetic Analysis of Various Traits of Hybrids Sorghum (Sorghum bicolor (L) Moench), Correlated with Drought Tolerance. J Plant Biol Soil Health. 2017;4(1): 9.
Copyright: © 2017 Sory S, et al. This is an open access article distributed under the Creative Commons Attribution License, which permits unrestricted use, distribution, and reproduction in any medium, provided the original work is properly cited.
Journal of Plant Biology & Soil Health | ISSN: 2331-8996 | Volume: 4, Issue: 1
Submission: 09 May, 2017 | Accepted: 26 June, 2017 | Published: 26 July, 2017
Keywords
Sorghum; Hybrids; Drought; Tolerant; Well-watered; Water-stressed
Abstract
Sorghum bicolor (L) Moench is one of the most important dry land crops of semi-arid tropics. It is classified predominantly as a self-pollinated crop; however heterosis has been commercially exploited to improve its productivity. The low production of sorghum in Mali is due to several reasons including lack of sorghum hybrids and adapted varieties with tolerance to stresses such as drought. The objective of the study was to improve sorghum grain yield, through the development of high yielding hybrids tolerant to post flowering drought. A total of 60 F1 were planted along with six sorghum lines used as check. A total of 66 genotypes of sorghum were evaluated in both drought and well-watered conditions. The split-plot design with drought intensity as the main plots was used. To achieve the goal of this study, the observations on traits used in drought tolerance indices, and the methods of multivariate analysis and biplot analysis were used. Results revealed three hybrids (B35//134B)-F3-44/BCNAM-76-2, (B35//82B)-F3-64/BCNAM-45-1 and (B35//82B)-F3-104/BCNAM-76-2 as the most drought tolerant genotypes with high yield stability in both contrasting environments.
Abbreviations
Yp: Yield under irrigated conditions; Ys: Yield under drought-stressed; TOL: Tolerance Index; MP: Mean Productivity; GMP: Geometric Mean Productivity; SSI: Stress Susceptibility Index; STI: Stress Tolerance Index; Red: Percentage Reduction; Df: Degree of Freedom; Yield: Grain Yield; BIOM: Biomass; 50 FLO (day): Days to 50 percent Flowering; SCMR 50 FLO: SPAD Chlorophyll Meter Readings at 50% Flowering; SCMR MAT: SPAD Chlorophyll Meter Readings at Maturity; Height: Plant Height; TNL: Total Number of Leaves; TNGL: Total Number of Green Leaves; TGW: Thousand Grains Weight; GA: Grain Appreciation; VITR: Vitreousness; PA: Panicle Appreciation; LT: Lodging; SV: Seedling Vigor; Rep: Repetitions
Introduction
Sorghum bicolor (L) Moench is the second most important cereal food, after maize, for millions of people living in the semi-arid and sub-tropical regions of Africa [1]. Although globally sorghum is ranked fifth in importance (after wheat, maize, rice, and barley), its critical role as a source of energy and dietary protein to food insecure people of sub-Saharan Africa cannot be overemphasized [1]. Most of the world’s grain sorghum production occurs in arid or semi-arid climates without supplementary irrigation. Drought is one of the most important abiotic stresses and causes considerable yield loss in sorghum each year in different regions of the world. Hence, developing drought tolerant varieties is a major breeding objective. Drought stress during vegetative phase, flowering and grain filling periods cause considerable decrease in yield of sorghum [2].
Mali is one of the largest sorghum producing countries in sub-Saharan Africa. The cultivation areas of sorghum in Mali have extended widely from all the agricultural areas of the humid regions to the arid ones. The considerable variation in crop conditions, because of climatic situations and different soil constituents, cause large annual variations in yield performance of crops. This is mainly because of low heritability of yield. Thus, grain yield could be affected by not only genotype, but also by environment and genotype × environment interactions (G × E) [3].
Generally, different genotypes behave differently because of differences in gene responses in different environments [4]. G × E interaction decreases the correlation between genotype and phenotype, which in turn reduces the progress of genotype selection, especially under drought stress conditions. Stability analysis is the most important method used to discover the nature of G × E interaction by which stable and consistent genotypes can be identified and selected [5,6].
Several drought stress indices or selection criteria, such as stress Tolerance (TOL), Mean Productivity (MP), Geometric Mean Productivity (GMP), Stress Susceptibility Index (SSI), Stress Tolerance Index (STI) have been proposed as ways to identify genotypes with good stress tolerance.
One of the main objectives of this study was to compare the usefulness of several drought stress indices for the identification of genotypes with better performance under different levels of water stress; and to analyze G × E interaction using the GGE biplot method to evaluate sorghum hybrids, environments and the relationships between hybrids and environments, as well as to identify ideal hybrids that are suitable for different water regimes (environments).
The specific objectives were to:
Materials
Experimental site
Regional Center for Agronomic Research (CRRA) of Sotuba: The field research was conducted at the Regional Center for Agronomic Research (CRRA) of Sotuba, IER Mali. The research center of Sotuba is located in Bamako at the west bank of river Niger and lies in the Sudano-Sahelian zone. Coordinates are 12°39’47’’ North 7°54’50’’ West on altitude 320 m and isohyet 600 - 1000 mm.
The soils at Sotuba are sandy with low water holding capacity, low inherent soil fertility and organic matter content.
The average temperature was 28 °C with variations between 15 to 42 °C; and the hottest temperatures were recorded in April and May, while the minimal values were observed in December and January. The average annual relative humidity was 42.8% and average monthly relative humidity ranged from 16% in February to 74% in August [7].
Irrigation system used: In this study the drip irrigation was used. The irrigation pipes was installed between the rows, the plots were irrigated at two days interval.
Fertilizer application: During the study, the fields received five tons per hectare of organic fertilizer and pre-sowing fertilization consisting of 100 kg/ha Diammonium phosphate (DAP) [NPK: 18-46-0] and nitrogen in the form of urea was applied 40 days after sowing at 50 kg.
Plant material: Sixty F1 sorghum hybrids plus six checks were used in the present study (Table 1). The female parents of hybrids derive from introgression of stay green character of B35 to three elite sorghum B-lines: 98-BE-F5P-82B; 03-SB-F5DT-134B and 09PR-3009B (senescent, drought susceptible) and male parents (Rf-lines) were identified among sorghum population of Backcross Nested Association Mapping (BCNAM) project in Mali.
Methods
Data collection
Data were collected on the following parameters as in sorghum descriptor [8]:
Early seedling vigor was recorded at 15 days after emergence of seedlings on the scale of 1 to 5, where 1 = Poor seedling vigor and 5 = Very good seedling vigor.
This was recorded as number of days from the date of sowing to the date when half the panicles were in bloom.
A Minolta chlorophyll meter (SPAD-502) was used to measure the greenness of the leaf below the Flag Leaf (FL-1) from three tagged plants in each row at flowering and at maturity. Three measurements were taken down one side of the leaf at the base, centre and tip, approximately 1 cm from the leaf edge.
The plant height was recorded by measuring the distance from ground level to the tip of the panicle at physiological maturity and expressed in centimeters.
Lodging tolerance was evaluated by allowing the plants to remain in the field after maturity and throughout the winter to apply uniform lodging pressure.
The scoring for lodging was done as in sorghum descriptor and converted to a scale of 1 - 5 as follows:
Scores of phenotypes (% lodging)
1= All plants in the plot completely upright;
2 = 1 - 10% of plants in the plots completely lodged;
3 = 11 - 25% of plants in the plots completely lodged;
4 = 26 - 40% of plants in the plots completely lodged;
5 = > 40% of plants in the plots completely lodged;
Total Numbers of Leaves (TNL) at maturity were recorded; thereafter the Total Numbers of Green Leaves (TNGL) were recorded.
The 1000 grains were randomly counted and weight recorded in grams.
The endosperm varies from 100% soft tissue (floury) with a little corneous portion to a solid corneous seed (vitreous grain).
It was rated at physiological maturity of the seed on the scale of 1 to 10; where:
1 = Very solid corneous seed (0 - 10% soft tissue)
2 = Solid corneous seed (10 - 20% soft tissue)
3 = Solid corneous seed (20 - 30% soft tissue)
4 = Solid corneous seed (30 - 40% soft tissue)
5 = Solid endosperm (40 - 50% soft tissue)
6 = Soft endosperm (50 - 60% soft tissue)
7 = Soft endosperm (60 - 70% soft tissue)
8 = Soft endosperm (70 - 80% soft tissue)
9 = Soft endosperm (80 - 90% soft tissue)
10 = Very soft corneous seed (floury endosperm) (0 - 100% soft tissue)
Panicle appreciation was recorded at physiological maturity on the visual scale of 1 to 5, where:
1 = Very loose drooping panicle
2 = Loose drooping primary branches
3 = Semi-loose erect primary branches
4 = Semi-loose drooping primary branches
5 = Very compact panicle.
The grain appreciation was done by visual appraisal of grain color and grain size. It was recorded on the following scale
Scores of phenotypes
5 = Very good
4 = Good
3 = Average
2 = Below average
1 = Poor (rejected)
Well-dried panicles were threshed and seeds separated. Weight of the seeds in grams was recorded as grain yield per plant.
After panicles were harvested, each plant of an experimental plot was harvested manually by cutting the plant at the base and then dried. After drying, the samples were weighed and used to estimate the dry biomass.
Six selection indices including Stress Susceptibility Index (SSI) [9], Stress Tolerance Index (STI) [10], Tolerance Index (TOL) [11], Mean Productivity (MP) [11], Geometric Mean Productivity (GMP_ [10] and percentage reduction (Re %) was calculated based on grain yield under drought-stress and well-watered conditions. Stress tolerance indices were calculated by the formula:
SI is the stress intensity and was calculated as
[12] Where, Ys and Yp are the yields of genotypes evaluated under stress and non-stress conditions and Ȳs and Ȳp are the mean yields over all genotypes evaluated under stress and non-stress conditions.
Statistical analysis
Multivariate statistical analyses such as the principal component analysis and cluster analysis were performed using GENSTAT 12th edition and “R” software version 3.1.2.
Experimental Results
Analysis of variance (ANOVA) of mean squares for selected traits across environments
The ANOVA of mean squares of genotypes evaluated across water management showed significant interaction (at P = 0.05 and P = 0.01) for traits such as grain yield, SPAD chlorophyll meter readings at maturity, and total number of green leaves. And in contrast it showed no significant interaction for traits such as days to 50% flowering, SPAD chlorophyll meter readings at 50% flowering, biomass, total number of leaves, plant height, thousand grains weight, panicle appreciation, grain appreciation and vitreousness (Table 2).
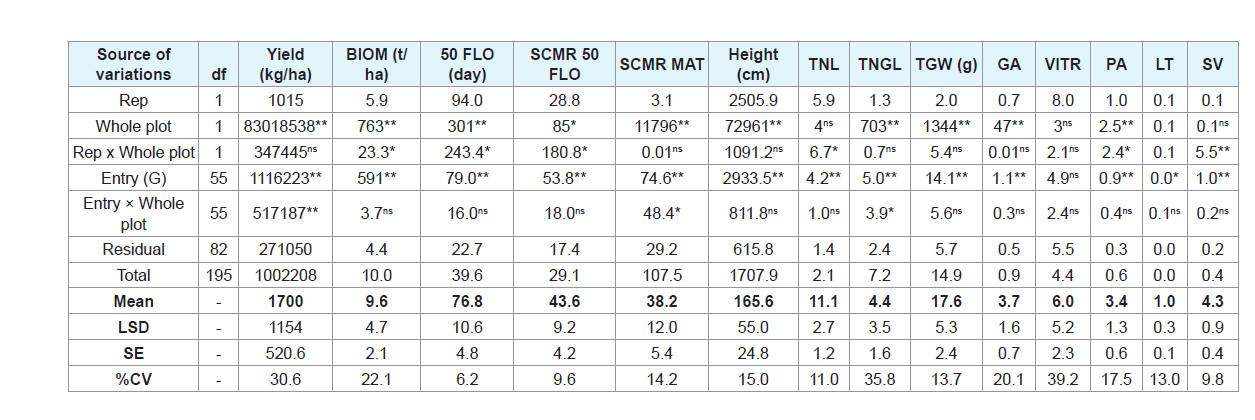
This indicates that, for some traits, there was no effect of drought on the genotypes and they behave the same in the two environments.
The mean squares for genotypes (Entries) were significant (at P = 0.05 and P = 0.01) for all traits except grain vitreousness (Table 2). This shows that, for each environment (water management) separately, a statically significant difference occurs between genotypes.
Grain yield and drought tolerance indices
Different drought tolerance indices were calculated on the basis of grain yield of the genotypes under well-watered (Yp) and stressed (Ys) conditions.
Based on SSI index the hybrids (B35//82B)-F3-64/BCNAM-84-1 (yields 2843 and 255 Kg/ha), (B35//3009B)-F3-24/BCNAM-45-1 (2169 and 201 Kg/ha), (B35//3009B)-F3-16/BCNAM-76-2 (3016 and 308 Kg/ha) and (B35//134B)-F3-125/BCNAM-44-1 (3803 and 428 Kg/ha) with high SSI values (1.5) were found to be the most sensitive genotypes to stress whereas genotypes (B35//134B)-F3-89/BCNAM-44-1 (2007 and 1577 Kg/ha), (B35//3009B)-F3-16/BCNAM-84-1 (2405 and 1758 Kg/ha) and (B35//82B)-F3-104/BCNAM-84-1 (2444 and 1686 Kg/ha), with low value (0.4 to 0.5) were found to be tolerant to drought stress (Table 3). In this study, the results of SSI indices in selection of genotypes were similar to Re (%) index.
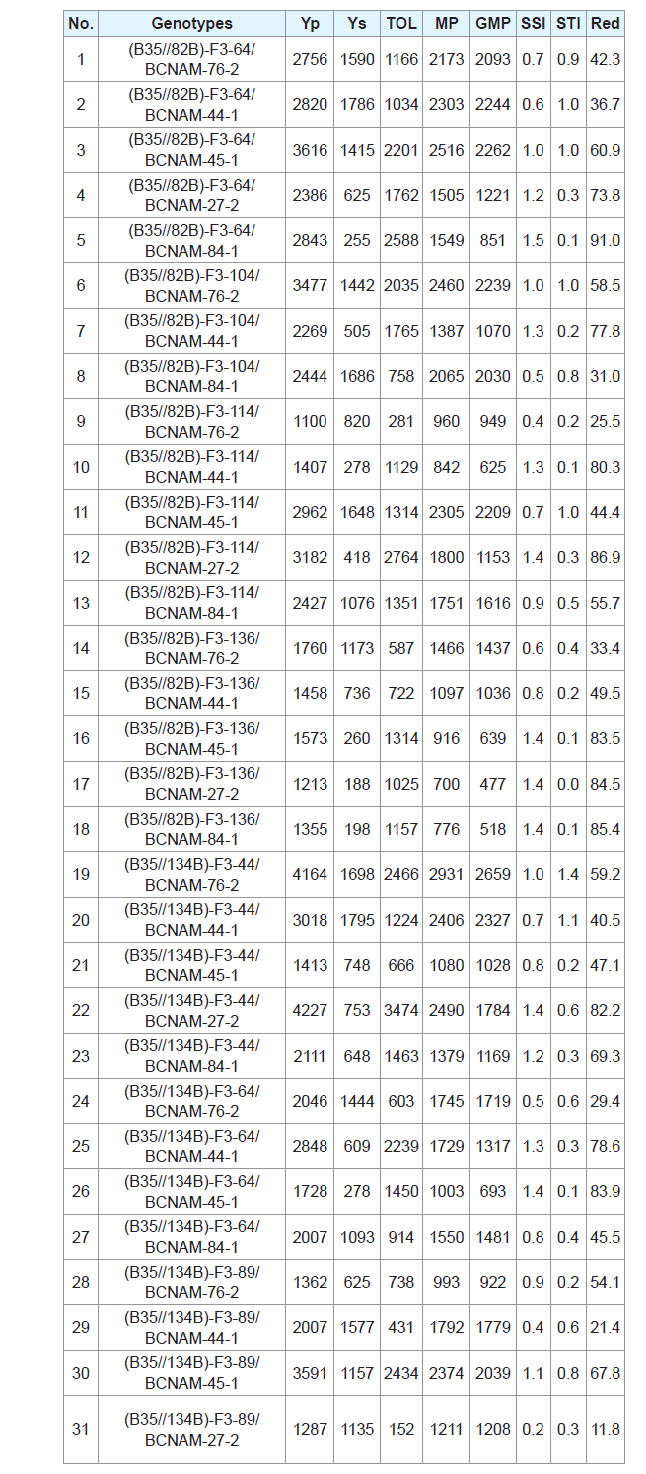
For the TOL index, the highest values were recorded for hybrids (B35//134B)-F3-44/BCNAM-27-2 (4227 and 753 Kg/ha), (B35//134B)-F3-125/BCNAM-44-1 (3803 and 428 Kg/ha) and (B35//82B)-F3-114BCNAM-27-2 (3182 and 418 Kg/ha) which were considered as susceptible, to drought stress, whereas the (B35//134B)-F3-89/BCNAM-27-2 (1287 and 1135 Kg/ha), (B35//134B)-F3-125/BCNAM-27-2 (1627 and 1309 Kg/ha), (B35//134B)-F3-89/BCNAM-44-1 (2007 and 1577 Kg/ha) and (B35//3009B)-F3-24/BCNAM-44-1 (1518 and 1081 Kg/ha) with low values were considered as tolerant genotypes but mostly with low value also of grain yields in both environments (Table 3).
The highest MP and GMP were recorded for genotypes (B35//134B)-F3-44/BCNAM-76-2 (4164 and 1698 Kg/ha) and (B35//82B)-F3-64/BCNAM-45-1 (3616 and 1415 Kg/ha), they were considered as tolerant genotypes with high yield stability under both conditions (Table 3).
Yield based on STI index, the genotypes (B35//134B)-F3-44/BCNAM-76-2 (4164 and 1698 Kg/ha), (B35//134B)-F3-44/BCNAM-44-1 (with mean grain yields of 3018 and 1795 Kg/ha), (B35//82B)-F3-64/BCNAM-45-1 (3616 and 1415 Kg/ha), (B35//82B)-F3-64/BCNAM-44-1 (2820 and 1786 Kg/ha), (B35//82B)-F3-104/BCNAM-76-2 (3477 and 1442 Kg/ha) and (B35//82B)-F3-114/BCNAM-45-1 (3616 and 1415 Kg/ha) were considered as the most tolerant genotypes with high yield under both conditions, with highest STI value (1.0 - 1.4). Based on this result the STI index appears to be the best drought tolerance index.
Correlation between grain yield and drought tolerance indices
Correlation coefficients were used to identify the best criterion for selecting drought tolerant genotypes. As shown in Table 4, indices including GMP, MP and STI were highly correlated with each other as well as with Yp and Ys. A positive correlation between TOL and Yp and the negative correlation between TOL and Ys (Table 4) suggested that selection based on TOL will lead to reduction of yield under well-watered conditions. SSI showed a negative correlation with Ys while no significant correlation was detected between Yp and SSI. Thus SSI index is suitable for identification of genotypes with low yield and tolerance to drought stress. The results of SSI indices in selection of genotypes were similar to Re (%) index in this study. SSI has been widely used by researchers for selecting drought tolerant genotypes [13]. However, TOL and SSI were not strongly correlated with indices GMP, MP and STI (Table 4). TOL and SSI ranked differently from the other selection.
Multivariate analysis
Principal component analysis: Principal component analysis was used to classify the genotypes using GenStat 12th Edition software. The first Principal Axis (PCA) (PC1) explained 58.43% of the variation and had positive correlation with Yp, Ys, MP, GMP and STI (Table 5). Thus, the first dimension can be considered as the yield potential and drought tolerance. Genotypes possessing high values of PC1, could be high yielding under stressed and well-watered environments. The second PCA (PC2) explained 39.48% of the total variability and correlated positively with Yp, TOL, SSI and Red but had a negative correlation with yield under stressed conditions (Table 5). Therefore, the stress susceptibility dimension was able to separate the drought-susceptible cultivars. Hence, selection of genotypes that have high PCA1 and low PCA2 would result in genotypes good in both stressed and non-stressed conditions.
Cluster analysis: Cluster analysis was done to study the variation between genotypes based on drought tolerance indices. Cluster analyses were based on drought tolerance indices using “R” software version 3.1.2. The dendrogram shows three clusters (groups) of genotypes based on yield under well-watered and stress conditions, tolerance index, mean productivity, geometric mean productivity, stress susceptibility index, stress tolerance index, and percentage yield reduction (Figure 1).
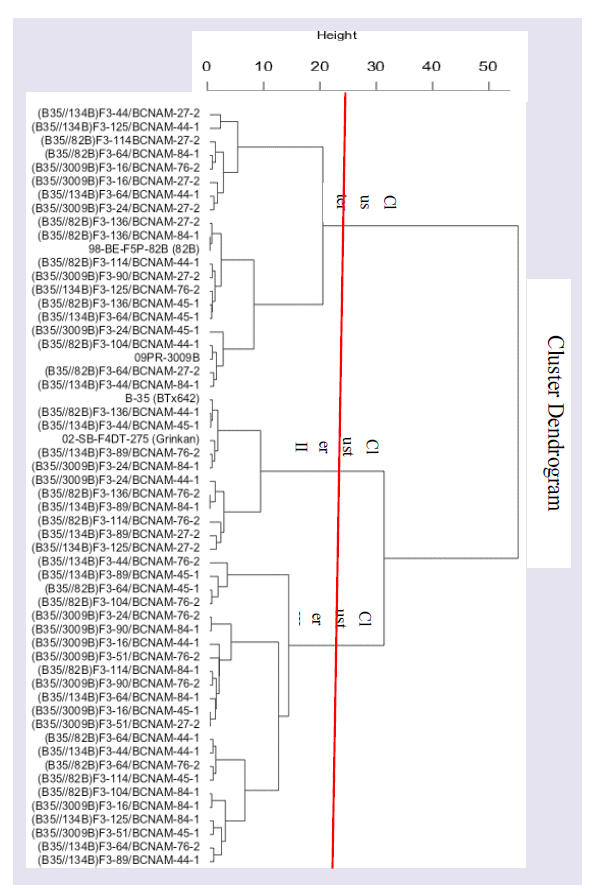
Cluster I includes genotypes that had high yield under well-watered and low yield in stressed conditions. These genotypes in most cases had the highest values of TOL, and SSI indices. Cluster II includes genotypes that had low yield in well-watered and stressed conditions. Hence, genotypes in this cluster could be stable in non-stressed environments but low yielding. The genotypes belonging to cluster III had high yield in well-watered and stressed conditions and, in the most cases, they had the highest values of STI, and GMP indices.
Drought effects on chlorophyll index (SCMR) at maturity
The ANOVA of genotypes evaluated across water managements showed significant differences (P < 0.05) between genotype (G) by water management for the SCMR at maturity. This indicates that the genotypes reacted differently well-watered and water stress conditions.
The overall means of chlorophyll contents were 28.6 and 44.9 under drought stress and under well-watered conditions. The genotypes B35 (BTx642), (B35//3009B)-F3-90/BCNAM-27-2, (B35//134B)-F3-125/BCNAM-44-1, (B35//134B)-F3-44/BCNAM-44-1, (B35//134B)-F3-44/BCNAM-84-1 and (B35//3009B)-F3-16/BCNAM-84-1 showed the highest SCMR at maturity under drought stress conditions.
The drought effects were lower at maturity for the genotypes (B35//82B)-F3-104/BCNAM-84-1, (B35//3009B)-F3-90/BCNAM-27-2, (B35//134B)-F3-44/BCNAM-84-1 and (B35//134B)-F3-89/BCNAM-76-2 and were very high for the genotypes (B35//134B)-F3-64/BCNAM-44-1, (B35//3009B)-F3-24/BCNAM-45-1, 98-BE-F5P-82B, (B35//3009B)-F3-51/BCNAM-27-2, (B35//134B)-F3-89/BCNAM-44-1, (B35//82B)-F3-114/BCNAM-44-1, (B35//82B)-F3-64/BCNAM-84-1, (B35//134B)-F3-64/BCNAM-45-1 and (B35//134B)-F3-44/BCNAM-27-2.
Drought effects on number of leaves under water stress conditions at maturity
Entries showed highly significant (P < 0.01) differences in total number of green leaves at maturity under water stress. The overall means of Total Number of Leaves (TNL) per plant and Total Number of Green Leaves (TNGL) at maturity were 11 and 2 under drought stress conditions, respectively.
The drought effects were important for many genotypes; the ones most severely affected (100% senescent) were (B35//82B)-F3-64/BCNAM-84-1, (B35//82B)-F3-104/BCNAM-44-1, (B35//82B)-F3-114BCNAM-27-2, (B35//82B)-F3-136/BCNAM-27-2, (B35//82B)-F3-136/BCNAM-84-1, (B35//134B)F3-64/BCNAM-45-1, (B35//134B)-F3-89/BCNAM-76-2, (B35//134B)-F3-89/BCNAM-84-1 and 98-BE-F5P-82B. The genotypes that had the lowest effect of drought on greenness of leaves were B35 (BTx642), (B35//82B)-F3-104/BCNAM-76-2, (B35//3009B)-F3-51/BCNAM-76-2, (B35//3009B)-F3-24/BCNAM-76-2, (B35//82B)-F3-114/BCNAM-84-1, (B35//82B)-F3-64/BCNAM-45-1, (B35//134B)-F3-44/BCNAM-76-2 and (B35//134B)-F3-89/BCNAM-45-1.
Stability analysis for grain yield performance of hybrids sorghum using GGE biplot method
The yield stability of the cultivars was examined using the GGE biplot method, the result is indicated in the Figure 2. The GGE biplot analysis reveals that PC1 and PC2 together accounted for 100% of the total variance for grain yield across test environments, with PC1 explaining 77.23% of the total variance while PC2 explaining the rest.
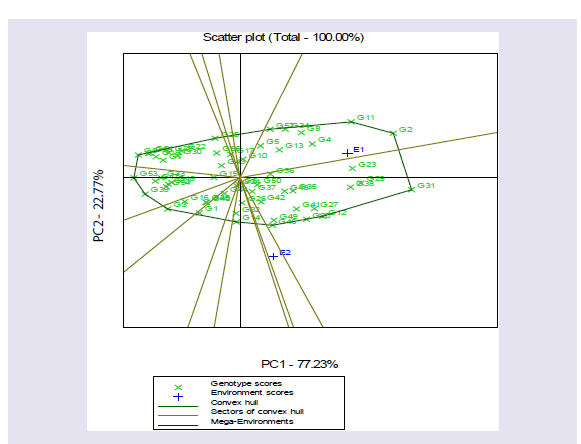
In this analysis, drought levels (well-watered and stressed) were considered as environments. It is obvious that both environments, well-watered (+E1) and water stressed (+E2), are located in different quadrants, indicating that they are significant different and could be considered as two different environments (Figure 2).
The hybrids (B35//134B)-F3-44/BCNAM-27-2 (code G2), (B35//134B)-F3-125/BCNAM-44-1 (G11), (B35//134B)-F3-89/BCNAM-45-1 (G23), with mean grain yields 4227 Kg/ha, 3803 Kg/ha and 3591 Kg/ha respectively, are scattered in the well-watered environment (+E1). These genotypes produced higher yields in these environments and have better adaptation than other cultivars for well-watered (+E1) environments. In contrast, the genotypes (B35//134B)-F3-44/BCNAM-44-1 (code G12), (B35//82B)-F3-64/BCNAM-44-1 (G20), (B35//3009B)-F3-16/BCNAM-84-1 (G46), with mean grain yields 1795 Kg/ha, 1786 Kg/ha, and 1758 Kg/ha, respectively, are located in the drought stress environment (+E2) and exhibited high yield in this environment, indicating that they have better adaptation than other cultivars in this environment.
Genotypes (B35//134B)-F3-44/BCNAM-76-2 (G31) yield 4164 and 1668 Kg/ha, (B35//82B)-F3-64/BCNAM-45-1 (G29) yield 3616 and 1415 kg/ha, and (B35//82B)-F3-104/BCNAM-76-2 (G38) yield 3477 and 1442 Kg/ha are located between yield under well-watered and stress conditions, indicating that they are correlated with both environment. These genotypes had a much higher yield than other genotypes in both environments and were identified as the most tolerant genotypes with high yield stability across both environments.
Discussion
The main objective of the present study was to evaluate the effect of drought stress on sorghum grain yield and other traits of the sorghum genotypes and to study relevant drought tolerance indices, and to identify drought tolerant genotypes.
Different drought tolerance indices were calculated on the basis of grain yield of the genotypes under well-watered (Yp) and stressed (Ys) conditions (Table 2). Considering SSI and TOL indices, some genotypes with high SSI and TOL values were indentified ((B35//82B)-F3-64/BCNAM-84-1, (B35//3009B)-F3-24/BCNAM-45-1, (B35//3009B)-F3-16/BCNAM-76-2 (B35//134B)-F3-125/BCNAM-44-1, (B35//134B)-F3-44/BCNAM-27-2, and (B35//82B)-F3-114BCNAM-27-2) and were considered the most sensitive genotypes to drought. The genotypes (B35//134B)-F3-89/BCNAM-44-1, (B35//3009B)-F3-16/BCNAM-84-1, (B35//82B)-F3-104/BCNAM-84-1, (B35//134B)-F3-89/BCNAM-27-2, (B35//134B)-F3-125/BCNAM-27-2, and (B35//3009B)-F3-24/BCNAM-44-1) were identified as tolerant to drought, but had mostly low grain yields in both environments.
These results are in agreement with those reported by Mehrdad et al. in a study involving evaluation of drought tolerance indices among some winter rapeseed cultivars [14].
It has been noted that some genotypes with high or low yields in both well-watered and water stressed environments had the same SSI or TOL values [15]. They described SSI as deceptive. They believed that since the formula for this index involved the proportion of a certain cultivar's yield under stress conditions to that of the non-stress conditions and to the proportion of the yield under stress conditions to that of the non-stress conditions in all experimental cultivars, two cultivars with high or low yields in both environments could have equal SSI values. Furthermore, Moghaddam and Hadizadeh, in studying drought tolerance indices in corn, stated that low TOL did not necessarily mean a cultivar's high yield in a stress environment because a cultivar's yield might be low under irrigation conditions, but would entail a smaller drop under stress conditions that might result in a low TOL and it could be introduced as a drought-tolerant cultivar [16].
Furthermore, Fernandez reported that TOL index was efficient in improving yield under stressed condition but the selected genotypes performed poorly under non-stressed conditions [10]. Fernandez favored the use of the STI index which discriminates genotypes with high yield and stress tolerance potentials [10]. A high STI value indicated a high tolerance to stress.
Based on STI index in this study, genotypes (B35//134B)-F3-44/BCNAM-76-2, (B35//134B)-F3-44/BCNAM-44-1, (B35//82B)-F3-64/BCNAM-45-1, (B35//82B)-F3-64/BCNAM-44-1, (B35//82B)-F3-104/BCNAM-76-2 and (B35//82B)-F3-114/BCNAM-45-1 were considered as most tolerant genotypes with high yield stability in both environments.
To identify the best criterion for selecting drought tolerant genotypes, correlation coefficients were used in the present study. The STI, MP and GMP were significantly correlated with the seed yield under well-watered and stress conditions. Farshadfar et al. reported that the most suitable index for selecting stress-tolerant cultivars is an index which has a relatively strong correlation with the seed yield under stress and non-stress conditions [17]. Therefore, evaluating correlations between stress tolerance indices and the seed yield in both environments can lead to identification of the most suitable index.
Most genotypes were not susceptible to lodging under both water stressed and well-watered conditions and showed no significant differences for thousand grain weight across water management regimes. This result is consistent with the finding of Rosenow and Clark who reported that the stay green can have a major impact on reducing lodging and is associated with increased grain size in sorghum [18].
GGE biplot was used to study the yield stability of hybrids. An important objective of this study was to examine the adaptation and stability of hybrids and their parents in different environments. The results showed that the hybrids (B35//134B)-F3-44/BCNAM-27-2, (B35//134B)-F3-125/BCNAM-44-1, (B35//134B)-F3-89/BCNAM-45-1 were more stable and had superior performance only in the well-watered (+E1) environments. (B35//134B)-F3-44/BCNAM-44-1, (B35//82B)-F3-64/BCNAM-44-1, (B35//3009B)-F3-16/BCNAM-84-1 had high yield and better adaptation than other cultivars for water stress environment (+E2). The genotypes (B35//134B)-F3-44/BCNAM-76-2 (G31), (B35//82B)-F3-64/BCNAM-45-1, and (B35//82B)-F3-104/BCNAM-76-2, were located between yield under well-watered and stress conditions (+E1 and +E2) and had a much higher yield than other genotypes in both environments. These hybrids were identified as the most drought tolerant genotypes with high yield stability under both conditions.
GGE biplot method has been used to study GE interaction and yield stability of different crops in semi-arid areas of Mali. Diallo identified parents and hybrids of sorghum with superior performance in different environments, high and low level of phosphorous (P) [19]. Several studies have been reported using GGE biplots for genotypic stability analysis through the world. Shiri identified ideal maize hybrid genotypes among seven maize hybrids evaluated under four irrigation regimes (well-watered, water deficit at the vegetative growth stage, water deficit during flowering and water deficit during grain-filling) in Northwestern Iran [20].
Conclusion
The analysis of variance of genotypes evaluated across water management level showed interaction (at P = 0.05 and P = 0.01) between genotype (G) by water management for grain yield (kg/ha), SCMR and TNGL at maturity; suggesting that the behavior of genotypes were different from one environment to another.
The results of evaluation of the effect of drought stress on grain yield using stress tolerance indices suggested that breeders should choose the indices on the basis of stress severity in the target environment. STI, MP and GMP are useful indicators for selection of tolerant genotypes. Based on of these indices, the genotypes (B35//134B)-F3-44/BCNAM-76-2, (B35//82B)-F3-64/BCNAM-45-1, and (B35//82B)-F3-104/BCNAM-76-2 were found to be most drought tolerant genotypes with high yield stability in the well-watered and drought conditions. The same genotypes were identified through stability analysis for grain yield performance of hybrids using the GGE biplot method as high yielding and stable in well-watered and water stress environments.
These genotypes could be commercialized as tolerant genotypes after further evaluations on station trials and in farmers’ fields.
Acknowledgement
The authors would like to acknowledge Alliance for a Green Revolution in Africa (AGRA), West Africa Centre for Crop Improvement (WACCI) the University of Ghana and the Institutd’ Economie Rurale (IER) for their financial and training support.
References
- Taylor J, Dewar J (2000) Fermented products: beverages and porridges. In: Smith CW, Frederiksen RA (Eds) Sorghum: origin, history, technology, and production. John Wiley & Sons, New York, USA, pp. 751-795.
- Rosenow DT, Ejeta G, Clark LE, Gilbert ML, Henzell RG, et al. (1997) Breeding for pre- and post-flowering drought stress resistance in sorghum. In: Proceedings of the International Conference on Genetic Improvement of Sorghum and Pearl Millet, 22-27 September, Lubbock, Texas; Lincoln, INSORMIL, Nebraska, USA, pp. 406-411.
- Mortazavian SM, Nikkhah HR, Hassani FA, Sharif-al-Hosseini M, Taheri M, et al. (2014) GGE biplot and AMMI analysis of yield performance of barley genotypes across different environments in Iran. J Agric Sci Tech 16: 609-622.
- Brandie JE, Meverty B (1994) Genotype × environmental interaction and stability of seed yield of oil rapeseed. Crop Sci 18: 344-353.
- Perkins JM, Jinks JL (1968) Environmental and genotype-environmental components of variability. 3. Multiple lines and crosses. Heredity (Edinb) 23: 339-356.
- Cornelius PL, Crossa J (1999) Prediction assessment of shrinkage estimators of multiplicative models for multi-environment cultivar trials. Crop Sci 39: 998-1009.
- Station Météo Sotuba (2014) Relevés météoritiques du CRRA de Sotuba. IER Mali, Africa.
- International Board for Plant Genetic Resources (1993) Descriptors for Sorghum [Sorghum bicolor (L.) Moench]. Rome, Italy, pp. 38.
- Fischer RA, Maurer R (1978) Drought resistance in spring wheat cultivars. 1. Grain yield responses. Aust J Agric Res 29: 897-912.
- Fernandez GC (1992) Effective selection criteria for assessing plant stress tolerance. In: Proceedings of the International Symposium on “Adaptation of vegetables and other food crops in temperature and water stress”. Asian Vegetable Research and Development Centre (AVRDC), Taiwan, pp. 257-270.
- Hossain AB, Sears RG, Cox TS, Paulsen GM (1990) Desiccation tolerance and its relationship to assimilate partitioning in Winter wheat. Crop Sci 30: 622-627.
- Choukan R, Taherkhani T, Ghanadha MR, Khodarahmi M (2006) Evaluation of drought tolerance in grain maize inbred lines using drought tolerance indices. Iran J Crop Sci 8: 79-89.
- Kharrazi MA, Rad MR (2011) Evaluation of sorghum genotypes under drought stress conditions using some stress tolerance indices. Afr J Biotechnol 10: 13086-13089.
- Yarnia M, Arabifard N, Khoei FR, Zhandi P (2011) Evaluation of drought tolerance indices among some winter rapeseed cultivars. Afr J Biotechnol 10: 10914-10922.
- Naeimi M, Ali AG, Hossein SA, Modares Sanavi SA, Sadat Nouri SA, et al. (2008) Evaluation of drought tolerance in different Canola cultivars based on stress evaluation indices in terminal growth duration. Electronic J Crop Prod 1: 83-98.
- Moghaddam A, Hadizadeh M (2002) Response of corn (Zea mays L.) hybrids and their parental lines to drought using different stress tolerance indices. Seed Plant Improv J 18: 255-272.
- Farshadfar E, Zamani M, Motallebi M, Imamjomeh A (2001) Selection for drought resistance in chickpea lines. Iran J Agris Sci 32: 6577.
- Rosenow DT, Clark LE (1982) Drought tolerance in sorghum. In: Loden HD, Wilkinson D (Eds), Proceedings of 36th Annual Corn and Sorghum Industry Research Conference. 9-11 December. Chicago, USA, pp. 18-31.
- Diallo AG (2013) Etude de l’Aptitude à la Combinaison et la performance agronomique des hybrides de Sorgho de type Guinea dans divers environnements au Mali. USTTB, Thèse de Doctorat, Africa, pp. 92.
- Shiri M (2013) Grain yield stability analysis of maize (Zea Mays L.) hybrids under different drought stress conditions using GGE biplot analysis. Crop Breed J 3: 107-112.