
Research Article
Assessment of Biomass andTotal Carbon Stock in a Tropical Wet Evergreen Rainforest of Eastern Himalaya along a Disturbance Gradient
Anudip Gogoi, Uttam Kumar Sahoo* and Soibam Lanabir Singh2
- Department of Forestry, Mizoram University, Mizoram, India
*Address for Correspondence: Uttam Kumar Sahoo, Department of Forestry, Mizoram University, Aizawl-796004, Mizoram, India, Tel/Fax: +91-389-2330644; E-mail: uttams64@gmail.com
Citation: Gogoi A, Sahoo UK, Singh SL. Assessment of Biomass and Total Carbon Stock in a Tropical Wet Evergreen Rainforest of Eastern Himalaya along a Disturbance Gradient. J Plant Biol Soil Health. 2017;4(1): 8.
Copyright: © 2017 Gogoi A, et al. This is an open access article distributed under the Creative Commons Attribution License, which permits unrestricted use, distribution, and reproduction in any medium, provided the original work is properly cited.
Journal of Plant Biology & Soil Health | ISSN: 2331-8996 | Volume: 4, Issue: 1
Submission: 31 January, 2017 | Accepted: 05 April, 2017 | Published: 15 April, 2017
Keywords
Carbon sequestration; Disturbance index; Rainforest; Biomass; Carbon stock
Abstract
Rainforests of North-East India in the Eastern Himalaya forms a part of the Himalayan biodiversity hotspot with rich biodiversity accompanied with dense vegetation of trees, thus making rainforest ecosystems a major carbon sink. Despite the biological richness, forest degradation is a matter of serious concern in this region. Considering disturbance as a major factor, a study was carried out to assess the biomass and carbon allocation pattern in the different compartments of the rainforest. The study area was stratified into least disturbed (LD), mildly disturbed (MD) and highly disturbed (HD) sites based on visual assumption, and later disturbance index of the sites were calculated. Vegetation analysis for various ecological indices was carried out. Biomass and carbon stock in different pools were estimated adopting suitable regression equations developed earlier for similar ecological regions. The total plant biomass showed a gradual decrease from LD to HD site and was 425.70 ± 29.71 Mg ha-1 in the LD site, followed by 236.08 ± 5.82 Mg ha-1 in the MD site and 127.38 ± 4.74 Mg ha-1 in the HD site. Amongst the different pools, aboveground biomass constituted the largest compartment in all the three sites for C stock and biomass. Tree density and basal area were highest in the LD sites. Soil organic Carbon (SOC) stock in 0 - 45 cm depth was also recorded maximum in the LD (72.48 ± 5.11 Mg C ha-1) followed by MD (40.13 ± 2.50 Mg C ha-1) and HD (32.38 ± 1.66 Mg C ha-1) sites. Total carbon stock was also found highest (306.61 ± 17.14 Mg C ha-1) in the LD site followed by 169.97 ± 2.59 Mg C ha-1 in the MD and 102.43 ± 3.18 Mg C ha-1 in HD site. Forest disturbance thus showed a significant inverse relation with carbon storage in all the pools. Thus it can be concluded that carbon sequestration in forest ecosystems was influenced by the anthropogenic disturbances in the present study.
Introduction
Increasing levels of greenhouse gases (GHGs) leading to rise in temperature and climate change have become a major concern of all scientists, citizens and policy makers. As such, the Kyoto Protocol to the United Nations Framework Convention on Climate Change (UNFCCC) is the first and so far the largest international agreement to stabilize GHG concentrations by limiting the continued release and with an aim to reduce it by 5% lower than 1990 levels by year 2012 [1]. According to some estimate, atmospheric carbon dioxide concentration has increased from 280 ppm in the pre-industrial periods of today’s over 400 ppm accounting for 60% of global warming [2]. Reduction in carbon emissions and promotion of carbon (C) sinks in the biosphere through carbon sequestration are two key activities which can check the increasing level of CO2. The process of removing atmospheric CO2 through the transfer and its secure storage in long lived pools is very vital to check increasing global warming [1]. Tree based land-use practices such as natural forest, plantations and agroforestry systems act as potential carbon sinks, which thus seeks proper design and management [3]. The main carbon pools in tropical forest ecosystems are the living biomass of trees and understory vegetation and the dead mass of litter, woody debris and soil organic matter [4]. Vegetation in tropical forests nevertheless has a significantly higher storage of carbon than any other land cover and therefore, this land use has been the focus of significant research and indeed, tropical rainforests are gaining much more importance by the researchers on carbon stock studies.
Anthropogenic disturbances are the main drivers altering forest structure, creating landscape mosaics, and setting the initial conditions for succession dynamics and structural development [5]. Deforestation and forest degradation results due to different kinds of disturbances. Forest loss releases the carbon stored in trees and contributes to higher levels of CO2in the atmosphere, and also it reduces the remaining amount of forests that can absorb carbon from the atmosphere in the future. Deforestation and forest degradation account for 12 - 17% of global greenhouse gas emissions [1,6]. According to a recent global assessment, more than 60% of the world’s 4 billion ha of forest are recovering from a past disturbance, and 3% of the world’s forests are disturbed annually by logging, fire, pests, or weather [7]. Agricultural expansion has been the most important proximate cause of recent forest loss, accounting for 80% of deforestation worldwide, primarily during the 1980s and 1990s through the conversion of tropical forests [8,9]. Tropical Rainforests are increasingly threatened throughout the tropics by human activities, high rates resulting from a combination of logging and conversion of forest to cash crops or industrial timber plantations [10,11]. Since the major cause of disturbance in these forests is tree felling and burning, the ratio between the basal area of cut trees and total basal area of all trees (including the fallen ones) has been used to quantify the intensity of disturbance [12]. With a few exceptions, relatively intact tropical rainforests only survive today either in a region with very few human inhabitants or in areas set aside for their protection.
In North-East India rainforests are found in the Assam Valley, the foothills of the eastern Himalayas, the lower parts of the Naga Hills, Meghalaya, Mizoram and Manipur, where the rainfall exceeds 2300 mm per annum. Both tropical evergreen and semi evergreen type of rainforests occur in this region. The evergreen rainforests mostly occur in upper Assam and in lower elevation areas of the eastern Himalaya and semi evergreen rainforests are distributed in some parts of the Naga Hills, Meghalaya, Mizoram and Manipur. The Dehing Patkai Rain Forest is the largest tropical evergreen rainforest in North-East India, often referred as “The Amazon of the East” due to its large area and the thick forests. Dehing Patkai Rain Forest stretches for more than 575 km2 in the districts of Dibrugarh, Tinsukia and Sivasagar in Assam. The forest further spreads over in the Tirap and Changlang districts of Arunachal Pradesh. The rainforests of Assam had been subjected to large scale commercial timber collection from the colonial period till the early twentieth century, resulted in the shrinkage of those forests.
Forest ecosystems are the largest pool of biomass and carbon among all terrestrial ecosystems. It has been estimated that about 234 Pg C are stored in the aboveground compartment, 62 Pg C in the belowground compartment, 42 Pg C in the dead woody compartment, 23 Pg C in litter compartment, and a maximum carbon sink of 398 Pg C in the forest soils [13]. These carbon pools are dynamic and change with changes in land-use. Thus, forest degradation and deforestation have a major impact on the forest carbon stock. Mineral extraction (mainly oil and coal), illegal felling and conversion of forest land into agricultural land are the major human induced disturbances still prevailing in these rainforests, affecting the ecosystem functioning as well as a regional CO2 cycle. Biomass and carbon studies are very few and limited in the rain forests of North-East India. Considering disturbance as a major factor, the objective of this paper was to assess the biomass and carbon allocation pattern in the different compartments of the rainforest with an aim to understand the influence of human induced disturbance in total plant biomass production and total carbon stock within the study area. Very little is known about the levels of carbon storage in tropical forests which are under different levels of disturbance and as such, the estimates of carbon stock are important for conservation, sustainable management of forest and enhancement of carbon to consider for Reduction of Emissions from Deforestation and Forest Degradation (REDD+) [14].
Materials and Methods
Description of study area
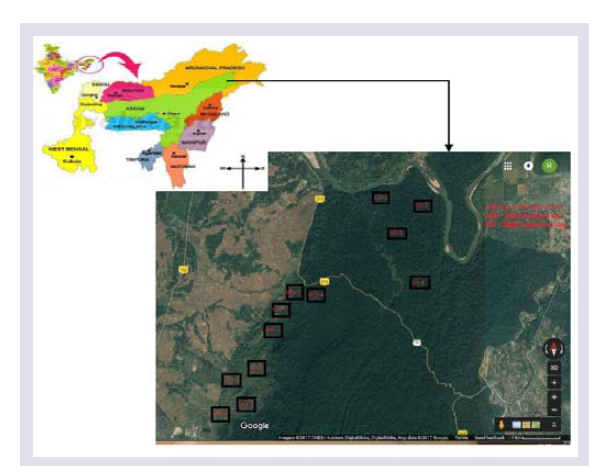
The present study was conducted in Jeypore Reserve Forest, a part of the Dehing-Patkai rainforest under the Dibrugarh Forest Division of Assam, India, which geographically lies approximately between 27°05ʹ - 27°28ʹ N latitude and 95°20ʹ - 95°38ʹ E longitude geological coordinates with a mean altitude of 220 m ASL (Figure 1). The study area falls under humid zone, which is characterized by high precipitation. The average annual rainfall ranges from 2500 to 3600 mm, of which 70% of the total being received between July and September. The mean minimum temperature of the coldest month and the mean maximum of the hottest month are 7 °C and 36 °C respectively. The year has four distinct season viz., a cold and dry winter (December - February), a warm pre-monsoon period (March - May), a humid monsoon period (June - September) and a cool post-monsoon autumn (October - November). The soils of the study sitesare brown, loamy, lateritic ultisol derived from pegmatite rocks [15].
Stratification of the study site and sampling design
After a thorough exploration in the forest, three sites with visible different levels of degradation were selected as Least Disturbed (0 - 10%), Mild Disturbed (10 - 50%) and Highly Disturbed (>50%). Level of disturbance was in terms of stand density (number of productive trees per unit area), where the disturbance index is defined as the as the ratio of basal area of cut stumps to the total basal area, including the total cut stump [16]. The least disturbed (LD) site was within the core area of Jeypore Reserve Forest, while the mildly disturbed (MD) and highly disturbed sites were nearby to the road and on the edge of the reserve forest surrounded by local villages. Human encroachment, felling of trees for timber, collection of fuel wood, grazing, clearing forest land for permanent agricultural settlement were the important disturbances prevailing in the HD site. Fuel wood collection and small scale logging had been observed in MD site and sign of tree felling was very rarely the LD site as being located in the core area of the Reserve Forest. However, collection of Non Timber Forest products (NTFPs) at small scale by the local people was observed at all forest sites.
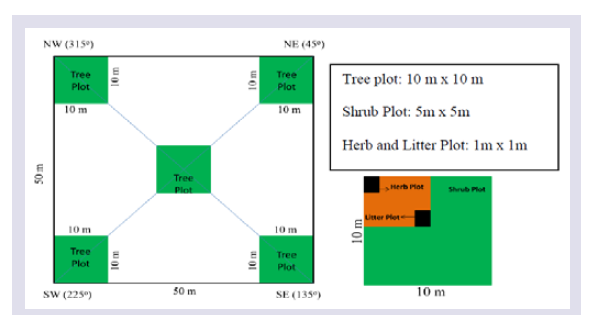
Field inventory for assessment of biomass and carbon stock was carried out in August - October 2015. At each site, four sample plots of size 50 m x 50 m were randomly laid for the phyto-sociological studies. In each sample plot tree were inventoried from 5 sub-plots of 10 m x 10 m size. The shrubs and herbs present in the tree plots were assessed from 5 m x 5 m and 1 m x 1 m quadrat size respectively (Figure 2). Deadwood present in each of tree quadrats was recorded from tree plots and floor litter was collected from the herb quadrats. The plant species which couldn’t be identified in the field were brought to the laboratory and identified with the help of published literatures and Mizoram University herbaria.
Estimation of parameters for vegetation structure
In all the three sites, a total number of sixty 10 m×10 m quadrats were laid down for tree and therein shrubs/saplings quadrats were also inventoried. Name of the species, number of individuals for each species, diameter at breast height (DBH)/collar diameter in case of shrubs and height of each individual were recorded. All tree species with DBH ≤ 5 cm were taken into consideration and DBH was measured at the point of 130 cm above the ground. Shrubs and the tree saplings of less than 5 cm DBH and shorter than 1.5 m were also considered as shrubs. Data were pooled by different plot categories to estimate density (D), frequency (F), abundance (A), Total basal area, and relative values of density, frequency and Total basal area as dominance. Importance value index (IVI) was calculated by summing up the relative values of density (RD), frequency (RF), and dominance (RD) [17]. The species diversity index, concentration of dominance of the community, evenness index and species richness index was calculated using the formula given below [18-21].
a) Shannon-Weiner diversity index, H’:

where,
H’ is the Shannon-Weiner diversity index
pi is the proportion of individuals in the ith species i.e. (ni/N).
b) Simpson Index of Dominance, Cd:

where,
pi is the proportion of individual in the ith species
c) Pielou’s Evenness index, E:

where,
H’ is the Shannon-Weiner diversity index
S is the total number of species
d) Marglef richness index, SRI:

where,
S is the total number of species
N the number of individuals
Aboveground biomass inventory
Aboveground biomass comprise of trees, shrubs/saplings, lianas, herbaceous undergrowth, deadwood and litter components. Tree biomass was calculated using species specific volume equations developed by Forest Survey of India (FSI). For the rest of the species, for which volume equations were not available, the common equation developed by FSI for Assam region was used [22]. Biomass of shrub and saplings with DBH ≤ 5cm was calculated using the following allometric equation [23].

where,
AGBs= Shrub above ground biomass (kg);
D= Collar diameter (cm); and,
H= Total height (m)
Lianas biomass survey was done within the tree quadrats. Only the DBH and individual number was recorded in the field for lianas biomass estimation. The following regression equation was used to estimate the above ground biomass of lianas [24].

where,
AGBl= Lianas Above ground biomass (kg);
BA = Basal area (m2) (or) BA = π × (DBH/2)2;
DBH is diameter at breast height (m)
Standing and fallen deadwood present in the tree quadrats was measured in the field. Tree stumps ≥ 10 cm height was also considered as deadwood. The required numerical parameters like height/length, diameter (top, mid, bottom) to estimate volume, as well as the physical condition (freshly cut, moderately decomposed, highly decomposed and burnt) of deadwood were recorded. The volume of coarse woody debris per area was calculated from the tree quadrats and the following equation was used to obtain the volume of individual stems.

where,
V is volume per stem (cm3);
L is the total length/height of stem (cm); and,
D is the average diameter of the coarse woody debris (cm).
Wood density values of different wood degradation status (i.e. freshly cut, moderately decomposed, highly decomposed and burnt) were considered as 0.48 g cm-3, 0.35 g cm-3, 0.25 g cm-3 and 0.19 g cm-3 respectively [25]. Deadwood biomass measurements were scaled to a per hectare basis (Mg ha-1).
Litter floor biomass was estimated by collecting litter from the 1 m x 1 m quadrats laid within tree quadrats [17]. Fresh weight of the total litter biomass was measured, and a composite sample of 100 g each of leaf and non-leaf components were packed in polyethylene bags and brought to the laboratory for oven drying. Total dry litter biomass were then estimated and scaled to a per hectare basis (Mg ha-1).
For herbaceous biomass estimation, a destructive approach was used on the basis of fresh/dry weight. From the 1 m × 1 m sized quadrates laid down within the tree quadrats, all herbaceous material was harvested and total fresh weight was taken in the field itself [17]. After that, a composite sample of 100 g fresh herbs was packed and brought to the laboratory for oven dry weight estimation. Dry biomass of herbs were then calculated from earlier recorded fresh weights respectively, and also scaled to a per hectare basis (Mg ha-1).
Belowground biomass inventory
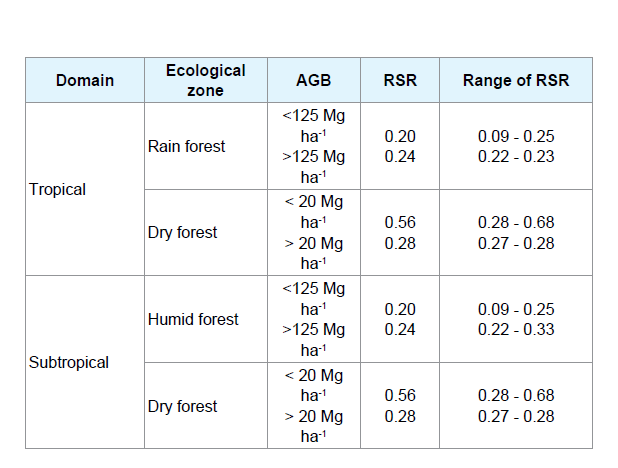
One of the most common methods for belowground biomass estimation is the root to shoot ratio (RSR) in which the root biomass is estimated from easily measured shoot biomass. The total belowground biomass was the sum of all biomass present in each belowground compartment of trees, shrubs/saplings and herbs. Thus, belowground biomass value of each below ground component was estimated by multiplying the AGB value with corresponding RSR as presented in Table 1 [26].
Soil sampling
Soil was collected from each of the sample plots on the three sites for the analysis of physico-chemical characteristics. In each plot, three sampling points were selected randomly and from each point, soils were collected at three depth class viz., 0 - 15 cm, 15 - 30 cm, 30 - 45 cm. The three sub samples at each plot and depth class were bulked to get one composite sample for each depth class per plot. Thus, there were a total of 36 samples (4 plots x 3 sites x 3 depths) from the three sites which were air-dried, ground, passed through a 2 mm sieve and stored in airtight plastic bags. Soil Bulk density from each soil depth class was determined using core method. All the analyses were done by taking three replicates from each depth on a given plot. Soil organic carbon (SOC) percentage was determined following wet digestion method [27].
Estimation of Carbon Stock
Carbon content percentage in herbs and the forest litter biomass were analyzed by Dry Ashing Method [28]. We determined the carbon storages in herbs and litter by multiplying carbon content percentage with dry biomass amount. For trees, shrubs/saplings and deadwood, carbon stock were estimated as 55% of their biomass [29]. SOC stock was calculated following the formula given by IPCC [30]. The total carbon stock was calculated by adding the total biomass carbon and soil carbon stock.

where,
SOC = soil organic carbon content, Mg C ha-1;
SOChorizon = soil organic carbon content for a constituent soil horizon, Mg C ha-1;
[SOC] = concentration of soil organic carbon in a given soil mass, g C (kg soil)-1;
Bulk Density = soil mass per sample volume, Mg m-3;
Depth = horizon depth or thickness of soil layer, m;
frag = % volume of coarse fragments/100, dimensionless.
Statistical Analysis
Data collected in the study were entered and arranged for analysis using Microsoft Excel 2007 version and Statistical package for Social Science (SPSS) software version 17. Analysis of variance (ANOVA) and Least Significant Difference (LSD) post-hoc test were performed to test for significant differences among the variables. Descriptive statistics were used to check the significance of each measured parameter (forest disturbance) and Pearson correlation was used to test the relationship between forest carbon stocks with forest disturbance indicators.
Results
Vegetation inventory and biomass along a disturbance gradient
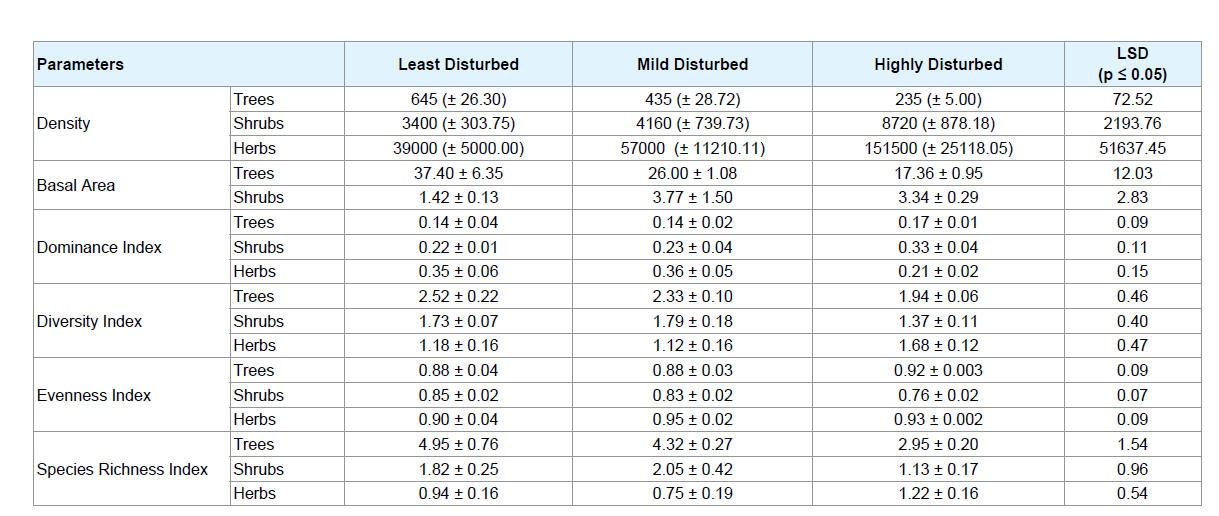
The tree density and importance value index of different tree species encountered in the study plots are shown in Appendix-1. The mean disturbance index calculated in the least disturbed, mildly disturbed and highly disturbed sites were 2.10, 30.14 and 62.04% respectively. The mean stem density and average basal area (BA) varied with different disturbance levels showing a declining trend from the LD sites to the HD sites (Table 2). Tree densities were significantly different (p < 0.05) between the three sites, while the tree basal area cover was significantly between the LD and HD sites. Shrub and herb density values increased significantly from LD sites to HD sites. Simpson’s Dominance Index of trees and shrubs increased from LD to HD sites though not statistically significant. Shannon’s tree diversity decreased from LD to HD sites. Thus, an inverse relationship between tree dominance and diversity was observed between the sites with varied levels of disturbance. Margalef’s tree species richness index also decreased significantly from the LD to HD sites.
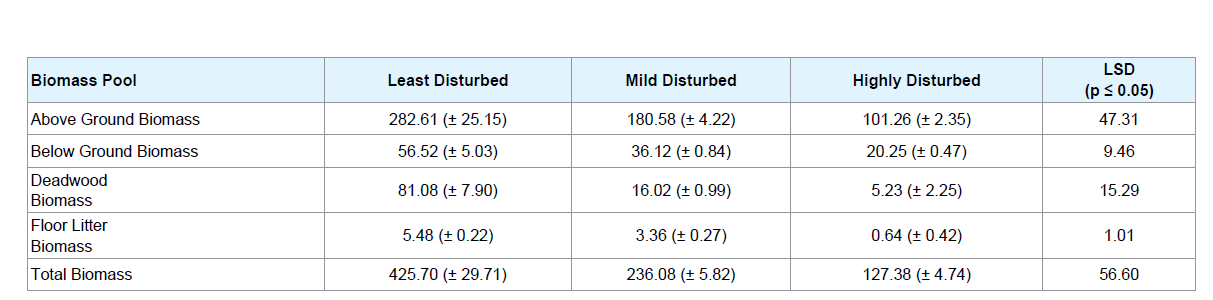
Distribution of plant biomass in different pools across the three sites with varying levels of disturbance is presented in Table 3. Total plant biomass showed a gradual and significant (p < 0.05) decrease from the LD to HD sites. It was observed that on an average, the highest biomass were stored in the LD sites (425.70 Mg ha-1) followed by MD sites (236.08 Mg ha-1) and the least in HD sites (127.38 Mg ha-1). Aboveground biomass constituted a major portion of the total biomass accounting for 66.39, 76.49 and 79.49% in the LD, MD and HD sites respectively. Occurrence of deadwood biomass was significantly greater in the LD sites than the MD and HD sites, owing to less anthropogenic disturbances and less extraction from the forest. Floor litter biomass accumulation was also observed to be significantly (p < 0.05) different in the three study sites with greater values in LD sites followed by MD and HD sites.
Carbon stock along disturbance gradient
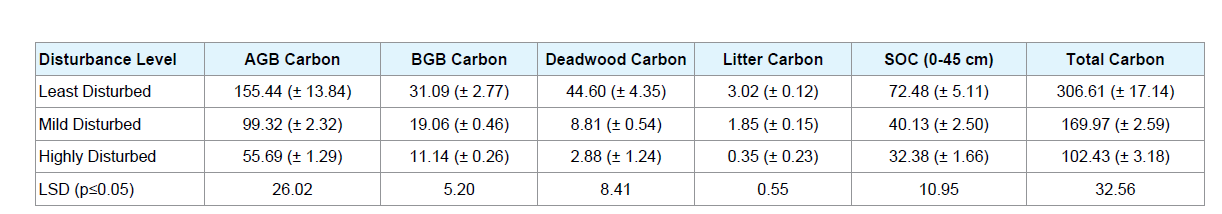
Distribution of carbon stock (Mg C ha-1) different pools across the three study sites with varying levels of disturbance is presented in Table 4. Total carbon storage in sites showed a similar trend as that of the total biomass; showing highest value in the LD site (306.61 Mg C ha-1) and lowest in HD site (102.43 Mg C ha-1). Significant differences were observed in the biomass carbon storage variation along the disturbance gradient, wherein the more carbon storage occurred in the least disturbed sites than highly disturbed sites in each of the carbon pools. Soil organic carbon (SOC) stock in 0 - 45 cm was significantly (p < 0.05) higher in the LD sites than the MD and HD sites. Proportional distribution of carbon stock in different pools showed that more than 60% of the carbon stock is allocated in the living biomass (both aboveground and belowground) in all the sites and more than 20% of total carbon stock was stored in the soil as soil organic carbon (Figure 3). The percentage distribution of deadwood carbon in the sides decreased from the LD sites to HD sites. Similarly, litter carbon contributed the least in the HD sites than the LD sites to the total carbon pools (Table 4).
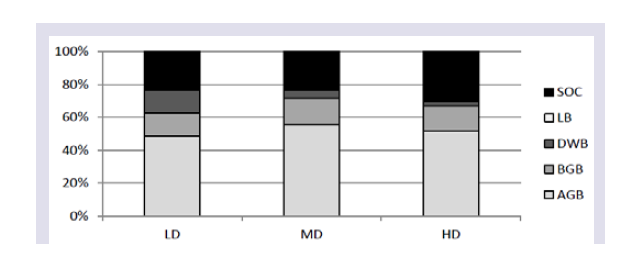
LD: Least Disturbed; MD: Mildly Disturbed; HD: Highly Disturbed; AGB: Above ground Biomass; BGB: Below ground Biomass; DWB: Deadwood Biomass; LB: Litter Biomass; SOC: Soil Organic Carbon.
Correlation of tree diversity with different carbon stock pools
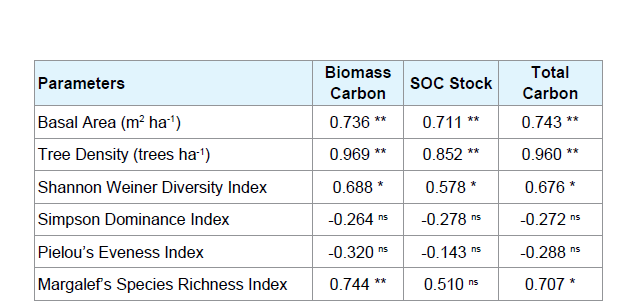
Pearson’s correlation coefficient values of relationship between tree diversity and different carbon pools are presented in Table 5. The basal area and tree density exhibited highly significant positive correlation with carbon stock in different pools. The Shannon Weiner Diversity index also showed a significant positive correlation with the carbon stocks in the study sites, however, no significant correlation was observed in case of Simpson’s dominance and Pielou’s Eveness Index with any of the carbon stock pools. Margalef’s Species Richness index showed significant correlation with the biomass carbon stock but no relationship with the SOC stock.
Discussion
The total biomass and carbon stock in the selected rainforest ranged between 117.19 to 504.65 Mg ha-1 and 94.71 to 343.31 Mg C ha-1 respectively, with the highest being in the least disturbed site followed by mildly and highly disturbed sites. The data in the present study are comparable with the above ground biomass of moist temperate forest of Garhwal Himalaya, Uttarakhand and with the tropical rain forests of Sri Lanka [31,32]. However, the carbon stock values are lower than those reported in Thailand and in the tropical rain forests of Malaysia (225 - 446 Mg C ha-1) [33]. The above ground biomass from the three study sites are less than the range reported for the primary rain forests of Southeast Asia (300 - 500 Mg ha-1), indicating the impact of disturbances on this rainforest [33-35]. Higher biomass and carbon stock in the least disturbed forest than mildly disturbed and highly disturbed sites correspond mainly the higher tree density and basal area in the LD sites, validated by the other studies [36,37].
Belowground biomass (BGB) also forms an important carbon pool for many vegetation types and land use systems. The contribution of BGB to the total biomass was in the range of 12.62 to 16.60%. This is in agreement with the findings of other workers who reported that belowground biomass can reach a maximum of 20-25% in tropical forest ecosystems [38,39]. The carbon stock in the forest floor litter biomass in the present study ranged from 0.007 to 3.229 Mg C ha-1; relatively lower values than reported in the tropical dry evergreen forests of Coromondel coast of South India [40]. The Significant amount of carbon were also found stored in the deadwood in all the forest stands, which ranged from 0.28 Mg C ha-1 (highly disturbed) to 53.95 Mg C ha-1 (least disturbed). Soil carbon pools in the present study form a large reservoir of carbon, next to, above ground biomass carbon pool in all the three forest stands.
The basal area of trees largely contributed to the variations in the total living biomass. Since diameter was used to estimate the individual tree biomass, a stronger relationship between biomass and basal area was established for the trees in the present study. Similar findings have been reported elsewhere [41,42]. Many previous studies also reveal that wood density plays an important role in explaining spatial variation in forest biomass, for most studies with positive relationships [43]. In addition to the change in forest structure, changes in species composition as a result of forest disturbances were also reported as important drivers of forest biomass variations [44]. Forest disturbances influence carbon stored amount of forest through by altering the stand structure and composition [45-48]. Forest disturbance indicators show significant effect on different carbon pools and similar result was reported by Bhatti et al. [49]. The correlation pattern indicated that with the increase in forest disturbance, carbon stock in the different pools decreased [50]. Higher values for carbon stock of various pools in the least disturbed site might be due to the presence of more productive stem density with larger trees [51,52].
Accurate estimation of forest carbon stocks and flux is one of the most scientific bases for successful policy implementation. Our approach in the present study was to estimate carbon stock using proven formulas for the ratio of carbon to biomass instead of measuring carbon directly particularly for the aboveground carbon [29]. Timber volume was converted to biomass, a widely used and accepted method for field measurement of carbon. Human-caused disturbances in tropical rainforests of northeast India such as selective timber extraction and fuelwood collections are some drivers of carbon loss in the highly disturbed forest sites. These activities, however, have a low impact on the biomass carbon stock on a per hectare basis, but when these human-induced activities take place over a large forest area, the total carbon emission could be significant [53]. Although few recent studies have clearly highlighted the importance of potential rapid losses of carbon, to date, there are few quantitative estimates of the possible magnitude of disturbance-induced carbon losses [54]. Some studies report intense slash-and-burn fires can convert almost 40% of the aboveground carbon to carbon emissions [54]. Carbon losses from felled trees that are abandoned in the forests, trees incidentally damaged during felling are reported to make up to 51% of the total emissions in harvested activity [55]. These figures reported elsewhere provide some insight on the magnitude of carbon loss due to anthropogenic disturbances. According to Global Footprint Network (GFN) carbon uptake by forests is the single method to offset greenhouse gas emissions [56,57]. The GFN currently estimates the uptake rate to be 0.97 metric tons of carbon per hectare of forest per year. This implies that efforts have to be made to plant dense forests over half of Earth’s land to bring our ecological footprint into balance. The implementation of REDD+ involving local communities around the rainforests in northeast India will certainly be helpful in addressing emission reductions from activities resulting deforestation and forest degradation. As forests store about 80% of aboveground and 40% of all belowground terrestrial organic carbon these ecosystems are crucial to maintaining the global carbon balance and mitigating climate change [4]. Our findings suggest that the disturbed rainforest stands which still have low DBH values have a greater tendency to build biomass and therefore have the potential to sequester more carbon in the future, if provided protection from anthropogenic disturbances. However, more studies are required to critically understand disturbance regimes and their impact to better quantify regional carbon dynamics.
Conclusion
The results depict a wide variation in carbon stock between different forest sites showing an inverse relation between the density of carbon stocks and the level of disturbance. The higher tree density in the least disturbed sites than other sites and higher significant relationships between basal area with biomass carbon and SOC stock in the present study further confirms the important role played by dominant tree species in contributing more to the carbon storage in the tropical rain forest. The lower carbon stocks in the highly disturbed forest sites nevertheless were due to anthropogenic disturbances which affected forest productivity in the stands. Trees and other woody forest components lock atmospheric carbon dioxide in the form of carbon and hence they reduce atmospheric greenhouse gas accumulation. The study, therefore recommends regular monitoring of these forests stands for their carbon stock changes over time in different pools so that suitable silviculture treatments are prescribed to enhance carbon stock in the tropical rainforest of Northeast India.
References
- Intergovernmental Panel on Climate Change (2007) Climate change 2007: synthesis report. In: Pachauri RK, Reisinger A (Eds), Contribution of working groups I, II and III to the fourth assessment report of the Intergovernmental Panel on Climate Change. IPCC, Geneva, Switzerland, pp. 104.
- Shakun JD, Clark PU, He F, Marcott SA, Mix AC, et al. (2012) Global warming preceded by increasing carbon dioxide concentration during the last deglaciation. Nature 484: 49-54.
- Montagnini F, Nair PK (2004) Carbon sequestration: an underexploited environmental benefits of agroforestry systems. Agrof Syst 61: 281-295.
- Intergovernmental Panel on Climate Change (2001) Climate change 2001: the scientific basis. Working Group I, Cambridge University Press, UK.
- Swanson ME, Franklin JF, Beschta RL, Crisafulli CM, DellaSala DA, et al. (2011) The forgotten stage of forest succession: early successional ecosystems on forest sites. Front Ecol Environ 9: 117-125.
- van der Werf GR, Randerson JT, Giglio L, Collatz GJ, Mu M, et al. (2010) Global fire emissions and the contribution of deforestation, savanna, forest, agricultural, and peat fires (1997- 2009). Atmos Chem Phys 10: 11707-11735.
- Food and Agriculture Organization (2006) Global forest resources assessment 2005: Progress towards sustainable forest management. FAO Forestry Paper 147, Rome.
- Gibbs HK, Brown S, Niles JO, Foley JA (2007) Monitoring and estimating tropical forest carbon stocks: making REDD a reality. Environ Res Lett 213: 045023.
- Houghton RA (2007) Balancing the global carbon budget. Annu Rev Earth Planet Sci 35: 313-347.
- Achard F, Eva HD, Stibig HJ, Mayaux P, Gallego J, et al. (2002) Determination of deforestation rates of the world’s humid tropical forests. Science 297: 999-1002.
- Corlett RT (2011) Impacts of warming on tropical lowland rainforests. Trends Ecol Evol 26: 606-613.
- Kanzaki M, Yoda K (1986) Regeneration in subalpine coniferous forests: II. mortality and the pattern of death of canopy trees. Bot Mag Tokyo 99: 37-51.
- Kindermann G, Obersteiner M, Sohngen B, Sathaye J, Andrasko K, et al. (2008) Global cost estimates of reducing carbon emissions through avoided deforestation. Proc Natl Acad Sci U S A 105: 10302-10307.
- Baishya R, Barik SK, Upadhaya K (2009) Distribution pattern of aboveground biomass in natural and plantation forests of humid tropics in northeast India. Trop Ecol 50: 295-304.
- Barbhuiya AR, Arunachalam A, Pandey HN, Khan ML, Arunachalam K (2012) Fine root dynamics in undisturbed and disturbed stands of a tropical wet evergreen forest in northeast India. Trop Ecol 53: 69-79.
- Rao P, Barik SK, Pandey HN, Tripathi RS (1990) Community composition and tree population structure in a sub-tropical broad-leaved forest along a disturbance gradient. Vegetatio 88: 151-162.
- Misra R (1968) Ecology work book. Oxford and IBH publishing Company, New Delhi, pp. 242.
- Shannon CE, Weaver W (1949) The mathematical theory of communication. University of Illinois Press, Urbana, USA, pp. 117.
- 19.Simpson EH (1949) Measurement of diversity. Nature 163: 688.
- Pielou EC (1966) Species-diversity and pattern diversity in the study of ecological succession. J Theor Biol 10: 370-383.
- Margalef R (1968) Perspectives in ecological theory. University of Chicago Press, Chicago, USA, pp. 111.
- Forest Survey of India (1996) Volume equations for forests of India, Nepal and Butan. Ministry of Environment & Forests, Government of India, pp. 249.
- DeWalt SJ, Chave J (2004) Structure and biomass of four lowland neotropical forests. Biotropica 36: 7-19.
- Ali A, Xu MS, Zhao YT, Zhang QQ, Zhou LL, et al. (2015) Allometric biomass equations for shrub and small tree species in subtropical China. Silva Fennica 49: 1-10.
- Delaney M, Brown S, Lugo AE, Torres-Lezama A, Quintero NB (1998) The quantity and turnover of dead wood in permanent forest plots in six life zones of Venezuela. Biotropica 30: 2-11.
- Mokany K, Raison RJ, Prokushkin AS (2006) Critical analysis of root: shoot ratios in terrestrial biomes. Glob Change Biol 12: 84-96.
- Walkley A, Black IA (1934) An examination of the Degtjareff method for determining soil organic matter, and a proposed modification of the chromic acid titration method. Soil Sci 37: 29-38.
- Akbar MH, Ahmed OH, Jamaluddin AS, Majid NM, Abdul-Hamid H, et al. (2010) Differences in soil physical and chemical properties of rehabilitated and secondary forests. Am J Applied Sci 7: 1200-1209.
- Brown S (1997) Estimating biomass and biomass change of tropical forests: a primer. FAO Forestry Paper – 134. Food and Agriculture Organization of the United Nations, Rome, Italy.
- Intergovernmental Panel on Climate Change (2003) Good practice guidance for land use, land-use change and forestry. Task Force on National Greenhouse Gas Inventories, Kanagawa, Japan.
- Gairola S, Sharma CM, Ghildiyal SK, Suyal S (2011) Live tree biomass and carbon variation along an altitudinal gradient in moist temperate valley slopes of the Garhwal Himalaya (India). Curr Sci 100: 1862-1870.
- Brown S, Lugo AE (1989) The storage and production of organic matter in tropical forests and their role in global carbon cycle. Biotropica 14: 161-187.
- Terakunpisut J, Gajaseni N, Ruankawe N (2007) Carbon sequestration potential in aboveground biomass of Thong Pha Phum National Forest, Thailand. Appl Ecol Environ Res 5: 93-102.
- Tatuo K, Tsunahide S (1967) Primary production and turnover of organic matter in different ecosystems of the western Pacific. Jap J Ecol 17: 70-87.
- Kato R, Tadaki Y, Ogawa H (1978) Plant biomass and growth increment studies in Pasoh Forest Reserve. Malays Natl J 30: 211-214.
- Yves L, Andreas E, Markku K, Agung MW (2010) Land-scape variation in structure and biomass of the hill dipterocarpus forests of Sumatra: implications for carbon stock assessments. For Ecol Manage 259: 505-513.
- Agnihotri R, Prasad R, Prasad R, Aggarwal RD (2006) Effect of aspect and physiograhic position of vegetation cover in a Shiwalik watershed at Relmajra, Panja. Ind J For 29: 9-13.
- Bora N, Nath AJ, Das AK (2013) Aboveground biomass and carbon stocks of tree species in tropical forests of Cachar district, Assam, Northeast India. Int J Ecol Environ Sci 39: 97-106.
- Santantonio D, Hermann RK, Overton WS (1997) Root biomass studies in forest ecosystems. Pedobiologia 17: 1-31.
- Swamy HR, Proctor J (1994) Rain forests and their soils in the Sringeri area of the Indian Western Ghats. Glob Ecol Biogeogr Lett 4: 140-154.
- Baraloto C, Rabaud S, Molto Q, Blanc L, Fortunel C, et al. (2011) Disentangling stand and environmental correlates of aboveground biomass in Amazonian forests. Glob Chang Biol 17: 2677-2688.
- Lin D, Lai J, Yang B, Song P, Li N, et al. (2015) Forest biomass recovery after different anthropogenic disturbances: relative importance of changes in stand structure and wood density. Eur J For Res 134: 769-780.
- Baker TR, Phillips OL, Malhi Y, Almeida J, Arroyo L, et al. (2004) Variations in wood density determines spatial patterns in Amazonian forest biomass. Glob Chang Biol 10: 545-562.
- Marin-Spiotta E, Ostertag R, Silver WL (2007) Long-term patterns in tropical reforestation: plant community composition and aboveground biomass accumulation. Ecol Appl 17: 828-839.
- Dale VH, Joyce LA, Mcnulty S, Neilson RP, Ayres MP, et al. (2001) Climate change and forest disturbances: climate change can affect forests by altering the frequency, intensity, duration, and timing of fire, drought, introduced species, insect and pathogen outbreaks, hurricanes, windstorms, ice storms, or landslides. Bioscience 51: 723-734.
- Goward SN, Masek JG, Cohen W, Moisen G, Collatz GJ, et al. (2008) Forest disturbance and North American carbon flux. Earth Space Sci News 89: 105-106.
- Kurz WA, Dymond CC, Stinson G, Rampley GJ, Neilson ET, et al. (2008) Mountain pine beetle and forest carbon feedback to climate change. Nature 452: 987-990.
- Thong P, Pebam R, Sahoo UK (2016) Recovery pattern of vegetation during succession following slash and burn agriculture in Mizoram, North-East India. J Plant Biol Soil Health 3: 1-8.
- Bhatti JS, Apps MJ, Jiang H (2002) Influence of nutrients, disturbances and site conditions on carbon stocks along a boreal forest transect in central Canada. Plant Soil 242: 1-14.
- Bradford JB, Fraver S, Milo AM, D’Amato AW, Palik B, et al. (2012) Effects of multiple interacting disturbances and salvage logging on forest carbon stocks. For Ecol Manage 267: 209-214.
- Mwakisunga B, Majule AE (2012) The influence of altitude and management on carbon stock quantities in rungwe forest, southern highland of Tanzania. Open J Ecol 2: 214-221.
- Evrendilek F (2004) An inventory-based carbon budget for forest and woodland ecosystems of Turkey. J Environ Monit 6: 26-30.
- Pearson TR, Brown S, Casarim FM (2014) Carbon emissions from tropical forest degradation caused by logging. Environ Res Lett 9: 1-11.
- Fearnside PM (2000) Global warming and tropical land-use change: greenhouse gas emissions from biomass burning, decomposition and soils in forest conversion, shifting cultivation and secondary vegetation. Clim Change 46: 115-158.
- de Andrade RB, Balch JK, Parsons AL, Armenteras D, Roman-Cuesta RM, et al. (2017) Scenarios in tropical forest degradation: carbon stock trajectories for REDD. Carbon Balance Manag 12: 6.
- Blomqvist L, Brook BW, Ellis EC, Kareiva PM, Nordhaus T, et al. (2013) Does the shoe fit? Real versus imagined ecological footprints. PLoS Biol 11: e1001700.
- Rees WE, Wackernagel M (2013) The shoes fits, but the footprint is larger than Earth. PLoS Biol 11: e1001701.