
Research Article
Medical Driving Assessment Outcomes in Seniors Using The KSCAr+Drive: An In-Office Screening Tool to Assist Clinicians in Determining Driving Safety and Who to Refer for Medical Driving Assessments
Lindy Kilik1-3*, Jennifer N. Fogarty4,5 and Robert W. Hopkins2
- 1Seniors Mental Health Program, Providence Care Hospital, Canada
- 2Department of Psychiatry, Queen’s University, Canada
- 3Department of Psychology, Queen’s University, Canada
- 4Western University, Canada
- 5Parkwood Institute, Canada
*Address for Correspondence: Lindy A. Kilik, Seniors Mental Health Program, Providence Care Hospital, P. O. Bag 603, Kingston, Ontario- K7L 4X3,Canada, Tel: 613 544 4900; Fax: 613 548 5569; E-mail: kilikl@queensu.ca
Citation: Kilik L, Fogarty JN, Hopkins RW. Medical Driving Assessment Outcomes in Seniors Using The Kscar+Drive: An In-Office Screening Tool to Assist Clinicians in Determining Driving Safety and Who to Refer for Medical Driving Assessments. J Parkinsons Dis Alzheimer Dis. 2018;5(2): 5.
Copyright: © 2018 Kilik L, et al. This is an open access article distributed under the Creative Commons Attribution License, which permits unrestricted use, distribution, and reproduction in any medium, provided the original work is properly cited.
Journal of Parkinson’s disease & Alzheimer’s disease | ISSN: 2376-922X | Volume: 5, Issue: 2
Submission: 08 September, 2018 | Accepted: 06 October, 2018 | Published: 11 October, 2018
Abstract
Objectives: The purpose of this study was to examine how the KSCAr might be utilized to help identify seniors with MCI/Dementia as safe vs. unsafe to drive, or for whom referral to a medical driving assessment was required; and more specifically, if a subset of the KSCAr subtests could generate clinical evidence to support driving retirement or the need for further driving assessment.
Methods: Thirty patients from two Ontario Geriatric programs (Kingston and London) who were referred for and completed a Medical driving assessment (DriveABLE) received a cognitive assessment that included the KSCAr. KSCAr scores were compared between those who passed/failed the road test. The KSCAr subtests that differentiated between those who passed/failed the road test using t-tests were then selected to comprise the “Drive Score”. Discriminant function analysis was used to determine optimum cutoff scores for three groups: “PASS”, “FAIL” and “GREY ZONE” (where a road test was deemed appropriate).
Results: Of the total sample, 41.4% failed the road test, including all female participants. Eight KSCAr sub-tests differentiated the PASS/FAIL groups, resulting in the Drive Score sub-scale. Optimal cut-off scores for each of PASS, FAIL and GREY ZONE groups were determined with the following prediction accuracy rates: PASS (89% accuracy), FAIL (100% accuracy), GREY ZONE (64.3%).
Conclusions: The Drive Score, emerging from the short (20 minute) KSCAr dementia screen offers clinicians a rapid and easy way to include empirically-based outcomes into their consideration of whether their patients with dementia are safe/unsafe to drive or need to be referred for a medical driving assessment, based on the outcome of similar patients who completed a medical driving assessment.
Keywords
Driving; Dementia; Alzheimer’s disease; Cognitive disorders; Cognitive assessment; Assessment of dementia; Geriatric assessment
Introduction
The issue of driving and the elderly is one that continues to receive attention in the research community and in the media. While driving is obviously a mode of transportation, and is often critical in remote areas, it also offers independence and maximum flexibility in our daily lives for the individual, and in our society it is often a source of one’s identity. However, in Ontario (and many other jurisdictions) accident rates for senior drivers have been high and generally proportional to those of new, young drivers [1]. Further, it is estimated that seniors involved in motor vehicle crashes are FOUR TIMES more likely to sustain serious injury, and FOUR TIMES more likely to require supportive care (in-house or institutional) following a motor vehicle accident [2]. It is recommended that physician-patient conversations about driving cessation begin early with seniors, before issues arise [3]. How “early” is early, and when do “issues” arise?
Dementia poses a particular risk for continued driving safety amongst seniors. It is estimated that by 2030 there will be nearly 100,000 licensed Ontario drivers who have developed a dementia [4]. The responsibility to make a judgment about driving safety most often falls to the family physician. In a recent review of typical inoffice driving screens, Molnar, Rapoport, and Mononita concluded that none offered well validated cutting scores for fitness to drive in dementia [5].
Use of various individual psychometric tests to assist physicians with decision-making has also been suggested. In fact, in Ontario, where individuals complete a Ministry of Transportation of Ontario (MTO) assessment every two years, the protocol was changed in April, 2014 to now include two such tests-a clock test and a cancellation task (MTO, Senior Drivers) [6]. However, the tests are provided online with the opportunity to practice these in advance of taking them, and administered in a group format. Hence the validity of the altered administration is yet to be determined. Lee and Molnar reviewed commonly used psychometric tests [7], and describe their clinic protocol, consisting of Trail Making (Parts A & B) [8], drawing intersecting pentagons and the MOCA to be used as part of a multifaceted approach that includes results of psychometric testing and corroborating history related to IADL, ADL, and other functional abilities [9].
When the results are unclear, patients are often sent for a medical driving assessment at a cost of between $600 and a $1000 (in Ontario) that is borne by the patient. The experience is stressful for many patients and often presents a considerable financial burden. Guidelines in the Canadian Medical Association’s “Determining Medical Fitness to Operate Motor Vehicles (9th Edition)” recommend reassessment of driving safety every 6 months once a dementia has been diagnosed [10] . This could mean several such driving assessments for a given individual, along with the associated costs.
The current study examines the utility of the Kingston Standardized Cognitive Assessment-revised [KSCAr] to help identify those seniors who are truly in the “grey zone” of driving safety [11], where a paid medical driving assessment is warranted, thereby reducing unnecessary referrals for medical driving assessments. The KSCAr is a tool aimed at bridging the gap between brief screeners that are non-specific or narrowly focused, such as the mini mental state examination or the MOCA [9,12], and more comprehensive but lengthy and expensive neuropsychological assessments. It is comprised of 19 sub-scales yielding a total score as well as three domain scores (Language, Memory, and Visual-Spatial). It is available in several languages, has a long history of use and sound psychometrics. Hence, a potential natural extension of its use is to aid in driving decision-making.
This work builds on a pilot study looking at retrospective data examining cognitive patterns of patients referred for medical driving assessment [13]. The goal was to determine a subset of the KSCAr sub-tests that would identify three groups: those who passed a road test from an approved medical driving assessment, those who failed the road test and those where prediction was insufficient to make a determination (i.e. those in a “grey zone”) where referral for a medical driving assessment would be appropriate.
Methods
Thirty patients with MCI or dementia who were referred for medical driving assessment were administered the KSCAr as part of a cognitive screening battery and also completed the DriveABLE program in their local community (Kingston or London) [14]. As both Kingston and London had DriveABLE programs, participants were drawn from these programs to provide consistency in methodology for the evaluation of road test performance. While not all participants completed the entire computer portion of the DriveABLE test, all participants completed the road test, as in Ontario the passing or failure of a medical driving assessment requires a road test, and other materials such as the computer DriveABLE data are only used for consideration. To promote further generalizability to other, non-DriveABLE programs, only the road test results were used in the analysis. Two groups were formed based on the road test outcome; those who passed, and those who failed. One participant was excluded from subsequent analyses after receiving a road test outcome of a “conditional pass requiring additional remediation”, for a resulting sample size of 29.
One-tailed t-tests were used to compare performance between the groups of those who passed and those who failed the road test on each of the 19 sub-tests that make up the KSCAr. Those sub-tests where Passed or Failed groups significantly differed were then extracted and combined to form the “Drive Score”. A discriminant function analysis was then carried out using the derived Drive Score as the predictor variable of Passed or Failed group membership. Optimal cut-off scores that maximized prediction accuracy with low error rates were derived for Passed and Failed ranges. A GREY ZONE, defined by the range where prediction accuracy was insufficient, was also identified. The KSCAr was renamed to the KSCAr+Drive to reflect the addition of this subscale.
Results
Demographic data are presented in Table 1. The sample was primarily male (89.6%). Gender was not significant for either Age or overall degree of dementia (KSCAr Total Score). However, significantly lower KSCAr total scores were obtained by those who failed the road test, with a mean of 90.29 (SD = 14.92) as compared to those who passed the road test, with a mean of 99.06 (SD = 7.43). These scores were significantly different (t = 2.01, p = 0.03) denoting greater cognitive impairment in those individuals who failed the road test.
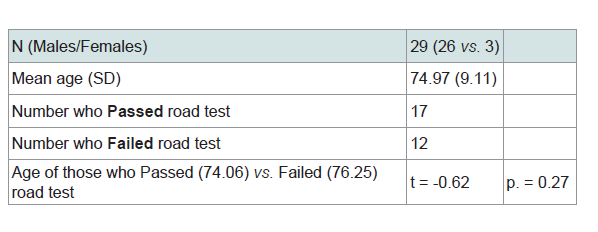
Results of the road test outcomes showed a 41.4% overall failure rate; all of the female participants failed the road test.
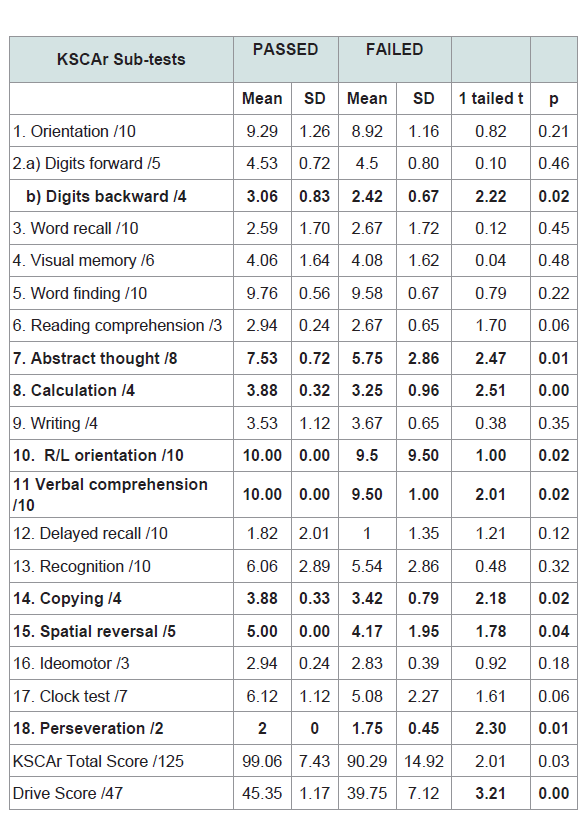
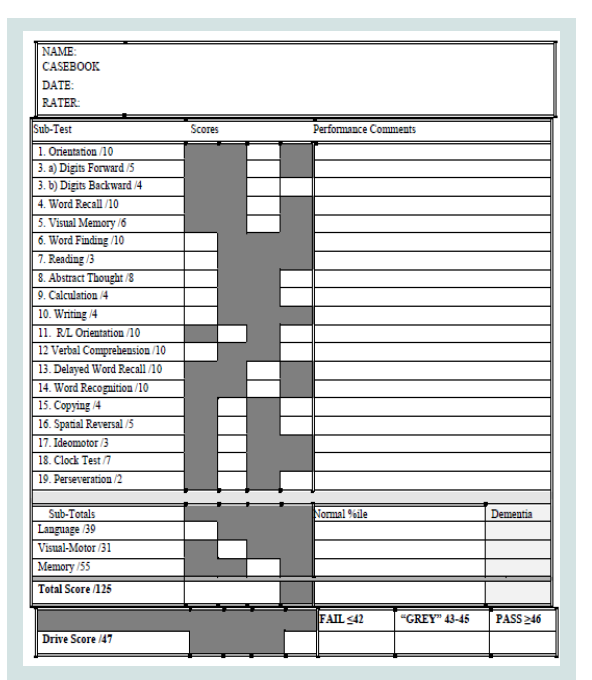
The 19 KSCAr sub-test means, standard deviations, and t-tests between Pass/Fail road test groups are presented in Table 2. The groups differed on 8 of the 19 sub-tests. These sub-tests were: digits backwards, abstract thought, calculation, right/left orientation, verbal comprehension, copying, spatial reversal, and perseveration, with a maximum total score of 47 (Figures 1). The averaged sum of these 8 sub-tests was 45.35 (SD = 1.13) for those who passed the road test, and 39.75 (SD = 6.82) for those who failed. These scores were significantly different (t = 3.21 p < 0.00). Further, Glass’ effect size value (delta = 0.79) suggested a moderate-to-high practical significance [15]. The sum of these 8 sub-tests (heretofore referred to as the Drive Score) was used as the predictor variable for the discriminant function analysis shown in Table 3.
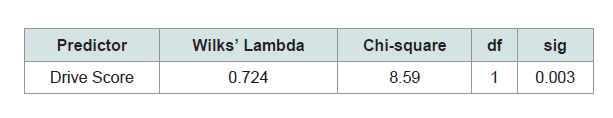
A standard discriminant function analysis was performed using the Drive Score as the predictor of membership in one of the two road test outcome groups (i.e. Pass / Fail). There were no instances of missing data. One discriminant function was calculated that accounted for 79.3% of the variance (X2 =8.59, 1df, p < 0.003).
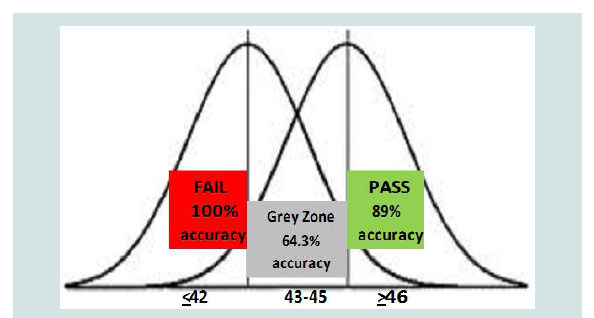
The results of the discriminant function analysis were then further explored to determine optimal cutoff scores for each of three designations: Pass, Fail, Grey Zone (Figures 1). The optimal “Pass” cutoff score of ≥ 46 yielded an 89% accuracy rate, with one case misclassified as a Pass on the road test when the actual outcome was a Failure. The optimal “Fail” cutoff score was determined to be ≤ 42, yielding a 100% accuracy rate: all individuals with scores in this range failed the road test. Scores in the range of 43-45 resulted in a prediction accuracy of 64.3%. This score range was designated as the “Grey Zone” where the Drive Score predictive accuracy was insufficient to use in making a clinical decision about safe driving. These score ranges are provided in Figures 1.
Conclusion
The aim of this study was to provide clinicians with a tool to be used to aid in making clinical decisions around driving safety for patients with MCI/Dementia. Using actual road test outcomes of patients referred for medical driving assessments, the goal was to identify those patients who would be most likely to pass, or fail a medical road test and also to provide guidance when trying to determine whether a patient should be referred for a medical driving assessment. The objective was to minimize unnecessary referrals for medical driving assessments that are both stressful and costly. A subset of the KSCAr sub-tests (the Drive Score) was found to correctly predict Pass/Fail road test outcomes at an overall rate of 79.3% of cases where MCI/ dementia prompted a referral for medical driving assessment.
Where other measures have been investigated in terms of value in predicting driving safety, the current study sought not only to define pass/fail outcomes, but also to delineate a range of scores where referral for driving assessment was warranted. The simple pass/fail dichotomization has not yielded any measures with adequate predictive ability. For example, Hollis, Duncanson, Kapust, Xi and O’Connor explored the MMSE and MOCA in this regard [9,12,16,17], and found neither could be used as a reliable indicator of driving risk. Further, Molnar et al. identify that the MOCA does not have any cut-off points that have been well validated to predict fitness to drive (albeit they suggest there may be some utility in combining results with other tests/data) [2,18]. Our tri-partite categorization offers a different approach to determining risk.
The 8 sub-tests making up the Drive Score tap spatial-motor abilities, auditory attention, and executive functioning. These sub-tests were: digits backwards (auditory attention), calculation (auditory attention), verbal comprehension (auditory attention), copying (spatial-motor abilities), right/left orientation (spatial-motor abilities), spatial reversal (spatial-motor abilities), abstract thought (executive functioning), and perseveration (executive functioning).
Suggested cut-off scores for PASS (≥46), GREY ZONE (43-45) and FAIL (≤42), were selected to maximize classification accuracy and to help clinicians narrow the range of individuals identified in the “grey zone”, needing a referral for a medical driving assessment. In the PASS range one case was misclassified where the actual outcome was FAIL. This 11% error rate is offered as a reasonable risk level. In the FAIL range all cases were correctly identified.
Those in the GREY ZONE had a correct classification rate of 64%; delineating the Drive Score range where accuracy of prediction for clinical decision-making was insufficient, warranting a referral for medical driving assessment.
All of the females failed the road test despite there being no differences in age or level of cognitive impairment as compared to the males. While this may be the result of a smaller proportion of the sample being female, another possible reason may be that females of that cohort drive less. Hopkins et al. reported that until the 1960s [3], the majority of drivers were men. This cohort effect would then translate into fewer female senior drivers. Traditionally, even when both spouses are licensed, the male has traditionally done more of the driving, as in the case when couples drive in the vehicle together.
In the obtained sample, actual road test outcomes yielded a pass/fail ratio of about 60/40; i.e. approximately 60% of those referred for driving assessment passed the road test and were deemed safe to continue driving. That nearly 60% of individuals were needlessly referred for driving assessment demonstrates there is a strong need for tools that can assist clinicians in deciding who should be referred for such assessments. The KSCAr+Drive is based on a well-researched and widely used dementia screen, and offers the clinician a brief, objective tool to utilize in making a determination about driving safety based on how typically-referred MCI/Dementia patients performed on actual road-tests. It also provides a means to initiate the discussion about driving safety with an individual patient. While many factors need to be considered when making the important decision about driving safety, including diagnosis, consensus guidelines related to IADL and ADL capabilities and safe driving [15], concerns raised by families, etc., the KSCAr+Drive, offers the addition of objective evidence connecting that individual’s score on a screening tool with actual road test performance of referred patients who obtained that same score. The authors recommend beginning the discussion of eventual driving cessation at the point of diagnosis of either MCI (Minor neurocognitive disorder) or dementia (Major neurocognitive disorder), where there is a greater chance that the individual is still safe to drive, such that patients have time to contemplate what life would be like and how to adjust to life without a license, and also to have time to appreciate the criterion against which their performance is being judged. In part, this premise demands early detection. Indeed, while there is no definitive assay for dementia at present, paper and pencil assessment tools have become more and more sensitive, such that MCI/early dementia is routinely diagnosed. This early initiation of driving retirement discussions offers the patient the dignity of potentially choosing when to stop driving, and also reduces the shock of receiving both a progressive diagnosis and a loss of instrumental function at the same time.
Limitations and Future Directions
Although the overall N was adequate, it may have been small for sub-group comparisons; nevertheless, the obtained results were unambiguous. A larger study to replicate findings would demonstrate stability of the results.
Selection bias: study participants were already referred for medical driving assessment owing to an identified concern. However, this reflects how the real-world process occurs, thereby demonstrating ecological validity.
In terms of design limitations: some participants had their Driving Assessment and KSCAr on same day (order counterbalanced); others had the KSCAr administered during the clinic visit where the referral driving assessment was made, such that there was a short lag in time before the road test. The road test was typically within the same month. This difference reflected the varying protocols within clinic practice. Given the KSCAr has shown to be stable for a period of 3 months, re-administering the KSCAr if the initial was completed at the clinic visit would have introduced practice effects; hence the decision was not to repeat the KSCAr over such a short interval.
A second design consideration is the choice to use discriminant function analysis versus logistic regression for the primary analysis. This decision was made acknowledging that meeting all of the assumptions of DFA would be challenging. However, because the questions answered by these two techniques are somewhat different and we were specifically trying to maximize group prediction, we opted for the DFA technique. Further, the literature does present arguments regarding the extreme stringency of statistics such as the Box’s M test to evaluate the homogeneity of variances/co-variance and also the recommendation to utilize DFA in small sample sizes [19,20]. Future validation studies could explore the comparability of the two techniques.
In the study, the KSCAr was administered in its entirety (approximately 20 minutes) and the 8 Drive Score sub-tests were extracted. Future research could examine whether administration of the 8 subtests alone would yield similar results. We have reformatted the KSCAr scoring sheet to allow for Drive Score scoring on the same form and renamed this tool the KSCAr+Drive (Figures 2).
The sample was not balanced with respect to gender: fewer females were referred for medical driving assessment. This may reflect a cohort effect of more male drivers; it may also be that males are more likely to wish to retain their license than women and see driving as an important role or part of their identity.
The initial results obtained in this work have tremendous promise in providing an inexpensive, brief method to screen for driving safety. However, it will also be important to validate these preliminary findings with an independent sample to address any potential bias variance trade-off, thereby establishing the stability of the findings across independent samples.
References
- Tasca L (2008) Ministry of transportation of Ontario crash data 2001-2005. Data presented at Aging Drivers’ Mobility Forum, Toronto, Canada.
- Molnar FJ (2011) Driving and dementia (Webinar). BrainXchange, Canada.
- GAIN Clinic (2014) Are we traumatizing the patient? Discussion driving retirement: The 5-step approach. 2014 RSGS Conference.
- Hopkins RW, Kilik LA, Day DJ, Rows C, Tseng H (2004) Driving and dementia in Ontario: A quantitative assessment of the problem. Can J Psychiatry 49: 434-438.
- Molnar FJ, Rapoport MJ, Roy M (2012) Dementia and driving: Maximizing the utility of in-office screening and assessment tools. CGS J CME 2: 11-14.
- Senior driver’s license renewal program. Ministry of transportation of Ontario, Canada.
- Lee L, Molnar F (2017) Driving and dementia: Efficient approach to driving safety concerns in family practice. Can Fam Physician 63: 27-31.
- Army individual test battery (1944) Manual of Directions and Scoring. War Department, Adjutant General’s Office, Washington, DC, USA.
- Nasreddine ZS, Phillips NA, Bedirian V, Charbonneau S, Whitehead V, et al. (2005) The Montreal cognitive assessment, MoCA: a brief screening tool for mild cognitive impairment. J Am Geriatr Soc 53: 695-699.
- Canadian Medical Association (2017) CMA driver’s guide: determining medical fitness to operate motor vehicles. (9th edn). Ottawa, Joule Inc., Canada.
- Hopkins RW, Kilik LA, Day DJ, Rows CP, Hamilton PF (2004) The revised kingston standardized cognitive assessment. Int J Geriatr Psychiatry 19: 320-326.
- Folstein MF, Folstein SE, McHugh PR (1975) ‘Mini-mental state’. A practical method for grading the cognitive state of patients for the clinician. J Psychiatr Res 12: 189-198.
- Kilik LA, Dey A (2011) Outcomes of medical driving assessments for patients with cognitive impairment referred from a specialty geriatric psychiatry program. Abstract presented at CPA Annual Convention, Toronto, Ontario, Canada.
- DriveABLE.
- Lakens D (2013) Calculating and reporting effect sizes to facilitate cumulative science: a practical primer for t-tests and ANOVAs. Front Psychol 4: 863.
- Hollis AM, Duncanson H, Kapust LR, Xi PM, O’Connor MG (2015) Validity of the mini mental state examination and the montreal cognitive assessment in the prediction of driving test outcome. J Am Geriatr Soc 63: 988-992.
- Montreal (2006) Third canadian consensus conference on diagnosis and treatment of dementia.
- Molnar FJ, Patel A, Marshall SC, Man-Son-Hing M, Wilson KG (2006) Clinical utility of office based cognitive predictors of fitness to drive in persons with dementia: a systematic review. J Am Geriatr Soc 54: 1809-1824.
- Discover which variables discriminate between groups, discriminant function analysis. TIBCO Software Inc., USA.
- Steyn P (2015) Which test: Logistic regression or discriminant function analysis?