
Journal of Parkinsons disease and Alzheimers disease
Download PDF
Review Article
*Address for Correspondence: Sajid Ullah Khan, Comsats Institute of Information Technology, Islamabad, Pakistan, Tel: +923018309271; E-mail: sajid_city@yahoo.com
Citation: Khan SU. Classification of Parkinson’s Disease Using Data Mining Techniques. J Parkinsons Dis Alzheimer Dis. 2015;2(1): 4.
Copyright © 2015 Khan. This is an open access article distributed under the Creative Commons Attribution License, which permits unrestricted use, distribution, and reproduction in any medium, provided the original work is properly cited.
Journal of Parkinson’s disease and Alzheimer's disease | ISSN: 2376-922X | Volume: 2, Issue: 1
Submission: 24 June 2015 | Accepted: 14 July 2015 | Published: 17 July 2015
 Data Understanding
 Feature Selection
 We get the following results attributes. Selected attributes: 1, 2, 3, 6, 13, 15, 19, 20, 21, 22: 10 (Figure 4).
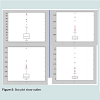
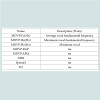 The rest of the operations are only performed on these attributes. The box plot analysis of all the attributes was carried out, The following attributes showed outliers, MDVP: Fhi (Hz), MDVP:RAP, MDVP:APQ, NHR (Figure 5).
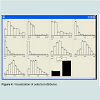
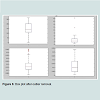
 The outliers were removed and the box plot analysis was performed again, this showed that the outliers were removed successfully (Figure 6).
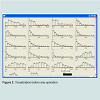
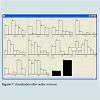
 The Data was visualized again showing a more normal distribution across all attributes (Figure 7).
 Random forest
Classification of Parkinson’s Disease Using Data Mining Techniques
Sajid Ullah Khan*
- Comsats Institute of Information Technology, Islamabad, Pakistan
*Address for Correspondence: Sajid Ullah Khan, Comsats Institute of Information Technology, Islamabad, Pakistan, Tel: +923018309271; E-mail: sajid_city@yahoo.com
Citation: Khan SU. Classification of Parkinson’s Disease Using Data Mining Techniques. J Parkinsons Dis Alzheimer Dis. 2015;2(1): 4.
Copyright © 2015 Khan. This is an open access article distributed under the Creative Commons Attribution License, which permits unrestricted use, distribution, and reproduction in any medium, provided the original work is properly cited.
Journal of Parkinson’s disease and Alzheimer's disease | ISSN: 2376-922X | Volume: 2, Issue: 1
Submission: 24 June 2015 | Accepted: 14 July 2015 | Published: 17 July 2015
Abstract
Parkinson’s disease is a human disease caused by tolerant disorder of the nervous system that affects movement. It grows slowly, occasionally initiated with a scarcely visible tremor in just one hand. But while a tremor may be the most well-known sign of Parkinson’s disease, the disorder also commonly causes stiffness or slowing of movement. Cluster analysis is an iterative process to modify data preprocessing and model parameters until the result achieves the desired properties. Cluster analysis can be realized by a number of algorithms that varysignificantly in their conception to set up a cluster and how to efficiently mark them. Some of the common conceptions of these algorithms are their pre-defined vital features. Parkinson Data Set is obtained from the UCI repository; the data is passed over the data preprocessing phases e.g. data cleaning, recovering missing values and transformed before applying three clustering techniques e.g. KNN, Random Forest, Ada-Boost. The objective of the research effort is to get an accurate model for disease detection.Keywords
Classification; Data mining; Data preprocessing; K-NN; Decision trees; Parkinson’sTools suggested
Matlab; WekaIntroduction
Parkinson’s disease is a deteriorating disease caused by a complaint in the central nervous system from the patient. The indications of the disease rise due to the death of dopamine producing cells in the mid brain. It is an idiopathic disease e.g. it does not have any known cause. The symptoms differ in different stages of the disease but generally they all involve cognitive and behavioral problems. The data set of Parkinson’s patient is available from the UCI repository and data mining operations are applied for classifying the healthy patients from the people having Parkinson’s disease using a set of voice recording values as the attributes of the data set.The following stages of the DM Architecture are used in this work.
1. Data Understanding
2. Data Preparation
3. Data Modeling
4. Evaluation
The three classification techniques used in this work are.
1. K-NN
2. Random Forest
3. Ada-Boost
Related Work
Data mining is being largely used for solving the bioinformatics problems. These include, the gene expression analysis, DNA and protein sequence data analysis and text mining. Various issues that are being faced are related to the incomplete and noisy data, feature selection problem related to dimensionality reduction. Supervised learning (machine learning) is being employed for classification and prediction problems. One of the key problems in machine learning is selecting the effective classifier to classify the given data. Also the selection of algorithm that provides scalability with related to the problem domain is required.Parkinson’s disease has been the focus of data mining researchers for some time now. The literature shows various data mining techniques that have been utilized for Parkinson’s classification. Some researchers have utilized the gene expression of Parkinson’s patients for analyzing the problem. In Wu S et al. the body wireless sensors data has been utilized that uses various sensors attached to patients body and getting the data related to the physical activity [1]. It utilizes the Feed forward Neural Network (FFNN), Naive Bayes and Decision Tree (DT). Later it uses the reputation based voting for integrating these classifiers and selecting on majority voting. The use of voice data has been found to be one of better techniques in finding out the disease. Researchers have used the Parkinson patients’ voice data for classification purpose and to predict whether the voice is of the patient or a healthy person. Using the given method, Bahrepour M et al. has used various classification techniques have been used including factor analysis, decision tree analysis and neural network analysis and then comparing the results, has found the decision tree classification to be the best in the scenario [2].
Support Vector Machines (SVM) [3] has been used as a classifier to distinguish Parkinson patient from healthy ones. Author has used Weka, Lib-svm and Matlab as tools and compared the results. SVM uses a regression technique to find the Maximum Marginal Hyper plane (MMH). The plane is shown using the linear combination support vector points. Ramani GR et al. also studies various classification techniques using various algorithms like binary logistic regression, ID3, C4.5 and Classification & Regression Tree (C-RT), LDA and Random Tree [4].
DM Data Model
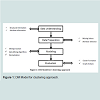
DM data model elaborates the process of applying data mining techniques over the selected data sets across different phases (Figure 1).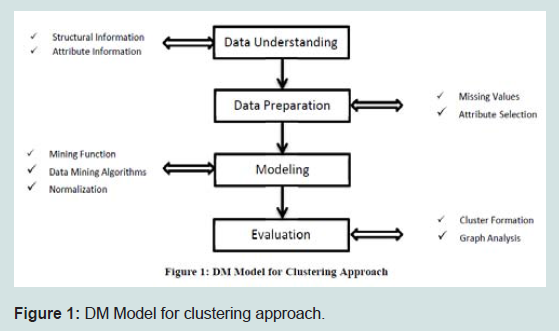
Figure 1: DM Model for clustering approach
The dataset is created by Max Little [5], it is obtained from the UCI repository. The data set consists of biomedical voice measurement of 31 people, 23 out of these 31 have PD, and the total recordingsof these 31 people are represented as 195 rows. The original data set consists of 24 attributes. The 1st attributes is the name of the patient and the 18th attribute is the status of the patient which is 0 for a healthy patient and 1 for a patient with Parkinson’s disease. The other attributes are the voice measures based on these voice measures the actually classification would take place. These include different types of fundamental frequencies, Jitter, shimmer, ratio of noise to tonal components, scaling components, and fundamental frequency measurements. The first task done is to remove the name of the patients from the data set as it is irrelevant, the second task was to remove the status attribute from the data set and make a new variable termed label for the status. The data file is In the CSV format which is converted into the .arff format so that it could be used in WEKA.
Data Preparation
The first step in data preparation is data cleaning so the following steps were followed to make sure that the data was clean.Missing ValuesThe loaded data contained no missing values. So there is no need to fill in the values (Figure 2).
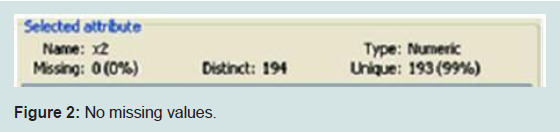
Figure 2: No missing values.
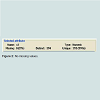
The data set consists of 22 attributes now, Attribute selection is used to pick out only the relevant attributes the attribute evaluator used is Cfs subset eval and the searching method used is best first (Figure 3).
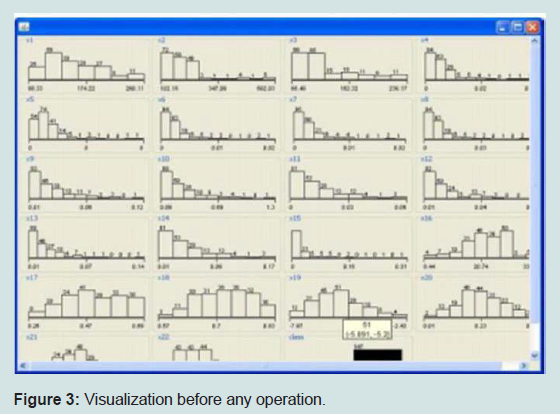
Figure 3: Visualization before any operation.
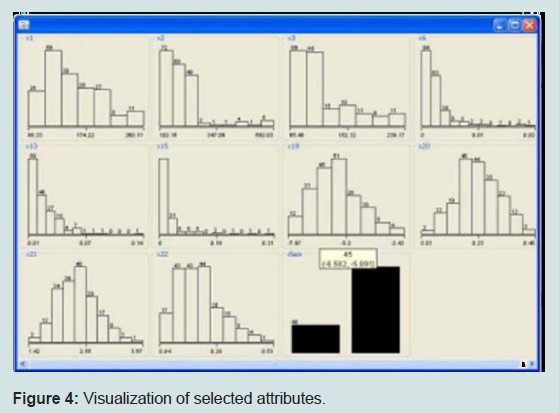
Figure 4: Visualization of selected attributes.
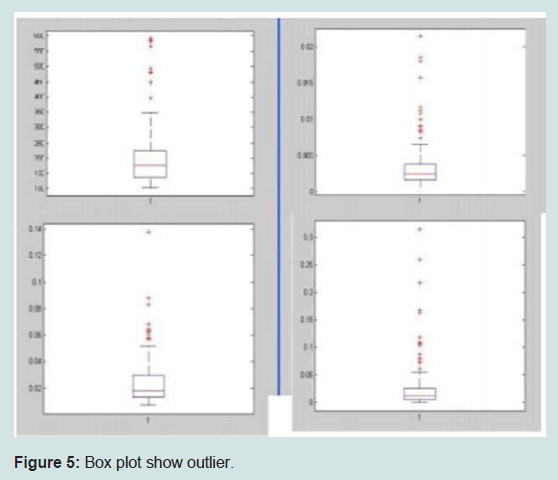
Figure 5: Box plot show outlier.
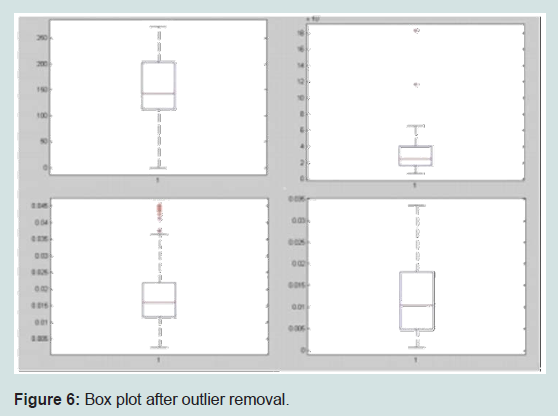
Figure 6: Box plot after outlier removal.
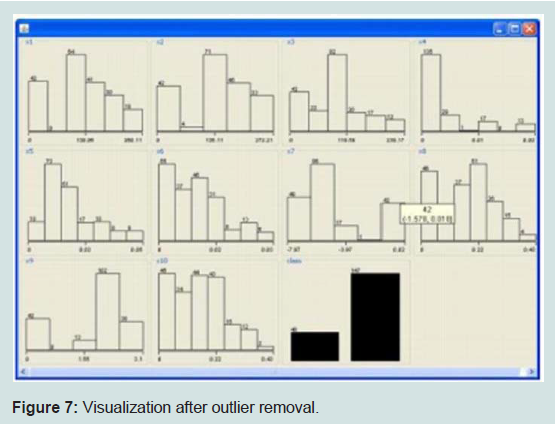
Figure 7: Visualization after outlier removal.
Classification Modeling & Results
The Classification was performed by three methods.K-NN
It is a lazy learning approach that classifies an instance based upon K number of closest neighbors, K was selected as 3, While the distance metric used was Manhattan and K fold validation was used with k=10. This showed an accuracy of 90.2564 %.
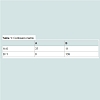
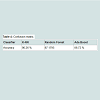
Confusion matrix
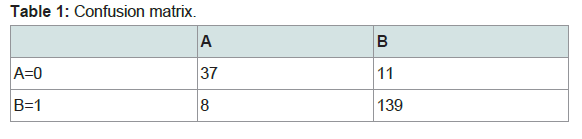
Table 1: Confusion matrix.
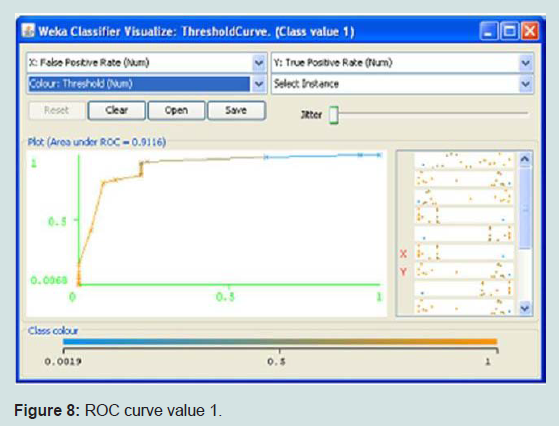
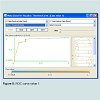
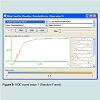
Figure 8: ROC curve value 1.
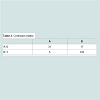
It works by generating several decision trees and combining their result for classification, It is basically a combination of the Bagging idea and the random feature selection idea. The number of trees generated for this data set was 3. K fold validation was used where k=10. This method produced and accuracy of 87.1795 % (Table 2) (Figure 9).
 Boosting
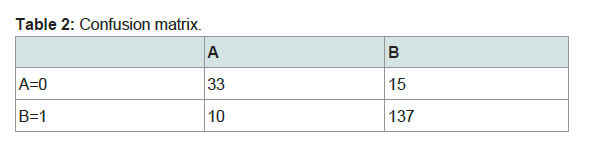
Table 2: Confusion matrix.
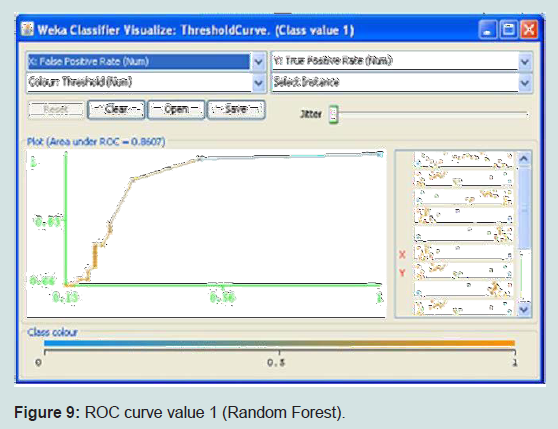
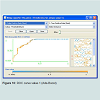
Figure 9: ROC curve value 1 (Random Forest).
It uses many weak learning algorithms to produce the results of a strong learning algorithm, it uses weighted voting. In this example ADABOST was used with the major classifier as decision tree C.45, K fold validation was used where k =10. This gave an accuracy of 88.7179 % (Table 3) (Figure 10). The overall comparison of the three methods is given below (Table 4).The comparison clearly demonstrates that KNN has the higher accuracy.
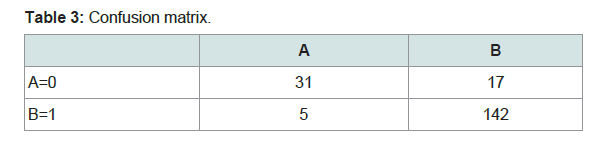
Table 3: Confusion matrix.
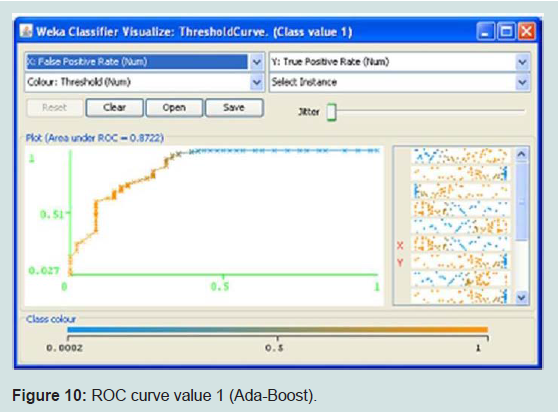
Figure 10: ROC curve value 1 (Ada-Boost).
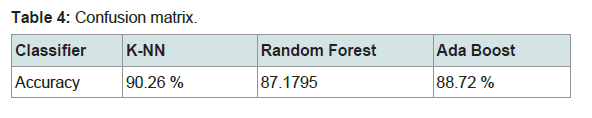
Table 4: Age, Gender and Education Status of Study Participants (RSP;n=119).
Conclusion
We have analyzed the Parkinson disease data set of voice recordings to obtain an accurate classification model, the data ispreprocessed especially irrelevant dimensions and outliers are removed. Once the data is similar to the normal distribution three methods are used to classify the data. K-NN, Random Forest, and Ada-Boost are used. The comparative analysis shows that out of the three K-NN is the best model for classification with accuracy of 90.26% using k=10 fold validation.Future Work
It would be interesting to see the results of the SVM applied on the reduced dataset and its comparison to previous works conducted.References
- Wu S, Guo J (2011) A data mining analysis of the Parkinson ’s disease. iB 3: 71-75.
- Bahrepour M, Meratnia N, Taghikhaki Z, Havinga PJ (2011) Sensor fusion-based activity recognition for Parkinson patients. In Ciza Thomas (Ed.) Sensor Fusion-Foundation and Applications, InTech.
- Bhattacharya I, Bhatia MP (2010) SVM classification to distinguish Parkinson disease patients. A2CWiC '10 proceedings of the 1st Amrita ACM-W celebration on women in computing in India. ACM, New York, NY, USA.
- Ramani GR, Sivagami G (2011) Parkinson disease classification using data mining algorithms. Int J Comput Appl 32: 17-22.
- Little MA, McSharry PE, Roberts SJ, Costello DA, Moroz IM (2007) Exploiting nonlinear recurrence and fractal scaling properties for voice disorder detection. Biomed Eng Online 6: 23.