
Research Article
*Address for Correspondence: Irene D. Bezemer, PHARMO Institute for Drug Outcomes Research, Van Deventerlaan 30-40, 3528 AE Utrecht, Netherlands, Tel: 0307440800; Fax: +49 (0) 221-4971598; E-mail: Irene.Bezemer@pharmo.nl
Citation: Bezemer ID, Leanne MA. Houweling K, Alemao E, Fernie JA. Musculoskeletal Hospital Admission and Surgical Procedure Rates among Patients Treated for Rheumatoid Arthritis in the Netherlands 1999-2012. J Orthopedics Rheumatol. 2016; 3(1): 6.
Copyright © 2016 Bezemer ID, et al. This is an open access article distributed under the Creative Commons Attribution License, which permits unrestricted use, distribution, and reproduction in any medium, provided the original work is properly cited.
Journal of Orthopedics & Rheumatology | ISSN: 2334-2846 | Volume: 3, Issue: 1
Submission: 08 March 2016 | Accepted: 18 April 2016| Published: 23 April 2016
Keywords: Rheumatoid arthritis (RA); Musculoskeletal surgery; Admission rates; All-cause mortality disease-modifying antirheumatic drug (DMARD); Cohort study; PHARMO Database Network
Abbreviations: RA: Rheumatoid Arthritis; TJA: Total Joint Arthroplasty; NTJA: Non-Total Joint Arthroplasty; TJA-AP: Total Joint Arthroplasty- Associated Procedures; DMARD: Disease-Modifying Antirheumatic Drugs; TNF: Tumor Necrosis Factor; IL-1: Interleukin-1; PY: Person- Years; CI: Confidence Intervals; SD: Standard Deviation
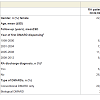
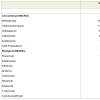
Table 2 lists the DMARDS identified in the Out-patient Pharmacy Database. All DMARD dispensings during the study period were included, so patients on combination therapy or changing therapy appear in multiple cells. Methotrexate was the most frequently observed DMARD among RA patients: 20,864 (64%) users had a record of methotrexate dispensing in the overall RA cohort and in the bio-DMARD subcohort 2,173 (77%) had a methotrexate dispensings record. Besides methotrexate, hydroxychloroquine (42%) and sulfasalazine (30%) had been used by many patients in the overall RA cohort. The order of frequency was slightly different in the bio- DMARD cohort, where methotrexate was followed by sulfasalazine (39%), hydroxychloroquine (27%) and leflunomide (25%). Of the bio-DMARDs, etanercept was used by most patients (6% overall and 66% in the bio-DMARD cohort) followed by adalimumab (2% and 21%, respectively).
The admission rate for musculoskeletal indications was assessed per calendar year. Rates were calculated in the overall RA cohort and matched reference cohort from 1999 and in the bio-DMARD cohort and their matched references from 2003, as before 2003 few bio- DMARD users were observed.
The high rates around 2002 were only observed for hospital admissions; surgical procedure rates among RA patients decreased over the study period from 7.3 surgeries per 100 py (95% CI 6.5-8.2) in 1999 to 2.1 surgeries per 100 py (95% CI 1.9-2.3) in 2012. The corresponding RR decreased from 5.6 (95% CI 4.5-7.1) to 2.4 (95% CI 2.0-2.7) (Figure 1). This trend was similar for all procedure categories. The most frequent surgical procedures were related to repair and plastic operations on joint structures: rates among RA patients were 3.5 surgeries per 100 py (95% CI 2.9-4.2) in 1999 and 1.2 surgeries per 100 py (95% CI 1.1-1.4) in 2012 and corresponding RR 5.5 (95% CI 3.9-7.7) and 2.4 (95% CI 2.0-2.9).
Musculoskeletal Hospital Admission and Surgical Procedure Rates among Patients Treated for Rheumatoid Arthritis in the Netherlands 1999-2012
Irene D. Bezemer1*, Leanne M.A. Kool-Houweling1, Evo Alemao2, Fernie J.A. Penning-van Beest1 and Ron M.C. Herings1
- 1PHARMO Institute for Drug Outcomes Research, Utrecht, Netherlands
- 2Bristol-Myers Squibb International, Princeton, USA
*Address for Correspondence: Irene D. Bezemer, PHARMO Institute for Drug Outcomes Research, Van Deventerlaan 30-40, 3528 AE Utrecht, Netherlands, Tel: 0307440800; Fax: +49 (0) 221-4971598; E-mail: Irene.Bezemer@pharmo.nl
Citation: Bezemer ID, Leanne MA. Houweling K, Alemao E, Fernie JA. Musculoskeletal Hospital Admission and Surgical Procedure Rates among Patients Treated for Rheumatoid Arthritis in the Netherlands 1999-2012. J Orthopedics Rheumatol. 2016; 3(1): 6.
Copyright © 2016 Bezemer ID, et al. This is an open access article distributed under the Creative Commons Attribution License, which permits unrestricted use, distribution, and reproduction in any medium, provided the original work is properly cited.
Journal of Orthopedics & Rheumatology | ISSN: 2334-2846 | Volume: 3, Issue: 1
Submission: 08 March 2016 | Accepted: 18 April 2016| Published: 23 April 2016
Abstract
Objectives: To assess trends in hospitalizations among patients receiving rheumatoid arthritis (RA)-treatment in a 14-year period compared with population references.Methods: Patients treated for RA with any disease-modifying antirheumatic drug (DMARD) between 1999 and 2012 were identified in the PHARMO Database Network. Population controls were randomly matched 2:1 by age, gender and pharmacy. Occurrence rates of musculoskeletal hospitalizations, surgical procedures and mortality were assessed and compared between patients and controls using Poisson regression.
Results: Among 32,829 RA patients, the rate of musculoskeletal surgical procedures decreased from 7.3 (95% CI 6.5-8.2) per 100 person-years (py) in 1999 to 2.1 (95% CI 1.9-2.3) per 100 py in 2012, while the rate among matched reference subjects did not change. The relative rates were 5.6 (95% CI 4.5-7.1) and 2.4 (95% CI 2.0-2.7). In a subcohort of 2,832 RA patients who received a biological DMARD, the relative rate decreased from 18 (95% CI 7-44) in 2003 to 3.9 (95% CI 2.6- 5.8) in 2012. Musculoskeletal admission rates among RA patients were similar in 2012 compared to 1999 but temporarily increased around 2003, while the rate among reference subjects remained stable.
Conclusion: Rates of musculoskeletal surgical procedures among patients treated for RA in the Netherlands decreased from 1999 to 2012. The largest reduction occurred among users of biological DMARDs. Surgical procedure rates in 2012 remained over twice as high for patients with RA as compared to reference subjects and almost four times higher in patients receiving bio-DMARDs.
Keywords: Rheumatoid arthritis (RA); Musculoskeletal surgery; Admission rates; All-cause mortality disease-modifying antirheumatic drug (DMARD); Cohort study; PHARMO Database Network
Abbreviations: RA: Rheumatoid Arthritis; TJA: Total Joint Arthroplasty; NTJA: Non-Total Joint Arthroplasty; TJA-AP: Total Joint Arthroplasty- Associated Procedures; DMARD: Disease-Modifying Antirheumatic Drugs; TNF: Tumor Necrosis Factor; IL-1: Interleukin-1; PY: Person- Years; CI: Confidence Intervals; SD: Standard Deviation
Introduction
Rheumatoid arthritis (RA) is a common chronic inflammatory joint disease that affects approximately 0.5% of the adult population worldwide. This progressive disease is associated with long-term morbidity, disability and shorter life expectancy [1,2]. Patients with RA have higher direct medical costs and hospitalization rates as compared with population references [3]. RA-related surgeries such as total joint arthroplasty (TJA), non-total joint arthroplasty (NTJA), TJA-associated procedures (TJA-AP) and other orthopedic procedures are important outcomes over the course of the illness in terms of costs, physical function and quality of life, but also are a measure of disease progression and treatment effectiveness in RA. In a study including 34,040 RA patient visits from an out-patient rheumatology facility, starting in 1974, 25% of RA patients underwent a TJA within 21.8 years of the disease onset [4]. Among patients who already had one TJA, 25% had a TJA in a different joint within 0.92 years and 50% within 7.0 years. More recent studies show a milder disease course as compared with patients diagnosed earlier, a trend that accompanies the introduction of biological disease-modifying antirheumatic drugs (DMARD) [5-9].The objective of this study was to assess rates of musculoskeletal hospitalizations, surgical procedures and all-cause mortality over time during a 13 year period among patients treated for RA with conventional and biological DMARDs in the Netherlands, and to compare these with population references.
Materials and Methods
SettingData were obtained from the PHARMO Database Network. This database network links drug dispensing records to hospital discharge records and various other data sources [10,11]. For this study, the linked dataset of drug dispensing records to hospital discharge records was used; the study period included the entire period of data availability: January 1, 1999 until December 31, 2012.
Identification of RA patients
A retrospective matched cohort study was conducted. RA patients aged ≥ 18 years were identified by dispensing of any DMARD. The included drugs were based on Dutch treatment guidelines of RA [12] and were categorized as conventional DMARDs (methotrexate, leflunomide, sulfasalazine, azathioprine, hydroxychloroquine, gold preparations) and biological DMARDs (tumor necrosis factor (TNF) inhibitors (etanercept, adalimumab, infliximab, certolizumabpegol, golimumab), interleukin-1 (IL-1) inhibitors (anakinra), interleukin-6 (IL-6) inhibitors (toclizumab) and white blood cell modulators (rituximab, abatacept). Glucocorticoids were not included because these are mainly used in combination with a DMARD and very unspecific for RA. Also note that drugs were only used to identify RA patients and treatment patterns were outside the scope of this study.
As these drugs have alternative indications, additional inclusioncriteria were either a hospital discharge diagnosis of RA (ICD-9- CM 714.0, 714.1, 714.2, 714.81) any time during database follow-up, or at least one dispensing prescribed by a rheumatologist and no hospital discharge diagnosis of any of the alternative indications any time during database follow-up. The list of alternative indications used as exclusion criterion is available upon request. The index date was defined as the date of the first DMARD dispensing within the study period. Both newly treated patients (defined as no DMARD dispensing within one year before the index date) and prevalent patients were included in the RA cohort.
Matched reference cohort
Potential population reference subjects were all individuals in the database aged ≥ 18 years who were not selected in the RA cohort. Reference subjects were matched 2:1 to RA patients on birth year, gender and pharmacy. In addition, they had to be in the database at the matched patient’s index date. This date was also the reference’s index date (“baseline index date”).
RA patients and reference subjects were followed from index date until end of the study period (December 31st, 2012) or end of data collection in the PHARMO Database Network (death, moving out of the PHARMO catchment area or local end of data collection) whichever came first.
Biological DMARD users
RA patients who received a biological DMARD at any time during study follow-up were also studied as a subcohort (bio- DMARD cohort). It should be noted that most of the bio-DMARDs are not distributed through the pharmacies in the Netherlands, but use is recorded in the pharmacy for the purpose of drug monitoring. The bio-DMARD index date may therefore not be exactly the date of starting bio-DMARDs, and further drug utilization assessment was outside the scope of this analysis.
An additional criterion for reference subjects was that if the patient received a bio-DMARD during follow-up, this potential control was still in the database at the time of the first bio-DMARD dispensing. This “bio-DMARD index date” was assigned as a second index date to each RA patient and reference subject.
Outcomes
Musculoskeletal hospital admissions, surgical procedures and allcause mortality (cause of death not available) were assessed during follow-up. Musculoskeletal hospital admissions were defined as a primary discharge diagnosis of arthropathy and related disorders (ICD-9-CM codes 710-719), dorsopathy (ICD-9-CM codes 720- 724), rheumatism, excluding the back (ICD-9-CM codes 725-729) or osteopathies, chondropathies and acquired musculoskeletal deformities (ICD-9-CM codes 730-739).
Musculoskeletal surgical procedures were defined as a primary hospital procedure of surgery on bone, except facial bones (CvV-code 5-78), incisions and excisions of joint structures (CvV-code 5-80), repair and plastic surgery on joint structures (CvV-code 5-81) or surgery on muscle, tendon and fascia of hand and wrist (CvV-code 5-82). Procedures were coded according to the Dutch Classification of Procedures, which is similar to the ICD coding system [13].
Mortality was assessed using information from the Central bureau of Genealogy which includes date of death. Due to privacy constraints, data on mortality have a lag time of 2 years, and for this study data was available up to December 2011. Therefore, only individuals with cohort entry year up to 2011 were included for the mortality analysis.
Statistical analyses
To evaluate the risk of musculoskeletal hospital admissions, surgical procedures and mortality of RA patients compared to reference subjects (and bio-DMARD users compared to their reference subjects), event rates were calculated in each cohort per calendar year during the study period. The observation period for each year was from January 1 or index date, whichever occurred last, until end of follow-up or December 31, whichever occurred first. Event rates per 100 person-years (py) were calculated by dividing the number of events by the sum of days of follow-up in the study cohorts. Two-sided 95% confidence intervals (CI) for rates were derived based on the Poisson distribution {(√(# events))±1}^2. Rates were compared between RA patients and reference cohorts using Poisson regression.
In this study, a proxy was used to identify treated RA patients. The algorithm was sensitive because all individuals receiving outpatient treatment indicated for RA were included, but less specific as patients with alternative indications which were not captured by hospital discharge diagnoses were included as well. In addition, the discharge diagnosis of RA (ICD-9-CM 714) was part of the definition of arthropathy and related disorders (ICD-9-CM codes 710-719) which was one of the outcomes. All event rates were therefore also calculated separately for RA patients with and without a hospital discharge diagnosis of RA any time during database follow-up.
All data were analyzed using SAS programs organized within SAS Enterprise Guide version 4.3 (SAS Institute Inc., Cary, NC, USA) and conducted under Windows using SAS version 9.2.
Results
From among 67,465 individuals who had a DMARD dispensing during the study period, 6,398 (9%) had also a hospital discharge diagnosis of RA any time in their database history or follow-up. In addition, 29,581 (44%) did not have an admission record for RA, but at least one of their DMARD dispensings were prescribed by a rheumatologist. After exclusion of 2,065 patients who had a hospital discharge diagnosis of any of the alternative indications, 33,914 (50%) patients were included in the RA cohort of which 32,829 (97%) could be matched to 2 reference subjects and included in the study. Among the 32,829 RA patients, 77% were newly treated. Most RA patients (67%) were women and the mean age (±SD) at index date was 56 (±15) years (Table 1). Mean (±SD) follow-up was 6 (±4) years after the first DMARD dispensing (same for RA patients and reference subjects).A minority of RA patients (9%) received a bio-DMARD during the study period (Table 1). Their mean (±SD) age at the time of their first bio-DMARD record was 54 (±14) years and 66% were women. Their mean (±SD) follow-up after the first bio-DMARD dispensing was 4 (±3) years.
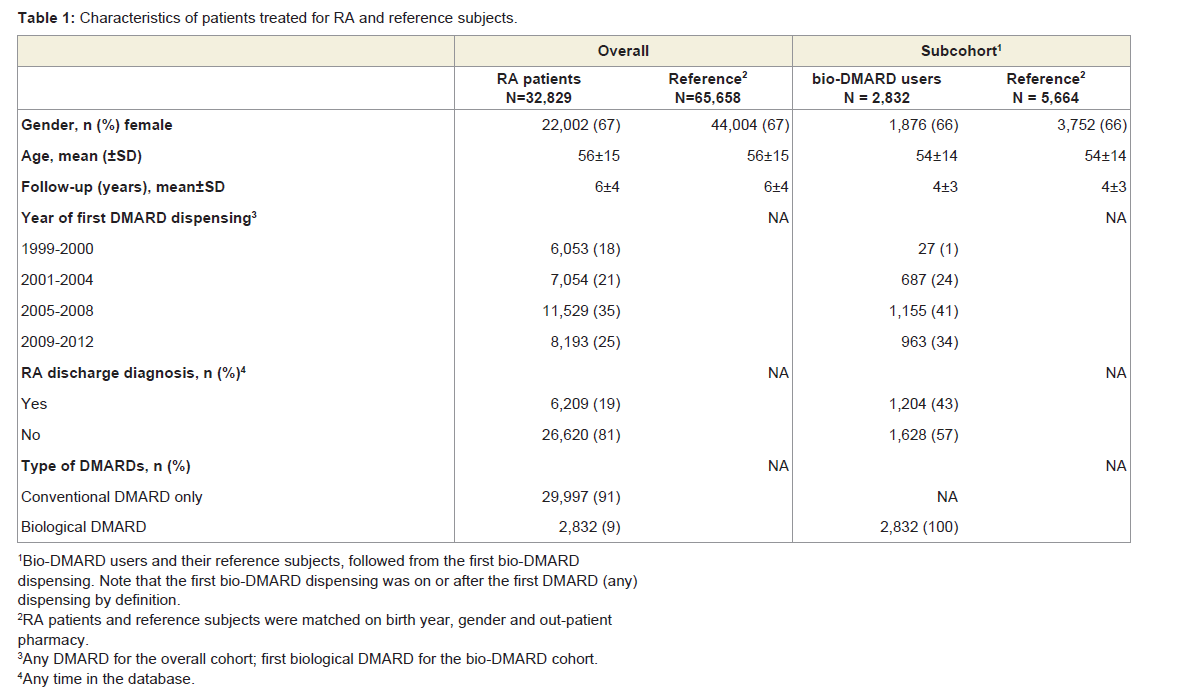
Table 1: Characteristics of patients treated for RA and reference subjects.
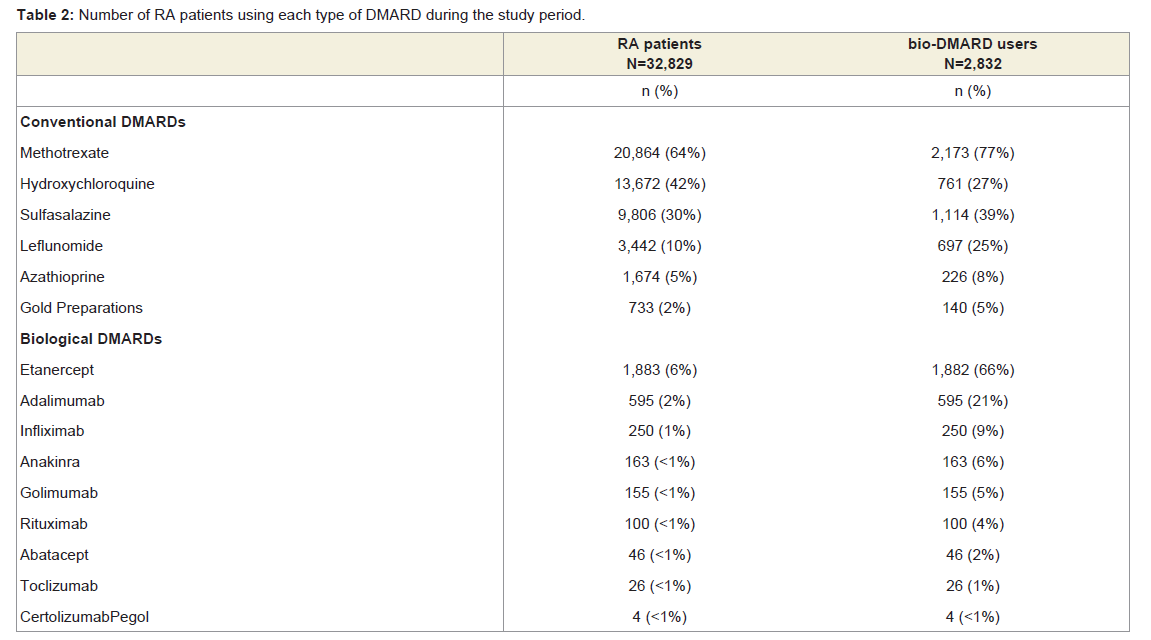
Table 2: Number of RA patients using each type of DMARD during the study period.
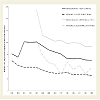
The rate of musculoskeletal admissions among RA patients initially increased from 14 per 100 py (95% CI 13-16) in 1999 to 34 per 100 py (95% CI 32-35) in 2002 and then decreased again to 13 per 100 py (95% CI 13-14) in 2012, while this rate hardly changed among matched reference subjects. The relative rates (RR) were 8.3 per 100 py (95% CI 6.9-10.1) in 1999, 16.7 per 100 py (95% CI 14.5- 19.3) in 2002 and 5.7 per 100 py (95% CI 5.3-6.2) in 2012 (Figure 1). Different trends were observed for the four admission categories: increase to higher rates around 2002 with a decrease thereafter were observed for “arthropathy and related disorders” (28 admissions per 100 py (95% CI 27-29) in 2002 and 9.8 admissions per 100 py (95% CI 9.4-10.2) in 2012), “rheumatism, excluding the back” (2.9 (95% CI 2.5-3.3) and 1.0 (95% CI 0.9-1.1) admissions per 100 py, respectively) and “osteopathies, chondropathies and acquired musculoskeletal deformities” (1.2 (95% CI 0.9-1.4) and 0.7 (95% CI 0.6-0.8) admissions per 100 py, respectively) while the rate of “dorsopathy” admissions gradually increased during the total study period (from 0.7 (95% CI 0.5-1.0) to 1.8 (95% CI 1.6-2.0) admissions per 100 py, respectively).
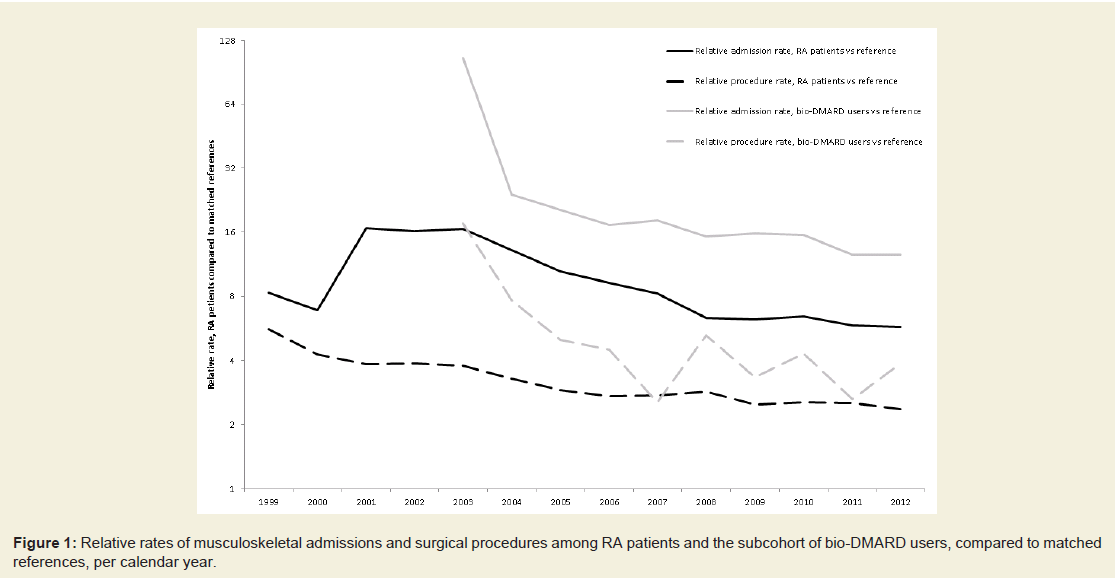
Figure 1: Relative rates of musculoskeletal admissions and surgical procedures among RA patients and the subcohort of bio-DMARD users, compared to matched references, per calendar year.
Among the bio-DMARD users, the rate of musculoskeletal admissions decreased from 89 (95% CI 78-100) per 100 py in 2003 to 40 (95% CI 37-43) in 2012, while this rate hardly changed among matched reference subjects; corresponding RR were 107 (95% CI 44- 258) in 2003 and 13 (95% CI 10-15) in 2012. Also, the rate of surgical procedures decreased from 15 (95% CI 10-19) in 2003 to 3.8 (95% CI 3.0-4.8) in 2012; corresponding RR were18 (95% CI 7-44) in 2003 and 3.9 (95% CI 2.6-5.8) in 2012. The rate of repair and plastic operations on joint structures also decreased but the decrease did not translate into a clear reduction in RR. Clear reductions in RR for bio-DMARD users were observed for “surgery on bone, except facial bones” (10.5 (95% CI 3.6-30.7) in 2003 and 5.4 (95% CI 4.5-6.4) in 2012) and for “incisions and excisions of joint structures” (7.9 (95% CI 4.2-14.8) in 2003 and 4.2 (95% CI 3.4-5.1) in 2012).
The highest rate as well as the largest decrease in rate and RR over the study period was observed for hospital admissions with discharge diagnoses of “arthropathy and related disorders” (see results presented above). However, these conditions (ICD-9-CM 710-719) include ICD-9-CM code 714 which was used to identify RA patients in this study (if recorded any time) and a sensitivity analysis was performed by stratifying on the presence of the diagnosis code. Among patients with a hospital discharge diagnosis code 714 any time during the observation period, the RR of admission for “arthropathy and related disorders” was 32 (95% CI 21-49) in 1999, 69 (95% CI 54- 88) in 2002 and 35 (95% CI 29-43) in 2012. Among patients without this diagnosis code the respective RRs were 2.3 (95% CI 1.5-3.5), 2.6 (95% CI 2.0-3.3) and 2.2 (95% CI 1.9-2.6).
Most RA patients (81%) did not have a hospital discharge diagnosis of RA any time during database follow-up; these patients were identified through the DMARD prescriber and absence of admissions for alternative indications. The admission rates of RA patients with and without a hospital discharge diagnosis of RA any time during database follow-up differed by definition, not only for “arthropathy and related disorders” but for all diagnosis groups. Over the whole study period, the rate of musculoskeletal admissions was 19 per 100 py (95% CI 18-19) in the overall RA cohort, 63 per 100 py (95% CI 62-63) among those with and 4.9 per 100 py (95% CI 4.8-5.0) among those without a hospital discharge diagnosis of RA any time during database follow-up. The decreasing rates and RR were most apparent among the group with a hospital discharge diagnosis of RA. Corresponding rates for surgical procedures were 3.9 (95% CI3.8-4.0) overall, 9.3 95% CI (9.0-9.6) among those with and 2.2 (95% CI 2.1- 2.3) among those without a hospital discharge diagnosis of RA.
All-cause mortality rates slightly increased during the study period among RA patients (0.8 (95% CI 0.6-1.1) per 100 py in 1999 to 1.3 (95% CI 1.2-1.5) in 2012) as well as reference subjects (0.5 (95% CI 0.4-0.7) per 100 py in 1999 to 1.0 (95% CI 0.9-1.1) in 2012) and were higher among RA patients. The relative mortality rate was 1.5 (95% CI 1.4-1.6) over the entire study period. Among the bio-DMARD subcohort, mortality rates were similar.
Discussion
This study assessed the musculoskeletal hospitalization and surgical procedure rates as well as mortality rates among patients treated for RA in the Netherlands between 1999 and 2012. To put these rates in perspective, treated RA patients were matched with general population references to compare the rates. A total of 32,829 treated RA patients were included in the study, with a mean followup of 6 years after starting DMARD treatment. During the study period, a temporary increase in the admission rate was observed among RA patients but not among reference subjects. This temporary increase was not due to an increase in surgical procedure rates, as these decreased steadily over the study years. These results confirm observed trends in other recent population-based studies [5-7].The increased admission rates around 2003 were observed for most musculoskeletal diagnosis groups. As the increase was somewhat stronger among bio-DMARD users than among RA patients without a record of bio-DMARD use, the additional admissions may have been due to the administration of infliximab, which is administered intravenously. Some hospitals code these visits as an admission, others do not. Infliximab was the first bio-DMARD available (registered in 1999), followed by etanercept in 2000 and adalimumab in 2003. The latter two are subcutaneous injections. The introduction of the subsequent bio-DMARDs may explain the decrease in admission rates after 2003.
Biological DMARDs are indicated for patients with active RA who do not respond sufficiently to methotrexate therapy, the first choice in the Netherlands [12]. Probably due to their more severe disease, the surgical procedure rates observed in the bio-DMARD subcohort were higher. This subcohort also had the strongest decrease in surgical procedure rates during the study period. Part of this effect must be explained by the effect of the bio-DMARD treatment itself, but may also reflect a trend towards earlier prescription of bio-DMARDs, i.e. to patients with less advanced disease [12].
During the study period a slight increase in mortality was observed; however note that the study population was ageing as well. The increase was similar among RA patients and reference subjects which excludes an RA-specific trend.
Patients without any RA hospital discharge diagnosis were considered as RA patient when they were prescribed at least one RA drug by a rheumatologist and did not have a hospital discharge diagnosis of any alternative indication. However, as the hospital admission database only includes overnight stays, we likely have missed some of the alternative diagnoses and included patients with other diagnoses than RA. Published prevalence estimates vary in their definitions; a median prevalence of 5 per 1,000 individuals in north Europe was estimated from 6 studies, ranging from 4 to 8 per 1,000 [14]. According to the Dutch Rheuma Foundation, the self-reported prevalence of RA was about 19 per 1,000 individuals in 2010 [15]. According to Dutch primary care reference figures [16], there were about 116,000 RA patients registered in primary care in the Netherlands (among 17 million individuals the prevalence is 7 per 1,000). The algorithm used in our study identified 33,914 RA patients from among 3.2 million individuals: a prevalence of 11 per 1,000 individuals. Part of our study patients may not have been actual RA patients due to the limited specificity in the group without an RA hospital discharge diagnosis. We observed much higher event rates among patients with such a diagnosis; however note that these represent the other extreme as they 1) were partly selected on the outcome and 2) represent patients with more advanced disease. These considerations should be kept in mind when interpreting the findings from this study; the actual rates are likely above the rates reported for the overall RA population but not as high as in the sub-group with a discharge diagnosis.
Strengths of this study include the use of large observational databases which were linked on a patient level. Data were collected from 1999 onwards and up to 14 years follow-up was available. These data are registered as part of routine health care and are used for medical reasons (not for insurance claims) and therefore reflect the health status on an accurate level.
In conclusion, rates of musculoskeletal surgical procedures among patients treated for RA in the Netherlands decreased from 1999 to 2012. The largest reduction occurred during the period when bio-DMARDs were introduced. However, in 2012, surgical procedure rates remained more than twice as high for patients with RA as compared to reference subjects and almost four times higher among patients receiving bio-DMARDs.
Acknowledgements
The authors thank Eline Houben for analytic support and Edwin Hoeben for administrative support. The study was funded by Bristol-Myers Squibb International. Irene Bezemer, Fernie Penning-van Beest and Ron Herings are employees of the PHARMO Institute. Leanne Kool-Houweling was an employee of the PHARMO Institute at the time of the study and article development. This independent research institute performs financially supported studies for government and related healthcare authorities and several pharmaceutical companies. Evo Alemao is an employee of Bristol- Myers Squibb International which funded the study.References
- Carmona L, Cross M, Williams B, Lassere M, March L (2010) Rheumatoid arthritis. Best Pract Res Clin Rheumatol 24: 733-745.
- Gabriel SE, Crowson CS, Kremers HM, Doran MF, Turesson C, et al. (2003) Survival in rheumatoid arthritis: a population-based analysis of trends over 40 years. Arthritis Rheum 48: 54-58.
- Boonen A, Severens JL (2011) The burden of illness of rheumatoid arthritis. Clin Rheumatol 30 Suppl 1: S3-S8.<
- Wolfe F, Zwillich SH (1998) The long-term outcomes of rheumatoid arthritis: a 23-year prospective, longitudinal study of total joint replacement and its predictors in 1,600 patients with rheumatoid arthritis. Arthritis Rheum 41: 1072-1082.
- Hekmat K, Jacobsson L, Nilsson JA, Petersson IF, Robertsson O, et al. (2011) Decrease in the incidence of total hip arthroplasties in patients with rheumatoid arthritis--results from a well defined population in south Sweden. Arthritis Res Ther 13: R67.
- Jamsen E, Virta LJ, Hakala M, Kauppi MJ, Malmivaara A, et al. (2013) The decline in joint replacement surgery in rheumatoid arthritis is associated with a concomitant increase in the intensity of anti-rheumatic therapy: a nationwide register-based study from 1995 through 2010. Acta Orthop 84: 331-337.
- Louie GH, Ward MM (2010) Changes in the rates of joint surgery among patients with rheumatoid arthritis in California, 1983-2007. Ann Rheum Dis 69: 868-871.
- Ward MM (2004) Decreases in rates of hospitalizations for manifestations of severe rheumatoid arthritis, 1983-2001. Arthritis Rheum 50: 1122-1131.
- Welsing PM, Fransen J, van Riel PL (2005) Is the disease course of rheumatoid arthritis becoming milder? Time trends since 1985 in an inception cohort of early rheumatoid arthritis. Arthritis Rheum 52: 2616-2624.
- Herings R, Pedersen L (2012) Pharmacy -based Medical Record Linkage Systems. In: Strom B, Kimmel SE, Hennessy S, (Eds), Pharmacoepidemiology, (5th edn). John Wiley & Sons Ltd, pp. 270-286.
- Herk-Sukel MP, Lemmens VE, Poll-Franse LV, Herings RM, Coebergh JW (2012) Record linkage for pharmacoepidemiological studies in cancer patients. Pharmacoepidemiol Drug Saf 21: 94-103.
- Schipper LG, Hoekstra M, Vliet Vlieland TP, Jansen TL, Lems WF, et al. (2009) Practice guideline 'Diagnosis and treatment of rheumatoid arthritis'. Ned Tijdschr Geneeskd 153: A944.
- Browser - CMSV 2.6 (nl).
- Alamanos Y, Voulgari PV, Drosos AA (2006) Incidence and prevalence of rheumatoid arthritis, based on the 1987 American College of Rheumatology criteria: a systematic review. Semin Arthritis Rheum 36: 182-188.
- Chorus AM, Schokker DF (2011) Nationale Peiling Bewegingsapparaat 2010. Behavioural and Societal Sciences, Leiden.
- nivel (2014) Level Care Registrations First Line. Dutch Institute for Health Services Research.