
Journal of Orthopedics & Rheumatology
Download PDF
Research Article
*Address for Correspondence: Bibiane Steinecker-Frohnwieser, Ludwig Boltzmann Institute for Rehabilitation of Internal Diseases, Saalfelden, Austria, Tel: +43 3685 23037; Fax: +43 3685 22323-142; E-mail:lbi.groebming@aon.at
Citation: Steinecker-Frohnwieser B, Weigl L, Weberhofer G, Kullich W, Kress HG. The Influence of Nuclear Magnetic Resonance Therapy (NMRT) and Interleukin IL1-β Stimulation on Cal 78 Chondrosarcoma Cells and C28/I2 Chondrocytes. J Orthopedics Rheumatol. 2014;1(3): 9.
Copyright © 2014 Steinecker-Frohnwieser B, et al. This is an open access article distributed under the Creative Commons Attribution License, which permits unrestricted use,distribution, and reproduction in any medium, provided the original work is properly cited.
Journal of Orthopedics & Rheumatology | ISSN: 2334-2846 | Volume: 1, Issue: 3Submission: 24 March 2014 | Accepted: 06 May 2014 | Published: 12 May 2014
Reviewed & Approved by: Dr. Guangju Zhai, Department of Genetics, Memorial University of Newfoundland, Canada
The Influence of Nuclear Magnetic Resonance Therapy (NMRT) and Interleukin IL1-β Stimulation on Cal 78 Chondrosarcoma Cells and C28/I2 Chondrocytes
Bibiane Steinecker-Frohnwieser1*, Lukas Weigl2, Gertrude Weberhofer2, Werner Kullich1 and Hans Georg Kress2
- 1Ludwig Boltzmann Institute for Rehabilitation of Internal Diseases, Ludwig Boltzmann Cluster for Rheumatology, Balneology and Rehabilitation, Saalfelden, Austria
- 2Department of Special Anaesthesia and Pain Management, Medical University Vienna, Austria
*Address for Correspondence: Bibiane Steinecker-Frohnwieser, Ludwig Boltzmann Institute for Rehabilitation of Internal Diseases, Saalfelden, Austria, Tel: +43 3685 23037; Fax: +43 3685 22323-142; E-mail:lbi.groebming@aon.at
Citation: Steinecker-Frohnwieser B, Weigl L, Weberhofer G, Kullich W, Kress HG. The Influence of Nuclear Magnetic Resonance Therapy (NMRT) and Interleukin IL1-β Stimulation on Cal 78 Chondrosarcoma Cells and C28/I2 Chondrocytes. J Orthopedics Rheumatol. 2014;1(3): 9.
Copyright © 2014 Steinecker-Frohnwieser B, et al. This is an open access article distributed under the Creative Commons Attribution License, which permits unrestricted use,distribution, and reproduction in any medium, provided the original work is properly cited.
Journal of Orthopedics & Rheumatology | ISSN: 2334-2846 | Volume: 1, Issue: 3Submission: 24 March 2014 | Accepted: 06 May 2014 | Published: 12 May 2014
Reviewed & Approved by: Dr. Guangju Zhai, Department of Genetics, Memorial University of Newfoundland, Canada
Abstract
Introduction: For the last decade the Nuclear Magnetic Resonance (NMR) therapy has turned out a success in pain treatment of patients who suffer from osteoarthritis (OA) of knees or hands, low back pain and osteoporosis, respectively. While clinical outcome could be proved, less is known about the underlying mechanism by which NMRT modulates cellular processes leading to observed pain reduction. This study implements the analysis of potential signal transduction pathways involved in NMRT signal transfer in Cal-78 chondrosarcoma cells and NMRT influencing cell growth and viability of interleukin IL- 1β stimulated Cal-78 cells and C28/I2 chondrocytes. Changes in expression of inflammatory proteins like metalloproteinases MMP1, MMP3, MMP8, MMP9, MMP10 and MMP13, as well as interleukins IL6 and IL8 were evaluated.Methods: Basic pathway analysis was performed by the gene array technology ensued by the reporter-gene technique (Cignal™ Reporter Assay). Cell proliferation was tested by calcein- and eFlour 670 staining; the S-phase of the cells was determined by use of the BrdU assay. Changes in expression of the inflammatory proteins were evaluated by performing quantitative RT-PCR, enzyme immuno assays and luminex measurements.
Results: The interpretation of the gene array combined with the results of the reporter gene assay roughly reveals indices of NMRT influencing the transforming growth factor (TGF)- β and Mitogen Activated Protein (MAP) kinase pathway. The cell growth and viability of both cell lines was not changed by NMRT although their inhibition caused by IL-1β was more pronounced in the absence of NMRT stimulation. Even though IL-1β provably stimulated the increase of the expression of MMPs and ILs, these effects seemed to be divergently regulated within the two cell lines. Interestingly at the level of RNA MMP13 and IL-8 are statistically down regulated by NMRT only in C28/I2 cells.
Conclusions: Our findings concerning effects of IL-1β being less significant under NMRT than under control conditions, plus the reduced MMP-13 expression substantiate the postulated anti-inflammatory effect of NMRT relevant for pain relief. Clarification of how NMRT signaling is processed by targeted cells will broaden perspectives for clinical adaptations of NMRT by more precise and efficient application of this alternative therapeutically action.
Keywords
Nuclear magnetic resonance therapy (NMRT); Chondrocytes; Interleukin-1b; Gene array; Metalloproteinase; Cell growthAbbreviations
NMRT: Nuclear Magnetic Resonance Therapy; OA: Osteoarthritis; MRI: Magnetic Resonance Imaging; MAPK/ERK: Mitogen Activated Protein Kinase/Extracellular-Signal-Regulated Kinase; TGF-β: Transforming Growth Factor-Beta; Smad: Mothers Against Decapentaplegic Homolog; MMP: Matrix Metalloproteinase; IL-1β, Interleukin 1 Beta; IL6: Interleukin 6; IL8: Interleukin 8; BMP1: Bone Morphogenetic Protein; ITG: Integrin; IGF: Insulin-Like Growth Factor; EGF: Epidermal Growth Factor; FGF: Fibroblast Growth Factor; NFκB: Nuclear Factor-kappaB; JNK: c-Jun N-Terminal Kinase; TIMP: Tissue Inhibitor of Metalloproteinases; EGFR: Epidermal Growth Factor ReceptorsIntroduction
Osteoarthritis (OA) is the main chronic joint disease with symptoms characterized by the destruction of articular cartilage in the joints, especially knee, hip and hand [1,2]. The treatment of pain and disability as the main clinical symptoms of OA includes a number of different medical approaches such as physiotherapy, pharmacological treatment or surgical methods [3-5]. Since none of these methods is able to bring fateful course of the illness, the development of new, more effective and in particular non-invasive methods to gain pain reduction of OA patients are of exceptional interest.Clinical observations demonstrated positive effects of nuclear magnetic resonance for the treatment of painful disorders of the musculoskeletal system [6], which led to the development of a low field NMR therapy (NMRT). Reflecting implemented clinical studies, NMRT is considered to reveal pain relief of patients with low back pain followed by improvements of activities in daily living, while no side effects were observed [7,8].The double-blind, randomized and placebo controlled study of therapeutic effects of NMRT on OA of hand and finger joints resulted in a significant increase of physical function lasting for at least six month [9]. Improvements of pain from patients with knee OA due to a chondroprotective effect on human articular cartilage were described [10-12]. Froböse et al. demonstrated that patients, afflicted with destructions of the cartilage in the knee, exhibited positive adaptations of the cartilaginous structures - MRI controlled - under NMRT [13]. They further postulated that the mechanism underlying the observed effects was based on the stimulation of intact or partly functioning chondrocytes followed by an augmented synthesis of collagens. While so far in chondrocytes no NMRT induced effects were detected in respect to apoptosis and cell viability, by trend NMR treatment led to the elevation of the cell proliferation rate quantified by cell counting [14]. Studies on primary cultures of human dermal fibroblasts exposed to NMR resulted in distinct changes both in cellular and extracellular components: (i) the extracellular matrix of NMR-exposed cells had less crosslinked collagen and (ii) increase of collagen I, III and IV of the soluble fraction by NMRT was detected [15]. Insights from studies regarding effects of NMRT on human chondrocytes propose NMRT induced changes in the modulation of signal transduction pathways involved in cartilage degeneration, possibly causing the observed pain reduction in clinical trials [16].
Chondrocytes within the cartilage matrix are in general responsible for the balanced turnover of the extracellular matrix and are controlled by extracellular signaling. They exhibit altered cellular reaction patterns during the process of OA. Besides cell death, a change in cell proliferation or a compensatory increase in synthetic activity, OA chondrocytes activate or deactivate gene expression or undergo phenotypic modulation [17]. In addition they do not positively response to mechanical stimulation by integrin induced stimulation of the MAPK/ERK pathway [18,19]. Furthermore, components of the TGF-β/Smad-or MAPK-pathway are representing potent mediators of the cartilage matrix synthesis [20-22], with a possible interaction between MAPK subtypes and TGF-β/Smads signaling pathway during chondrogenesis [23]. MAP kinase subtypes (MAPK/ERK, p38 kinase, c-Jun N-terminal kinase) are constitutively expressed in articular chondrocytes assigned to regulate differentiation, apoptosis, inflammatory responses, and activation of matrix metalloproteinases (MMP) [24-26]. The latter functions as interstitial collagenases and, in cooperation, degrade components of the extracellular matrix playing an essential role under pathological conditions, e.g. joint inflammation and degenerative joint diseases [27-29]. Opposing the regulatory effects of growth factors by balancing anabolic as well as catabolic processes, the well-studied pro-inflammatory cytokine interleukin IL-1β stimulates the production of degrading enzymes and suppresses protein synthesis by influencing cellular MAPK pathways [30-32]. Under experimental conditions stimulation of chondrocytes by IL-1β shifts cellular expression pattern to a more inflammatory status by inducing the expression and activation of MMP’s, as well as IL6 and IL8, respectively [33-35].
The present study addresses the still unresolved question whether cellular mechanisms in chondrocytes might be modulated by low field NMRT leading to an improvement in cartilage destruction accompanied by pain reduction. Apart from cell proliferation studies, analysis of an osteogenesis gene array and reporter-gene studies helped to investigate signal transforming factors and effectors involved in TGF-β as well as MAPK induced pathways in chondrosarcoma cells (Cal-78). A possible influence of NMRT on proinflammatory cytokines such as IL-6 and IL-8 as well as MMP-1,-3,-8,-9,-10 and 13 of chondrosarcoma cells (Cal-78) and chondrocytes (C28/I2) was examined.
Methods
Cell cultureThe human chondrosarcoma cell line Cal-78 was purchased from the Leibniz Institute DSMZ-German Collection of Microorganisms and Cell Culture and the human chondrocytes HCH, a primary cell line was purchased from Promocell (Germany). Cell culture was performed following the instructors manual. C28/I2, an immortalized human chondrocyte cell line (kindly provided by Prof. M. B. Goldring, Harvard Institute of Medicine, Boston, MA) was cultured in Dulbeco’s modified eagle’s medium (DMEM) supplemented with 10% FCS at 37°C under 5% CO2. For studies comprising the isolation of RNA as well as the collection of cell supernatants, the amount of seeded cells, if not separately indicated, in case of Cal-78 cells was 10.000 cells/cm2, while C28/I2 cells were seeded at a density of 5000 cells/cm2. Three to four days after cell seeding, IL-1β (10 ng/ml, Sigma- Aldrich, USA) was added. The 10 h therapeutically NMR treatment at room temperature generally started 2 hours after addition of IL-1β for 2 hours per day, 5 days running. Cells only incubated at room temperature for the same period of time functioned as control. In case of the gene array study, cells were treated for 20 hours within 5 days or others as individually indicated.
Nuclear Magnetic Resonance (NMR) therapy
NMR treatment was applied by a special magnetic nuclear resonance therapy device adapted for cell cultures (MedTec Company, Wetzlar, Germany) inducing a controlled nuclear resonance of protons. Cells were stimulated for different periods of time dependent on the methodical requirement.
Cell proliferation, cell density assays
Cell density - Calcein Measurements: Cells were seeded on a 24 well plate with a density of 1000 cells/cm2. For the measurement of cell density, cells were incubated for 30 min at 37°C in PBS containing 2 μM calceinacetomethylester (Calcein AM; Sigma-Aldrich, USA). The fluorescence at 530 nm emission wavelength was detected using a plate reader with an excitation wavelength of 485 nm. For analysis, the fluorescence was normalized to the fluorescence of control cells at day 0 before the first NMR treatment.
Cell proliferation - BrdU-assay: BrdU Flow Kit (BD Biosciences, USA) was used for long term tracking of cell proliferation characteristics of C28/I2 cells after being stimulated for 10 h by NMRT. After each splitting procedure, cells were seeded at a density of 5000 cells/cm2. Incorporation of BrdU into newly synthesized DNA by cells entering and progressing through the S (synthesis of DNA) phase of the cell cycle was performed according to the instructor’s manual. Final measurements were accomplished at five different time points using a flow cytometer (FACSCalibur, BD Bioscience, USA); data analysis and data acquisition was performed using Cellquest.pro software (BD Bioscience, USA).
Cell proliferation - Dye eFlour-670: Cells were labeled with eFlour 670 (eBioscience, USA) at a concentration of 5 μM, according to the manufacturer`s instructions. First measurement started the day after the cells were seeded in 25 cm2 culture flasks, while second and third measured points were set at day four after 5 hours and at day six after 10 h of NMRT treatment, respectively. FACS data were collected on FACSCalibur and data analysis and data acquisition was performed using Cellquest.pro software (BD Bioscience, USA).
Dead cell measurement - Propidium iodide staining: After trypsinisation and washing in PBS, 2 x 10⁵ to106 cells were suspended in 190 μl binding buffer (10 mM Hepes / NaOH 7.4, 140 mM NaCl, 2.5 mM CaCl2 filtered through 0.2 μm pore filter). 10 μl of Propidium iodide solution (PI, 20 μg/ml, Sigma-Aldrich, USA) was added and cells were analyzed with the flow cytometer.
Transfection - Luciferase assay
The reporter gene assay (Cignal™ Reporter Assay, Immune Signaling 10-pathway Reporter Luciferase, SAbioscience, Qiagen, USA) was used for measuring changes in activity (both increases and decreases) of specific signaling pathways. The activity of ten transcription factors was studied. Following the company’s instruction for transfection of cells, 1 μl of each reporter DNA was mixed with SureFECT (SAbioscience, Qiagen; USA) in Opti-MEM and after complex formation was portioned out onto a 96 well plate. By adding 100 μl of Cal78 cell suspension at a density of 3x10⁵ cells/ml, the transfection process was left to proceed for 16 hours. Subsequently, the medium was changed and after additional 24 h cells underwent the NMRT treatment for 1 h or were kept just at room temperature for the corresponding time. Luciferase was activated by application of the Dual-Luciferase® Reporter Assay System (Promega, USA) and luminescence was measured by a Victor X3 plate reader (Perkin Elmer).
RNA isolation
Total RNA extraction of both types of cell lines was performed by the use of the RNeasy system (QIAGEN). In case of qPCR experiments, RNAs were DNase-I treated following the instructor’s manual (QIAGEN). Quantification as well as quality control of the isolated RNA was accomplished by measuring the optical density at A260 and controlling the A260/A280 ratio by a nanophotometer (Implen). RNA quality was further assayed by denaturing agarose gel electrophoresis.
Gene-Array analyses
The Pathway-Specific Microarray Gene Expression Profiling System for human osteogenesis (OHS -026, SAbioscience, QUIAGEN) was used to test for relevant genes. An RNA-pool consisting of RNA from three different experiments of Cal78 cells treated with NMR for 20 hours was converted to labeled cRNA (True Labeling-AMP™ 2.0, GA-030, SABioscience, QUIAGEN). The hybridization and detection procedure was conducted as described by the company. Signals obtained by a cooled CCD camera were analyzed with the GEArray Expression Analysis Suite software from SABioscience.
RT-qPCR
Isolated RNA (1 μg per reaction and probe) served as template for a 1st strand cDNA synthesis by RNase H+ iScript reverse transcriptase and a blend of oligo(dT) and random primers for 30 min at 37°C (iScriptcDNA Synthesis Kit, BioRad). The sequences of the PCR primers and the sizes of the amplicons were for MMP-1: fwd 5’CTGTTCAGGGACAGAATGTGCT3’ and rev 5’TCGATATGCTTCACAGTTCTAGGG3’; 85 bp for MMP-3: fwd 5’TTTTGGCCATCTCTTCCTTCA3’ and rev 5’TGTGGATGCCTCTTGGGTATC3’ 139 bp; and for MMP-13: fwd 5’TCCTCTTCTTGAGCTGGACTCATT3’ and rev 5’CGCTCTGCAAACTGGAGGTC3’ 97 bp. Further primers used: MMP-9: fwd 5’GGGACGCAGACATCGTCATC3’ and rev 5’TCGTCATCGTCGAAATGGGC3’, 139 bp; MMP-10: fwd 5’TGCTCTGCCTATCCTCTGAGT3’ and rev 5’TCACATCCTTTTCGAGGTTGTAG3’, 103 bp; IL8: fwd 5’ACTGAGAGTGATTGAGAGTGGAC3’ and rev 5’AACCCTCTGCACCCAGTTTTC3’, 112 bp; IL6: fwd 5’AAATTCGGTACATCCTCGACGG3’ and 5’GGAAGGTTCAGGTTGTTTTCTGC3’, 112 bp; GAPDH: 5’TGATGACATCAAGAAGGTGGTGAAG3’ and rev 5’TCCTTGGAGGCCATGTGGGCCAT3’, 102 bp; Aldolase: fwd 5’ATGAGTCCACTGGGAGCATTG3’ and 5’ACCGCCCTTGGATTTGATAAC3’, 209 bp. Primer sequences were derived from the Primerbank database (http://pga.mgh.harvard.edu/primerbank). Relative quantification of gene expression was achieved with the RealMasterMix SYBR ROX (5’PRIME, Eppendorf, USA, Germany) on a mastercycler (Eppendorf Mastercycler realplex). Reactions were performed in duplicates with glyceraldehyde-3-phosphate dehydrogenase (GAPDH) and aldolase as internal control.
A standard temperature profile with an initial activation step at 95° (3 min), followed by a 3-step PCR program comprising a 95° (15 s) denaturation, 60° (30 s) annealing and 70° (20 s) elongation for 40 cycles. A melting curve was obtained after each qPCR run. As a control no-RT and no-DNA reactions and gel electrophoresis were performed. mRNA expression was quantified by the ΔΔCt method.
Fluorokine® MAP Human MMP Kit
Cells were plated with appropriate cell density in six well plates. NMRT was performed for 10 h within five days in the presence as well as absence of IL-1β. For control cells in parallel were incubated at RT; supernatants were collected in all cases. Duplicate supernatants were pooled and diluted 2.5 fold in the prescribed dilution buffer. For both cell lines cell culture supernatants were measured for MMP-1, -3, -9 and -13 according to the Fluorokine® MAP Human MMP Kits manufacturer’s instruction (R&D Systems Europe, England)
Enzyme Immuno Assay
Ready-to-use Sandwich ELISAs (Human IL-6 Platinum ELISA, eBioscience; Human IL-8 Platinum ELISA, eBioscience, USA) were used for the quantitative detection of human interleukin-6 respectively interleukin-8. Supernatants were diluted as required from 1:5 to 1:100 fold and proceeded according to the instructor’s manual. All measurements were performed in duplicates at 450 nm with an Anthos 2010 microplate reader (Anthos Mikrosysteme GmbH, Germany).
Statistical analysis
Data from qPCR are presented as the mean (± standard error) of at least four single experiments, whereby RT-qPCR as well as ELISA experiments were performed in duplicates. Statistical significance was determined by the Student t-test and by the Wilcoxon-Mann- Whitney-Test; p-values < 0,05 were considered to be significant (***p < 0,001; **p < 0,01; *p < 0,05), all p-values are two-sided. Data analysis was performed with the SigmaPlot 11.0 software (Systat software inc., USA).
Gene-Array Analysis
Influence of IL-1β on C28/I2 and Cal-78 cells
Effect of NMR treatment on C28/I2 and Cal-78 cells ± IL-1β
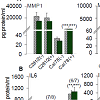
Protein concentrations of MMPs, IL6 and IL8 were determined by testing cell supernatants. Via the luminex assay system we quantified MMP-1, -3 and -13 as well as MMP-8 and -9, both of which were not expressed in detectable amounts in either cell line (Figure 3a). NMRT had no influence on the expression of MMP-1, -3 and -13 whereas IL-1β markedly elevated the concentration of MMP-3 and MMP-13 in both cell lines and MMP-1 in Cal-78 cells only. C28/I2(IL-1β (±)) and Cal-78(IL-1β (-)) demonstrated a tendency to reduced MMP-1 and C28/I2(IL-1β (-)) to reduced MMP-3 production under NMRT at the protein level. Both inflammatory cytokines IL6 and IL8 were measured with standard ELISA techniques to test for NMRT induced differences in protein expression. No differences could be detected even though IL-1β significantly induced protein expression of both interleukins (Figure 3b).
Results
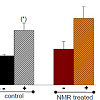
Cell growth – cell viabilityBased on previous findings that nuclear magnetic resonance (NMR) therapy may influence cell growth as well as may regenerate cartilage [13,14], Cal-78 and C28/I2 cells were treated with NMRT over different periods of time measuring cell proliferation. Cal-78 cells treated with NMRT for nine hours apportioned over a period of seven days did not show a significant difference in cell growth neither in the absence nor in the presence of IL-1β (Figure 1A). IL-1β itself in both cases dramatically reduced cell growth. Interestingly, under control conditions, differences in cell proliferation between IL-1β treated and non-treated cells occurred after three days. For NMRT differences induced were only detected at day seven (Figure 1A). Interestingly, we also tested NMRT on cell growth of human dermal adult fibroblasts (HDFa), synovial sarcoma cells (SW982) as well as human chondrocytes (HCH, primary cells) by calcein staining. No significant difference between control and NMR treated cells could be detected over time. The percentage of PI positive Cal-78 cells increased under the influence of IL-1β under control as well as NMRT to nearly the same extent. However, the observed augmentation in percent dead cells demonstrated only for control cells statistical significance (Figure 1B). The proliferation characteristic of C28/I2 cells stimulated by NMRT was tested by the use of the cell proliferation dye eFlour 670. NMRT stimulation for ten hours within eight days did not change cell proliferation rate proved by measure the X Geo Mean of fluorescence for control vs. NMRT at day four (439.67 vs. 433.38), day six (189.76 vs. 180.67) and day eight (88.56 vs. 92.23), respectively.
In respect to a long-term effect by NMRT on cell proliferation the percentage of C28/I2 cells during the S-phase was observed over a period of fourteen days (Figure 1C). Therefore cells were stimulated with NMRT for seven hours within four days prior the first measurement, followed by three additional hours of NMRT treatment and two splits. The percent S-phase was measured at four additional time points, revealing no difference in curve’s shape compared to control (Figure 1C).
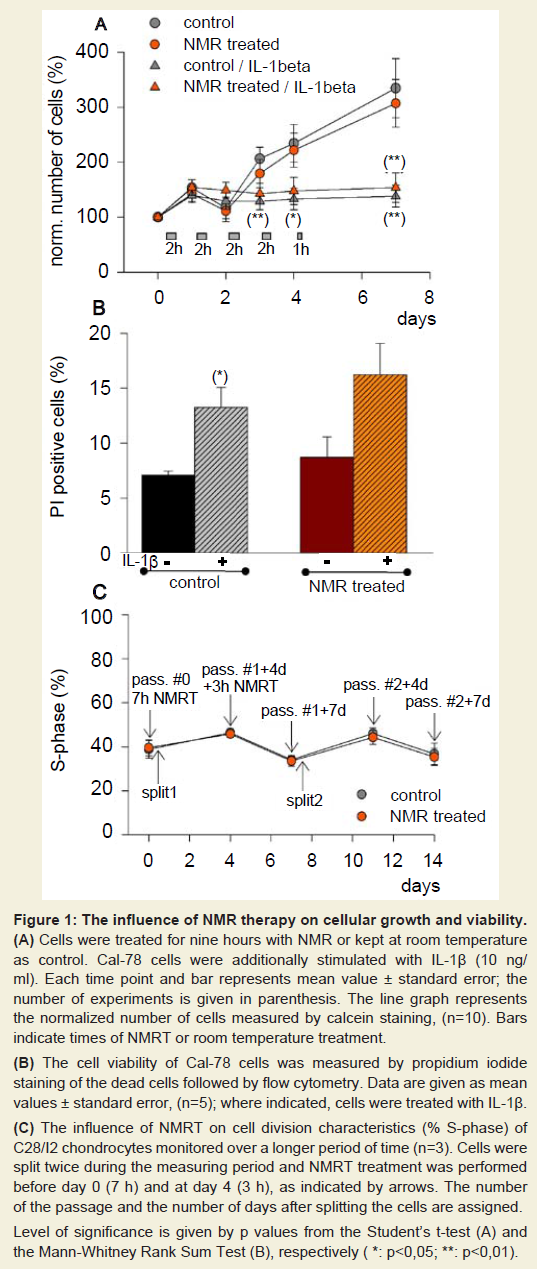
Figure 1: The influence of NMR therapy on cellular growth and viability.(A) Cells were treated for nine hours with NMR or kept at room temperature as control. Cal-78 cells were additionally stimulated with IL-1β (10 ng/ ml). Each time point and bar represents mean value ± standard error; the number of experiments is given in parenthesis. The line graph represents the normalized number of cells measured by calcein staining, (n=10). Bars indicate times of NMRT or room temperature treatment.(B) The cell viability of Cal-78 cells was measured by propidium iodide staining of the dead cells followed by flow cytometry. Data are given as mean values ± standard error, (n=5); where indicated, cells were treated with IL-1β.(C) The influence of NMRT on cell division characteristics (% S-phase) of C28/I2 chondrocytes monitored over a longer period of time (n=3). Cells were split twice during the measuring period and NMRT treatment was performed before day 0 (7 h) and at day 4 (3 h), as indicated by arrows. The number of the passage and the number of days after splitting the cells are assigned. The influence of NMRT on cell division characteristics (% S-phase) of C28/I2 chondrocytes monitored over a longer period of time (n=3). Cells were split twice during the measuring period and NMRT treatment was performed before day 0 (7 h) and at day 4 (3 h), as indicated by arrows. The number of the passage and the number of days after splitting the cells are assigned. Level of significance is given by p values from the Student’s t-test (A) and the Mann-Whitney Rank Sum Test (B), respectively ( *: p<0,05; **: p<0,01).
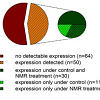
The analysis of the osteogenesis gene array demonstrated the expression of 50 out of 114 tested genes in Cal-78 chondrosarcoma cells. The sample for the gene array hybridization was synthesized from a pool of RNA isolated from three experiments with cells treated for 20 h with NMRT within 5 days. Traceable genes could be subdivided into genes that were only present under control (n=11) or under treated conditions (n=9, Figure 2A). In case of genes expressed under non-stimulated and stimulated conditions (threshold value was set to 0.01) we focused on NMRT induced differences in their expression levels. While the bone morphogenetic protein (BMP1), a regulator of the TGF-β pathway induction was lowered under the influence of NMRT, BMP2 was unchanged. Smad3 and 4, key modulators of the TGF-β signaling pathway were contrarily regulated; the increase in Smad3 opposed the down regulation of Smad4. In addition, the integrins ITGB1 and ITGA3 were also conversely regulated by NMRT, similar to the expression of the insulin-like- and epidermal-growth factors (IGF1, EGF), the fibroblast growth factor (FGF) or their receptors (EGFR, FGFR3) (Figure 2B). Interestingly, collagens I, XII and XV were down regulated by NMRT, collagen IX was up regulated and collagen II seemed unchanged (Figure 2B). The transcription factor NFκ demonstrated lowered RNA levels under NMRT treatment. The gene array was also tested for NMR induced changes in expression of human chondrocytes (HCH cells). Only weak signals to no signals at all due to low quality output of RNA could be detected. A comparison to the genes revealing potential interest within the Cal78 cells was implemented (Figure 2B). This observation resulted in identical changes at the RNA level for the colony stimulating factor (CSF2), Col12, VEGF-B, NFκB1 and MMP13, respectively. Testing the luciferase activity of Cal-78 cells transfected with different reporter gene constructs and stimulation of the cells by NMR for one hour revealed a slight augmentation of the TGF-β pathway, whereas NFκB-luc transfected cells revealed a strong increase in luciferase activity (Figure 2C). Furthermore, under these conditions luciferase activity was heavily augmented when controlled by MAPK/ERK and MAPK/JNK. Additionally tested reporter gene constructs only revealed minimal changes in expression under NMRT stimulation.
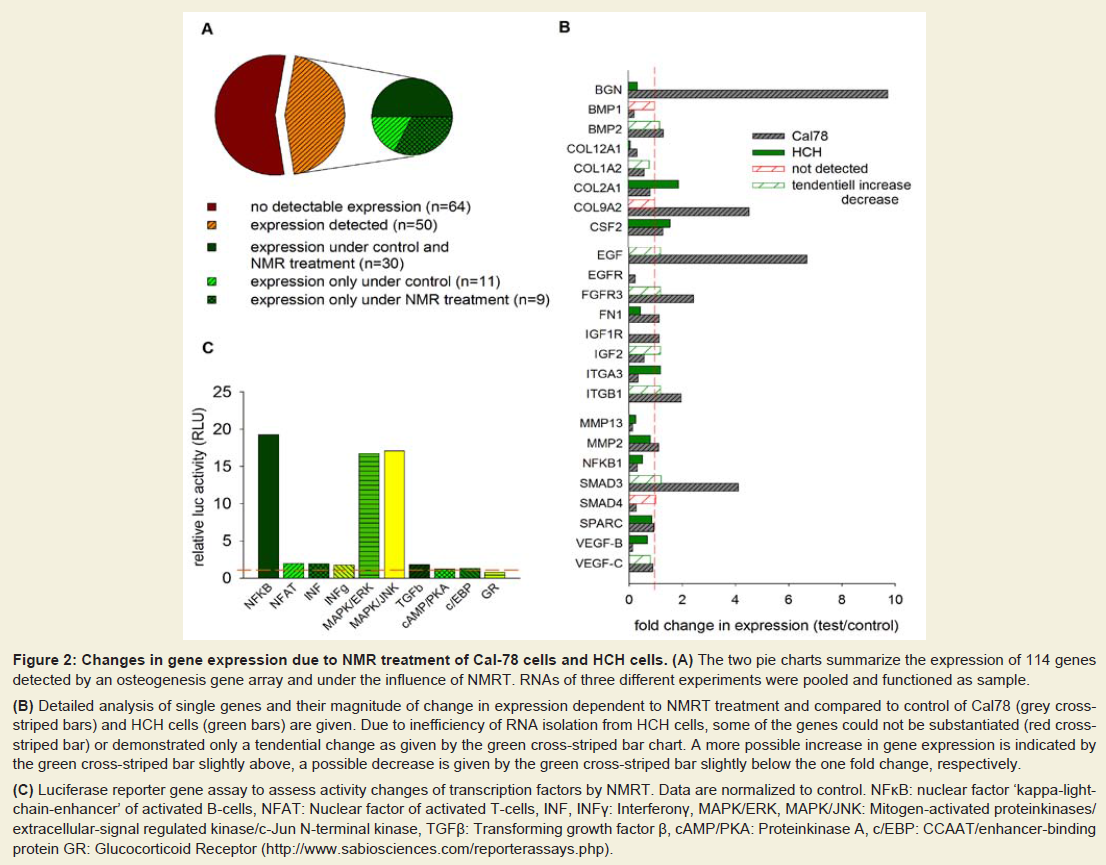
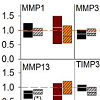
Figure 2: Changes in gene expression due to NMR treatment of Cal-78 cells and HCH cells. (A) The two pie charts summarize the expression of 114 genes detected by an osteogenesis gene array and under the influence of NMRT. RNAs of three different experiments were pooled and functioned as sample.(B) Detailed analysis of single genes and their magnitude of change in expression dependent to NMRT treatment and compared to control of Cal78 (grey crossstriped bars) and HCH cells (green bars) are given. Due to inefficiency of RNA isolation from HCH cells, some of the genes could not be substantiated (red crossstriped bar) or demonstrated only a tendential change as given by the green cross-striped bar chart. A more possible increase in gene expression is indicated by the green cross-striped bar slightly above, a possible decrease is given by the green cross-striped bar slightly below the one fold change, respectively.(C) Luciferase reporter gene assay to assess activity changes of transcription factors by NMRT. Data are normalized to control. NFκB: nuclear factor ‘kappa-lightchain-enhancer’ of activated B-cells, NFAT: Nuclear factor of activated T-cells, INF, INFγ: Interferonγ, MAPK/ERK, MAPK/JNK: Mitogen-activated proteinkinases/extracellular-signal regulated kinase/c-Jun N-terminal kinase, TGFβ: Transforming growth factor β, cAMP/PKA: Proteinkinase A, c/EBP: CCAAT/enhancer-binding protein GR: Glucocorticoid Receptor (http://www.sabiosciences.com/reporterassays.php).
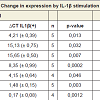
Based on the findings of the NMRT as an effective therapy for OA patients, investigations focused on mediators of inflammation. Basically, quantitative PCR was used to characterize changes in the expression pattern of MMP-1, -3, -10, -13 as well as TIMP3, IL6 and IL8, respectively due to the IL-1β administration on Cal-78 and C28/I2 (Table 1). Both cell lines reacted differently in respect to the treatment with IL-1β, particularly regarding the expression of MMP-1, -10 and -13. The mean ratio value of non-stimulated vs. IL-1β stimulated Cal-78 cells revealed a 21 to 44 fold change in expression of MMP-1 (44.1 ± 14.9), MMP-3 (28.6 ± 12.8) and MMP-10 (21.3 ± 8.0). In terms of C28/I2 cells the induction of gene expression was considerably lower compared to Cal-78 cells. For MMP-1, the observed minor effect of IL-1β stimulation on C28/I2 cells could be ascribed to a high basal expression, whereas in general MMP-3 and MMP-10 were not efficiently induced (Table 1). The expression of the two inflammatory cytokines IL6 and IL8 was similarly affected by IL-1β even though the gap in expression of IL8 was less pronounced. TIMP3 expression in both cell lines did not change significantly from a rather high basal expression level (Table 1). Hence, analysis of cell supernatants from both cell lines (± IL-1β) confirmed these observations (Figure 3a, 3b).
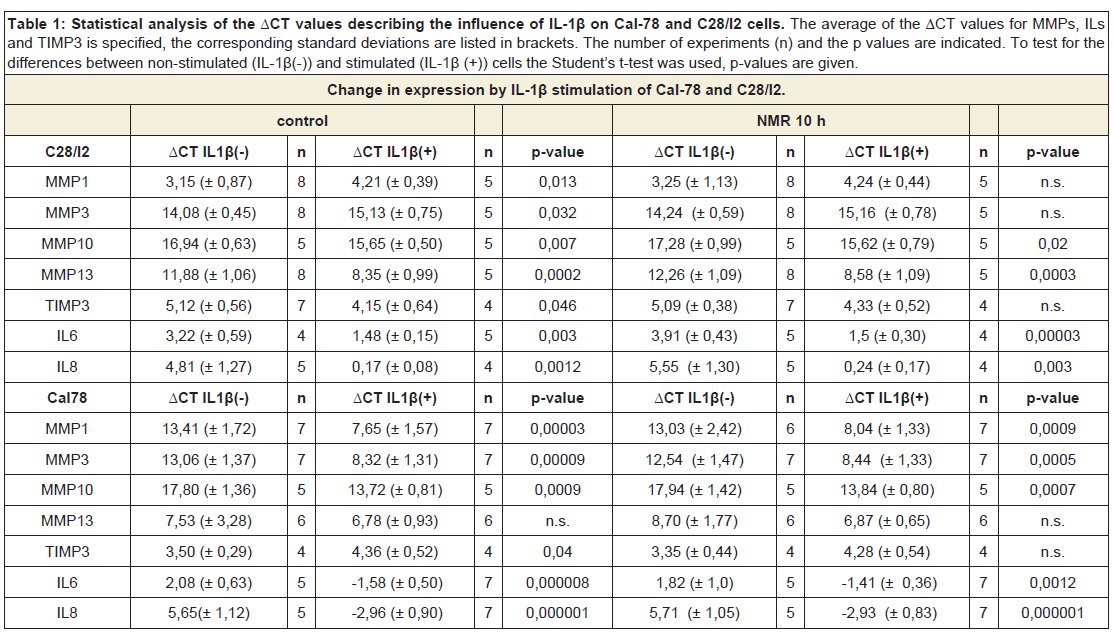
Table 1: Statistical analysis of the ΔCT values describing the influence of IL-1β on Cal-78 and C28/I2 cells. The average of the ΔCT values for MMPs, ILs and TIMP3 is specified, the corresponding standard deviations are listed in brackets. The number of experiments (n) and the p values are indicated. To test for the differences between non-stimulated (IL-1β(-)) and stimulated (IL-1β (+)) cells the Student’s t-test was used, p-values are given.
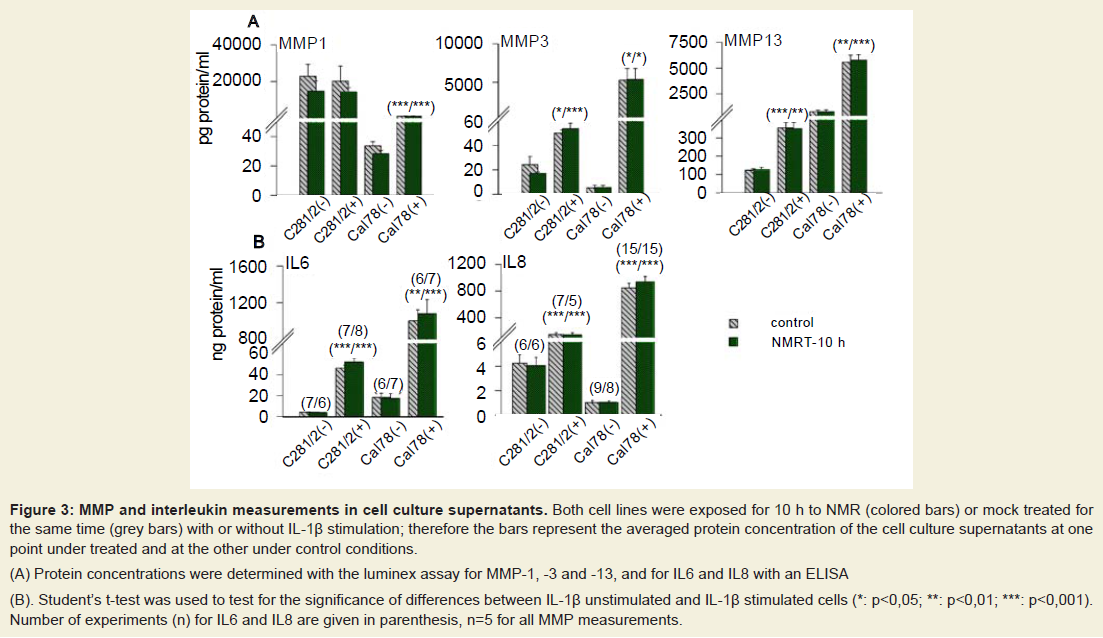
Figure 3: MMP and interleukin measurements in cell culture supernatants. Both cell lines were exposed for 10 h to NMR (colored bars) or mock treated for the same time (grey bars) with or without IL-1β stimulation; therefore the bars represent the averaged protein concentration of the cell culture supernatants at one point under treated and at the other under control conditions.(A) Protein concentrations were determined with the luminex assay for MMP-1, -3 and -13, and for IL6 and IL8 with an ELISA(B) Student’s t-test was used to test for the significance of differences between IL-1β unstimulated and IL-1β stimulated cells (*: p<0,05; **: p<0,01; ***: p<0,001). Number of experiments (n) for IL6 and IL8 are given in parenthesis, n=5 for all MMP measurements.
Both cell lines were exposed with and without IL-1β (IL-1β (+)/IL-1β (-)) to NMRT for 10 hours within a period of five days. Expression levels of MMP-1, -3, -10, -13, TIMP3, IL6, and IL8, respectively, were analyzed by quantitative RT-PCR. Only minimal expression could be detected for MMP-8 and MMP-9 in both cell lines. Differences were observed in C28/I2(IL-1β (±)) cells for MMP-13 as well as in Cal-78(IL-1β(-)) for MMP-3 and in Cal-78(IL-1β(+)) for MMP-10. The IL6 expression was not influenced by NMRT, the ratio values of IL8 found in C28/I2 (IL-1β(-)) slightly decreased (Figure 4).
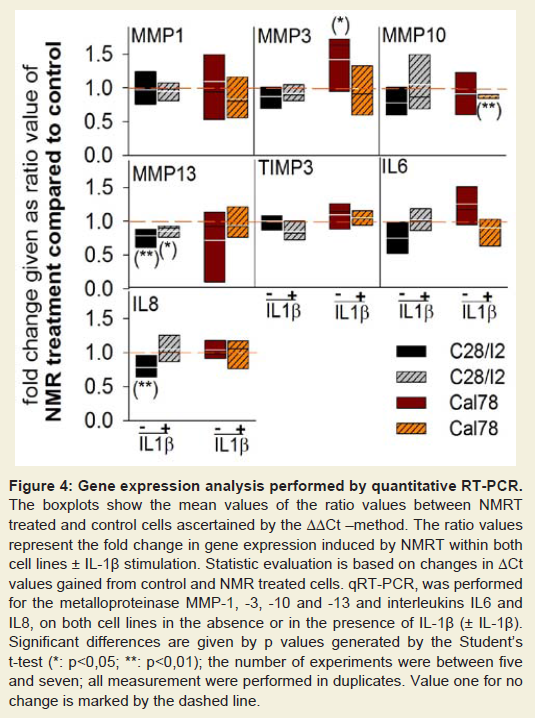
Figure 4: Gene expression analysis performed by quantitative RT-PCR. The boxplots show the mean values of the ratio values between NMRT treated and control cells ascertained by the ΔΔCt–method. The ratio values represent the fold change in gene expression induced by NMRT within both cell lines ± IL-1β stimulation. Statistic evaluation is based on changes in ΔCt values gained from control and NMR treated cells. qRT-PCR, was performed for the metalloproteinase MMP-1, -3, -10 and -13 and interleukins IL6 and IL8, on both cell lines in the absence or in the presence of IL-1β (± IL-1β). Significant differences are given by p values generated by the Student’s t-test (*: p<0,05; **: p<0,01); the number of experiments were between five and seven; all measurement were performed in duplicates. Value one for no change is marked by the dashed line.
Discussion
Clinically, pain as well as loss of joint function in OA is the major issue leading to a significantly reduced quality of life for patients suffering from this affection [36,37]. Based on its high frequency, OA represents one of the most expensive disease, both in terms of direct and indirect costs. Treatment options are rather limited and predominantly evolved to treat only symptoms without influence on the causal disease mechanism. Pharmacological treatments are associated with gastrointestinal, renal and cardiovascular risks. The development of new therapies improving general condition of OA patients in terms of quality of life on one hand and reducing the huge socio-economic burden on the other hand is of particular importance [38]. NMRT with low field strength is successfully used to treat patients with OA and is discussed to function by combating basic causes [12,39]. Less is known about the effects and the mechanism of action of NMRT at the cellular level, constituting the basis of this study in which we tried to clarify how NMRT could modulate chondrocytes (Cal-78 and C28/I2) and with and without activated inflammatory mechanisms.In general, cytokines produced by inflammatory cells play a pivotal role in inflammation, joint destruction and influence function, proliferation and morphology of chondrocytes [40,41]. IL-1 plays an important role in inflammatory processes of OA [34]. Our investigations demonstrated an extensive reduction in cell growth of Cal-78 cells in the presence of the pro-inflammatory cytokine IL-1β, first ascertained at day three of the treatment. While slight changes in cell growth of human chondrocytes induced by NMRT were postulated [14], studies on human dermal fibroblasts coincide with our results that no significant differences in growth were detected between control and NMRT treated Cal-78 and C28/I2 cells, respectively. The described improvement of cartilage structure in knee-OA patients after NMRT might therefore primarily be explained by increased metabolic activity of chondrocytes than direct augmentation in cell growth [13]. This would also explain the observation that NMRT, when applied on cells under control (IL-1β(-)) versus inflammatory (IL-1β(+)) conditions, diminishes the difference in cell growth between these two groups. Significant differences in proliferation between IL-1β(-) and IL-1β(+) groups not treated with NMRT occurred at days three while under NMRT a significant difference of this parameter was only measurable at day seven of the experimental procedure. Accordingly, IL-1β supplemented to Cal 78 cells under control conditions increased the number of cells of the late stage of apoptosis and dead cells, in contrast to NMRT treated cells, with significant changes, ditto an indication of NMRT inducing an influence on metabolic activity of chondrocytes.
The results from the gene arrays point to an influence of NMRT on the structure, function and properties of cartilage via changes in the expression of FACIT (Fibril Associated Collagens with Interrupted Triple helices) collagen IXα2 and XIIα1 [42], whereas collagens I, III and IV, demonstrated to be influenced in human dermal fibroblasts under NMRT [15], were unaffected. Among the proteoglycans decorin and biglycan, the latter demonstrated an enormous increase in expression by NMRT [43]. Biglycan has signaling properties towards matrix assembly, cellular migration and adhesion [44]. The finding that biglycan is a short term activator of EGFR and thus of MAPK shows yet again that NMRT might also play a critical role in the regulation of homeostasis of chondrocytes and the pericellular matrix [45]. Apart from the up-regulation of EGF by NMRT, via changes in expression of ligands and components of TGF-β pathway, BMP1, BMP2 and Smad3, Smad4, and IGF2, NMRT might interfere with chondrocyte’s modulation by inflammatory processes [46,47]. The integrins ITGB1 and ITGA3 were conversely regulated by NMRT [48]. Stimulation of integrins modulates the differentiation, matrix remodeling, responses to mechanical stimulation, cell survival of chondrocytes and regulates gene expression via the MAPK pathway [49,50].
With reporter gene assays we were able to demonstrate that NMRT for 1 h activated MAPK/ERK and MAPK/JNK in Cal-78cells. If NMRT modulates extracellular signaling by changes in the expression of ligands and/or receptors, then these changes might affect the MAPK signal cascades [51,52]. While NFKB, transcription factor and important regulator in cellular responses [53], was down regulated in gene arrays, the luciferase expression under control of NFKB was increased after NMRT. This contradiction might be ascribed to the different time of NMR treatment used in these two experimental applications.
MMP’s and the interleukins heavily involved in the manifestation of osteoarthritis might represent additional targets that react to NMRT. MMPs under physiological conditions participate in diverse processes, including wound healing, bone resorption and fetal development, while pathologically they are associated with arthritis, autoimmune diseases, fibrosis, heart failure and cancer [54]. In our experiments at the RNA level slight changes could be observed for MMP-3 and MMP-10 in Cal-78 cells and for MMP-13 in C28/I2 cells. While MMP-3 activates MMP-1 and cleaves a broad range of matrix proteins, both are the most ubiquitously expressed MMPs, whereas MMP-13 within the connective tissue has a more restricted pattern of expression and is usually produced only by cartilage and bone during development and by chondrocytes in OA [55,56]. Inhibitors of MMP-13 exert chondroprotective effects and potentially modulate joint pain [57,58]. The reduction in MMP-13 levels in C28/I2 cells by NMRT, even though rather small, might among others play a role for the observed improvements in pain and functionality of OA patients who underwent NMR therapy [7,9,41]. While IL6 expression did not change, the reduced expression of IL8 in C28/I2(IL-1b(-)) cells might indicate a slight down regulation of the major mediator in inflammatory responses. The reason for Cal-78 cells not showing up significant changes in MMP-13/IL8 levels could be its high basal expression of MMP-13 in combination with known deficits in modulation of tumor cells in general [59]. As demonstrated by the presented data, an enormous difference in expression of MMPs and interleukins between chondrosarcoma cells and chondrocytes exists (Table 1). While analysis at the RNA levels of different genes indicated a slight influence on gene expression we were not able to corroborate these findings on the protein level.
Conclusion
Our study revealed different signaling pathways as potential targets for the low frequency NMRT. Results of cell proliferation assays and qRT-PCR indicate that the effects of the mediator for inflammation IL-1β are less significant under NMRT than under control conditions. These findings and the observed reduction in MMP-13 expression by NMRT substantiate the postulated anti-inflammatory effect of NMRT responsible for pain relief. In addition the clarification of how NMRT is processed by targeted cells will broaden the perspective for the clinical adaptation of NMRT by a more precise and efficient application of this alternative therapeutically action.Acknowledgements
We would like to thank Brigitta Schweiger for her technical assistance in perfoming the enzyme-linked immunoassays (Elisa).References
- Aigner T, Sachse A, Gebhard PM, Roach HI (2006) Osteoarthritis: pathobiology-targets and ways for therapeutic intervention. Adv Drug Deliv Rev 58: 128-149.
- Bijlsma JW, Berenbaum F, Lafeber FP (2011) Osteoarthritis: an update with relevance for clinical practice. Lancet 377: 2115-2126.
- Page CJ, Hinman RS, Bennell KL (2011) Physiotherapy management of knee osteoarthritis. Int J Rheum Dis 14: 145-151.
- Kon E, Filardo G, Drobnic M, Madry H, Jelic M, et al. (2012) Non-surgical management of early knee osteoarthritis. Knee Surg Sports Traumatol Arthrosc 20: 436-449.
- Skou ST, Roos EM, Laursen MB, Rathleff MS, Arendt-Nielsen L, et al. (2012) Total knee replacement plus physical and medical therapy or treatment with physical and medical therapy alone: A randomised controlled trial in patients with knee osteoarthritis (the MEDIC-study). BMC Musculoskelet Disord 13: 67.
- Kupce E (2001) Applications of adiabatic pulses in biomolecular nuclear magnetic resonance. Methods Enzymol 338: 82-111.
- Kullich W, Schwann H, Walcher J, Machreich K (2006) The effect of nuclear resonance therapy with a complex 3-dimensional electromagnetic nuclear resonance field on patients with low back pain. J Back Musculoskeletal Rehab 19: 79-87.
- Kullich W, Schwann H, Machreich K, Ausserwinkler M (2006) Additional outcome improvement in the rehabilitation of chronic low back pain after nuclear resonance therapy. Rheumatologia 20: 7-12.
- Kullich W, Ausserwinkler M (2008) Functional improvement in osteoarthritis of the hand after treatment with uclear magnetic resonance. Orthopädische Praxis; 44: 287-290.
- Auerbach B, Melzer C (2003) Prospektive Untersuchung zur Wirksamkeit der MultiBioSignal-Therapie bei der Behandlung der Gonarthrose. Z Orthop Ihre Grenzgeb 141.
- Jansen H, Brockamp T, Paletta JRJ, Ochman S, Raschke MJ, et al. Does have low-energy NMR an effect on moderate gonarthrosis? In 52nd Annual Meeting of the Orthopaedic Research Society.
- Levers A, Staat M, van Laack W (2011) Analyse der Langzeitwirkung der MBST Kernspinresonanz-Therapie bei Gonarthrose. Orthopädische Praxis 47: 536-543.
- Froböse I, Eckey U, Reiser M, Glaser C, Englmeier F, et al. (2000) Evaluation of the effectiveness of three-dimensional pulsed electromagnetic fields of the multibiosignal therapy on the regeneration of cartilagenous structures. Othopädische Praxis 36: 510-515.
- Temiz-Artmann A, Linder P, Kayser P, Digel I, Artmann GM, et al. (2005) NMR in vitro effects on proliferation, apoptosis, and viability of human chondrocytes and osteoblasts. Methods Find Exp Clin Pharmacol 27: 391-394.
- Digel I, Kurulgan E, Linder Pt, Kayser P, Porst D, et al. (2007) Decrease in extracellular collagen crosslinking after NMR magnetic field application in skin fibroblasts. Med Bio Eng Comput 45: 91-97.
- Steinecker-Frohnwieser B, Weigl L, Höller C, Sipos S, Kullich W, et al. (2009) Influenve of NMR therapy on metabolism of osteosarcoma- and chondrocarcoma cell lines. Bone 44: S295.
- Aigner T, Kim HA (2002) Apoptosis and cellular vitality: issues in osteoarthritic cartilage degeneration. Arthritis Rheum 46: 1986-1996.
- Millward-Sadler SJ, Wright MO, Davies LW, Nuki G, Salter DM (2000) Mechanotransduction via integrins and interleukin-4 results in altered aggrecan and matrix metalloproteinase 3 gene expression in normal, but not osteoarthritic, human articular chondrocytes. Arthritis Rheum 43: 2091-2099.
- Leong DJ, Hardin JA, Cobelli NJ, Sun HB (2011) Mechanotransduction and cartilage integrity. Ann N Y Acad Sci 1240: 32-37.
- Yang X, Chen L, Xu X, Li C, Huang C, et al. (2001) TGF-beta/Smad3 signals repress chondrocyte hypertrophic differentiation and are required for maintaining articular cartilage. J Cell Biol 153: 35-46.
- Las Heras F, Gahunia HK, Pritzker KP (2012) Articular cartilage development: a molecular perspective. Orthop Clin North Am 43: 155-171.
- Bobick BE, Kulyk WM (2008) Regulation of cartilage formation and maturation by mitogen-activated protein kinase signaling. Birth Defects Res C Embryo Today 84: 131-154.
- Li J, Zhao Z, Liu J, Huang N, Long D, et al. (2010) MEK/ERK and p38 MAPK regulate chondrogenesis of rat bone marrow mesenchymal stem cells through delicate interaction with TGF-beta1/Smads pathway. Cell Prolif 43: 333-343.
- Stanton LA, Underhill TM, Beier F (2003) MAP kinases in chondrocyte differentiation. Dev Biol 263: 165-175.
- Chun JS (2004) Expression, activity, and regulation of MAP kinases in cultured chondrocytes. Methods Mol Med 100: 291-306.
- Sondergaard BC, Schultz N, Madsen SH, Bay-Jensen AC, Kassem M, et al. (2010) MAPKs are essential upstream signaling pathways in proteolytic cartilage degradation--divergence in pathways leading to aggrecanase and MMP-mediated articular cartilage degradation. Osteoarthritis Cartilage 18: 279-288.
- Brinckerhoff CE, Matrisian LM: Matrix metalloproteinases: a tail of a frog that became a prince. Nat Rev Mol Cell Biol 2002, 3: 207-14.
- Parks WC, Wilson CL, López-Boado YS (2004) Matrix metalloproteinases as modulators of inflammation and innate immunity. Nat Rev Immunol 4: 617-629.
- Hadler-Olsen E, Fadnes B, Sylte I, Uhlin-Hansen L, Winberg JO (2011) Regulation of matrix metalloproteinase activity in health and disease. FEBS J 278: 28-45.
- Arend WP (2001) Cytokine imbalance in the pathogenesis of rheumatoid arthritis: the role of interleukin-1 receptor antagonist. Semin Arthritis Rheum 30: 1-6.
- Goldring MB, Otero M (2011) Inflammation in osteoarthritis. Curr Opin Rheumatol 23: 471-478.
- Goldring MB, Otero M, Tsuchimochi K, Ijiri K, Li Y (2008) Defining the roles of inflammatory and anabolic cytokines in cartilage metabolism. Ann Rheum Dis 67 Suppl 3: iii75-iii82.
- Lim H, Kim HP (2011) Matrix metalloproteinase-13 expression in IL-1β-treated chondrocytes by activation of the p38 MAPK/c-Fos/AP-1 and JAK/STAT pathways. Arch Pharm Res 34: 109-117.
- Moon MH, Jeong JK, Lee YJ, Seol JW, Park SY (2012) Sphingosine-1-phosphate inhibits interleukin-1β-induced inflammation in human articular chondrocytes. Int J Mol Med 30: 1451-1458.
- Abramson SB, Attur M (2009) Developments in the scientific understanding of osteoarthritis. Arthritis Res Ther 11: 227.
- Hunter DJ, McDougall JJ, Keefe FJ (2008) The symptoms of osteoarthritis and the genesis of pain. Rheum Dis Clin North Am 34: 623-643.
- Berenbaum F (2012) Osteoarthritis as an inflammatory disease (osteoarthritis is not osteoarthrosis!). Osteoarthritis Cartilage 21: 16-21.
- Berenbaum F (2008) New horizons and perspectives in the treatment of osteoarthritis. Arthritis Res Ther.
- Kullich W, Overbeck K, Spiegel HU (2013) One-year-survey with multicenter data of more than 4,500 patients with degenerative rheumatic diseases treated with therapeutic nuclear magnetic resonance. J Back Musculoskelet Rehabil 26: 93-104.
- Schuerwegh AJ, Dombrecht EJ, Stevens WJ, Van Offel JF, Bridts CH, et al. (2003) Influence of pro-inflammatory (IL-1 alpha, IL-6, TNF-alpha, IFN-gamma) and anti-inflammatory (IL-4) cytokines on chondrocyte function. Osteoarthritis Cartilage 11: 681-687.
- Fan Z, Bau B, Yang H, Soeder S, Aigner T (2005) Freshly isolated osteoarthritic chondrocytes are catabolically more active than normal chondrocytes, but less responsive to catabolic stimulation with interleukin-1beta. Arthritis Rheum 52: 136-143.
- Käpylä J, Jäälinoja J, Tulla M, Ylöstalo J, Nissinen L, et al. (2004) The fibril-associated collagen IX provides a novel mechanism for cell adhesion to cartilaginous matrix. J Biol Chem 279: 51677-51687.
- Roughley PJ (2006) The structure and function of cartilage proteoglycans. Eur Cell Mater 12: 92-101.
- Midwood KS, Williams LV, Schwarzbauer JE (2004) Tissue repair and the dynamics of the extracellular matrix. Int J Biochem Cell Biol 36: 1031-1037.
- Iacob S, Cs-Szabo G (2010) Biglycan regulates the expression of EGF receptors through EGF signaling pathways in human articular chondrocytes. Connect Tissue Res 51: 347-58.
- Li TF, O'Keefe RJ, Chen D (2005) TGF-β signaling in chondrocytes. Front Biosci 10: 681-688.
- van der Kraan PM, Blaney Davidson EN, Blom A, van den Berg WB (2009) TGF-beta signaling in chondrocyte terminal differentiation and osteoarthritis: modulation and integration of signaling pathways through receptor-Smads. Osteoarthritis Cartilage 17: 1539-1545.
- Humphries JD, Byron A, Humphries MJ (2006) Integrin ligands at a glance. J Cell Sci 119: 3901-3903.
- Loeser RF (2002) Integrins and cell signaling in chondrocytes. Biorheology 39: 119-124.
- Shakibaei M, Csaki C, Mobasheri A (2008) Diverse roles of integrin receptors in articular cartilage. Adv Anat Embryol Cell Biol 197: 1-60.
- Guo X, Wang XF (2009) Signaling cross-talk between TGF-beta/BMP and other pathways. Cell Res 19: 71-88.
- Sondergaard BC, Schultz N, Madsen SH, Bay-Jensen AC, Kassem M, et al. (2010) MAPKs are essential upstream signaling pathways in proteolytic cartilage degradation--divergence in pathways leading to aggrecanase and MMP-mediated articular cartilage degradation. Osteoarthritis Cartilage 18: 279-288.
- Roman-Blas JA, Jimenez SA (2006) NF-kappaB as a potential therapeutic target in osteoarthritis and rheumatoid arthritis. Osteoarthritis Cartilage 14: 839-848.
- Ra HJ, Parks WC (2007) Control of matrix metalloproteinase catalytic activity. Matrix Biol 26:587-596.
- Meller D, Li DQ, Tseng SC (2000) Regulation of collagenase, stromelysin, and gelatinase B in human conjunctival and conjunctivochalasis fibroblasts by interleukin-1beta and tumor necrosis factor-alpha. Invest Ophthalmol Vis Sci 41: 2922-2929.
- Vincenti MP, Brinckerhoff CE (2002) Transcriptional regulation of collagenase (MMP-1, MMP-13) genes in arthritis: integration of complex signaling pathways for the recruitment of gene-specific transcription factors. Arthritis Res 4: 157-164.
- Piecha D, Weik J, Kheil H, Becher G, Timmermann A, et al. (2010) Novel selective MMP-13 inhibitors reduce collagen degradation in bovine articular and human osteoarthritis cartilage explants. Inflamm Res 59: 379-389.
- Li NG, Shi ZH, Tang YP, Wang ZJ, Song SL, et al. (2011) New hope for the treatment of osteoarthritis through selective inhibition of MMP-13. Curr Med Chem 18: 977-1001.
- Meierjohann S, Hufnagel A, Wende E, Kleinschmidt MA, Wolf K, et al. (2010) MMP13 mediates cell cycle progression in melanocytes and melanoma cells: in vitro studies of migration and proliferation. Mol Cancer 9: 201.