
Journal of Oral Biology
Download PDF
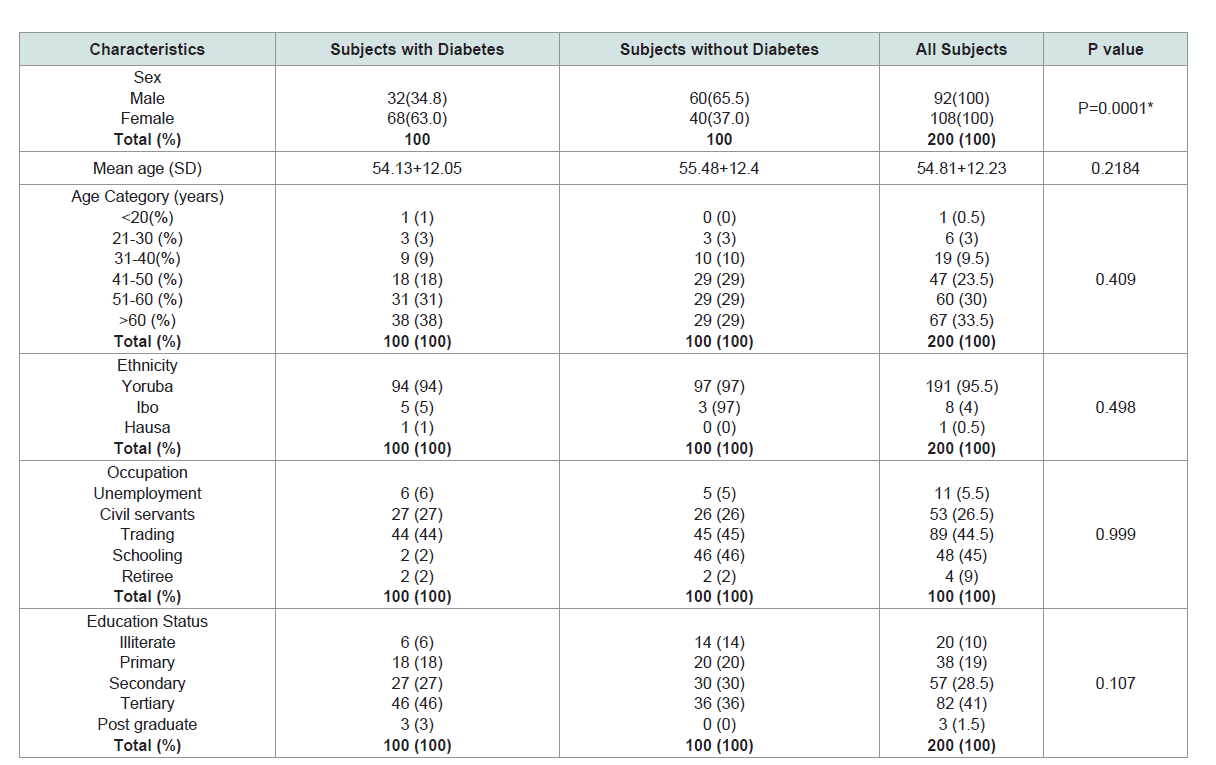 Table 1: Sociodemographic of the Participants.
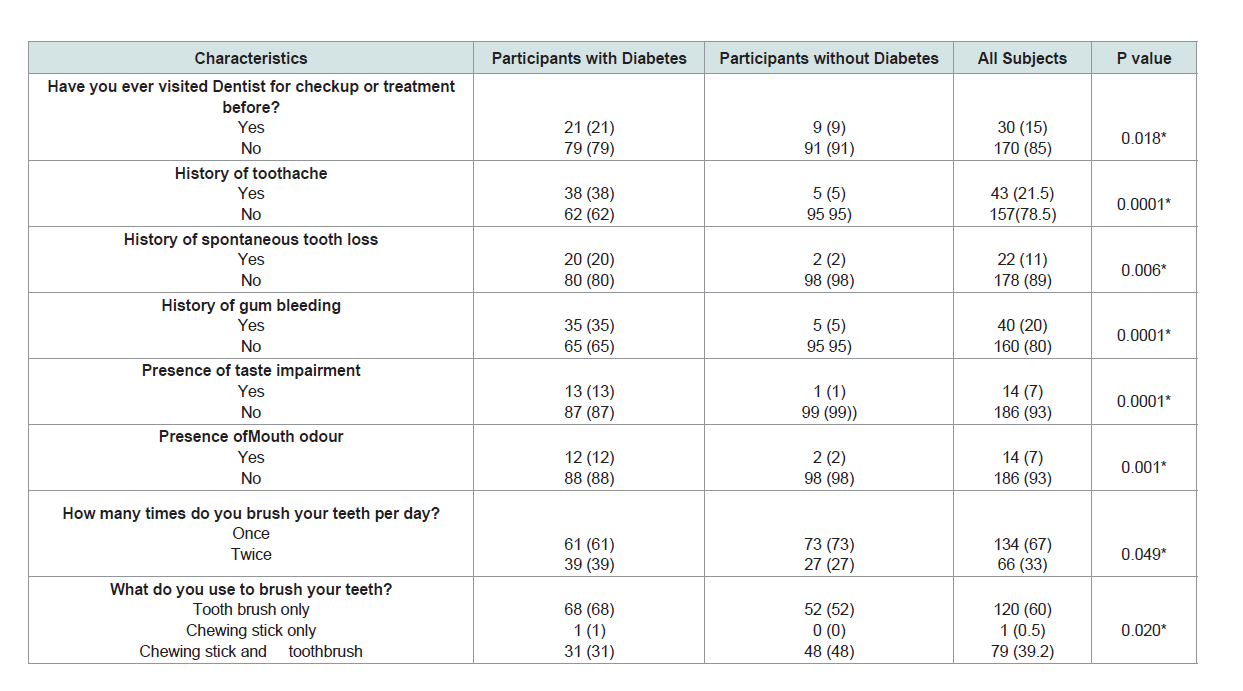 Table 2: Oral Symptoms and Health Practices.
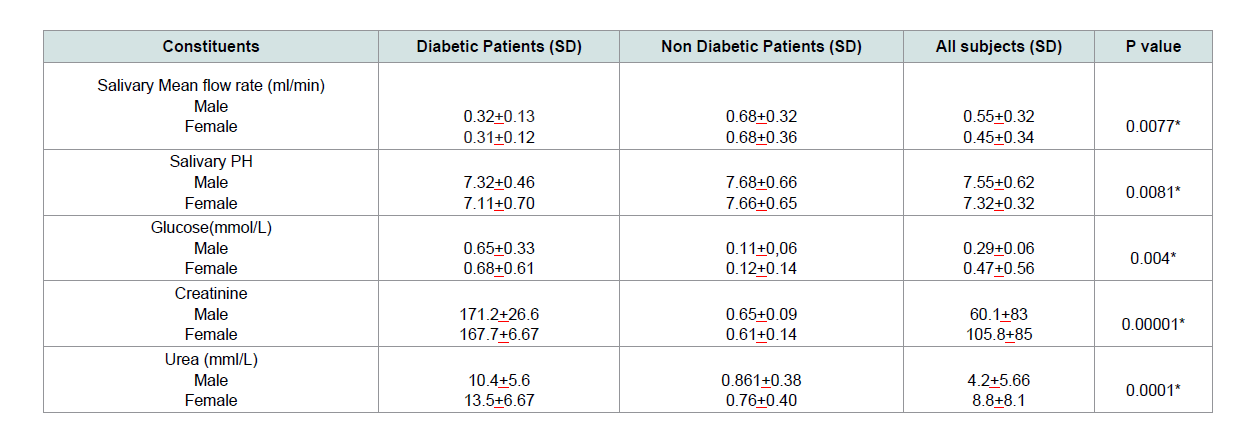 Table 3: Sex Variations in Physical and Biochemical Analysis of salivary constituents of subjects.
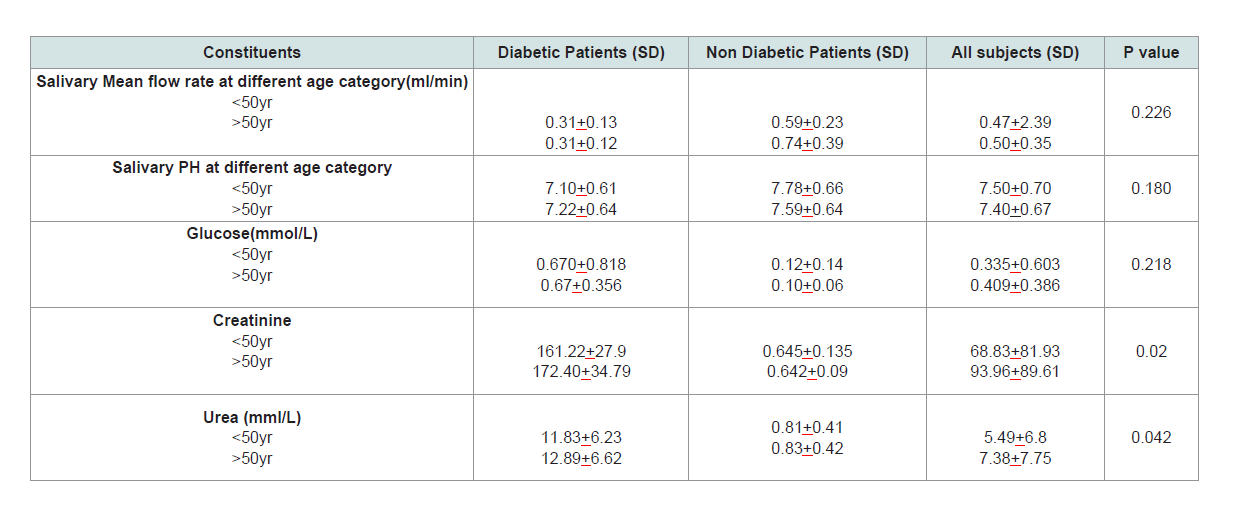 Table 4: Age Variations in Physical and Biochemical Analysis of some salivary constituents.
Research Article
Clinical Oral Findings and Salivary Analysis of Patients with and Without Diabetes Mellitus
Oyetola EO1*, Abimbola TA1, Adesina OM2, Egunjobi SM2, Adebayo OF1 and Afolabi OT3
1Department of Preventive and Community Dentistry, Obafemi Awolowo University, Nigeria
2Department of Oral and maxillofacial Surgery and Oral Pathology, Obafemi Awolowo University, Nigeria
3Department of Child Dental Healthy, Obafemi Awolowo University, Nigeria
*Address for Correspondence: Oyetola EO, Department of Preventive and Community
Dentistry, Obafemi Awolowo University, Ile Ife, Nigeria; E-mail: phemyhoye12@yahoo.com
Submission: 04 November 2019
Accepted: 02 December 2019
Published: 12 December 2019
Copyright: © 2019 Oyetola EO, et al. This is an open access article
distributed under the Creative Commons Attribution License, which
permits unrestricted use, distribution, and reproduction in any medium,
provided the original work is properly cited.
Abstract
Aims: To compare clinical oral findings and salivary changes in diabetic
and non-diabetic patients.
Material and methods: This comparative cross-sectional study was
conducted at the Endocrinology Clinic of Obafemi Awolowo University
Teaching Hospital Complex (OAUTHC), Ile Ife (Cases), the controls were
volunteers among staffs and students of the hospital community. Participants
were interviewed and examined. Saliva was collected using spitting method
and salivary flow rate was determined using volumetric method. Salivary PH,
Urea, Creatinine and glucose concentration was determined using Randox
BT29 4QY kit.
Results: Total of 100 diabetics and 100 non-diabetics, mean age
54.81+12.23 yr, participated. History of toothache and gum bleeding
was significantly more frequent among diabetic subjects, p=0.001 and
0.001 respectively. Salivary flow rate is significantly lower among diabetics
0.32+0.13 ml/min), flow rate was also lower among female. Salivary glucose,
urea and creatinine were significantly higher among diabetics while
their urine is more acidic. Older age group showed higher concentration
of salivary glucose, urea, creatinine, and reduced pH than in younger
population. Data analysis was done using STATA 13 statistical software.
Wilcoxon rank-sum test was used to compare continuous variables between
diabetics and non diabetes.
Conclusion: Oral problems and saliva alterations are significantly higher
among diabetics especially among male participants of older age groups.
Clinical significance: The significant association between prevalence
of oral lesions among diabetes as well as significant qualitative changes
in saliva of diabetes is a potential noninvasive tool of monitoring diabetes
and could enhance the multidisciplinary management approach in its
management.
Keywords
Diabetes mellitus; Salivary flow rate; Salivary glucose
Introduction
The use of saliva as a diagnostic tool has grown to become very
popular in the management of systemic diseases. Changes in saliva
composition often reflects the general state of health especially in
some disease conditions such as diabetes mellitus [1], HIV/AIDS
[2], Renal diseases and psychological stress [3,4]. In additions to
underlying systemic diseases, salivary production is also affected by
age and sex of the patients.
Salivary secretion occurs in two stages; first is the primary
secretion by acini cells. At this first stage, the acini cells of salivary
gland secrete the primary saliva from the substrate made available
through the plasma. This first formed saliva is essentially an ultrafiltrate
of the plasma and is called primary saliva [5]. The second step
is the modification of the primary saliva as it flows down the duct;
this is done by the ductal epithetical cells. This result is the formation of secondary saliva which will eventually be secreted into the mouth
[6]. Second is the modification process which comprises secretion
and selective reabsorption of substances into and from the plasma
respectively. Due to the presence of similar anchor protein called
claudin 16 at the epithelia tight junctions of salivary glands, renal
tubules and breast; the mode of action of salivary ductal epithelia cells
has been likened to that of respective cells in urine (renal tubules)
and breast milk production [7]. The modification process on the
saliva at this secondary stage is largely dependent upon the present
plasma concentrations of the respective metabolites. The implication
is that the higher the concentration of markers of systemic problems
in the blood, the higher will be the concentration in the saliva and
this is a good rationale for using saliva as a non-invasive replacement
for plasma in diagnosis. A good example is the blood sugar, when
the blood sugar is high as it happens in DM patients; it implies a
corresponding increase in the salivary glucose. The same will also
be applicable to some other substances in the blood such as urea,
creatinine, antibody concentration, hormones and drugs.
The average unstimulated salivary flow rate of healthy adult ranges
from 0.1-0.5 ml/min while the stimulated flow rate was found to be
higher, 1-2 ml/min. Studies had shown that patients with diabetes
mellitus have lower flow rates [8-10]. Glucose is not a constituent of
saliva in a healthy individual.
The pH of saliva of patients with oral lesions has been shown to
be at variants with apparently healthy patients [11]. Diabetic patients
had acidic saliva compared to non-diabetic patients. Salivary urea and
creatinine also differs in diabetic and non-diabetic patients [8,11].
The prevalence of DM is on the increase daily probably as a result
of changing to westernized diet as well as sedentary lifestyle. Diabetes
is also associated with complications such as CVS, renal failures,
amputation, infection and oral problems [13]. It therefore leads to
reduce quality of life and the burden on the community at large is
quite enormous. Early diagnosis and management of this condition
is therefore important and all hands must be on desk to achieve this all important goal. The routine/conventional test is the use of
plasma sugar which may be painful and require more skills when
compared with saliva collection. Saliva is a potential alternative fluid
for screening, diagnosis and monitoring the patients. Several studies
have been conducted to look into salivary parameters in diseased
condition but many did not relate the salivary findings to the severity
of the oral symptoms and saliva parameters. The present study is
designed to determine salivary physical and chemical constituents in
diabetes and non-diabetes individuals, relating the findings with the
severity of oral signs and symptoms.
Materials and Methods
This study was designed as a comparative cross-sectional study
comparing the clinical features and salivary analysis of diabetic and
non-diabetic patients who presented at Obafemi Awolowo University,
Ile Ife from January, 2019 to June, 2019. Two groups of subjects were
selected: Group a (Diabetic patients) were selected from the pool of
patients who presented at Endocrinology clinic for treatment. Group
B were apparently healthy and non-diabetic volunteers among staff
and students of Obafemi Awolowo University, Ile Ife. Group B
subjects were subjected to urinalysis screening test using Combic
9 urinalysis kit, only those with negative test were recruited. The
subjects were selected using simple random method.
Ethical approval:
Ethical approval was sought and obtained from the Research and
Ethics Committee of the institute of Public Health Obafemi Awolowo
University. Each participant was well informed and gave their
consent before undertaking the study on voluntary basis. Participants
were also free to decline from participating in the study at any time
during the study period. Information obtained from the participants
was treated with utmost confidentiality.
Sample size calculation:
Salivary flow rate was used to calculate the sample size since
variation in salivary flow is a common finding in many cases of
systemic illness. Sample size was calculated using he formulae as
applicable to studies comparing two means as reported by Eng (2003)
[14].
formula
Where, N is the total number of samples requires for the two
groups Zcrit is a constant value of 1.96 at a clinical significance of
0.05. Zpwr, also a constant which equals 1.645 at a statistical power of
0.95. The symbol ð is the assumed SD of each group. Oyetola et al. had
reported the mean salivary flow rate as 0.398 SD 0.25 mL/min [15],
therefore SD will be taken as 0.25. D is the total width of an expected
Confidence Interval (CI) and was set at 1.3. With the power of 90%
and the significance level of 0.05, a sample size of 180 subjects was
obtained and rounded up to 200 to allow for attrition
formula
N= 180
To allow for attrition, N=200. Each group will therefore require 100 participants.
Data collection:
The tool used for the data collection was questionnaire. Section
A collected information on the participants’ biodata such as age, sex,
tribe, occupation and so on. Section B has information on oral and
general symptoms of diabetes. Section C contains the salivary and
blood findings.
Saliva collection:
Spitting method, as reported by Srivastava et al. 2018 was used to
collect saliva for this study [16]. Samples were collected between 10hrs
and 12 hrs to minimize the effect of diurnal variation on the quantity
and quality of saliva. Participants were asked to avoid food intake one
hour before the procedure. Subjects were given saliva jar and were
asked to spit into the jar for five minutes. Saliva collection time was
determined using a stop watch. Salivary flow rate was calculated by
dividing the total volume collected by a factor of 5 to get the flow rate
in ml/min. Thereafter, the saliva was transported to the laboratory
immediately for analysis.
Laboratory procedures:
Estimation of salivary urea: RandoxKits BT29 4QY, United
Kingdom was used to estimate salivary urea. The kits followed
Urease- Berthelot method of urea estimation. The ammonia is the
measured photometrically by Berthelot’s reaction. The procedure
for the measurement is essential as contained in the manufacturer
instructions and the salivary concentration of urea was calculated
using the formula:
formula
Standard concentration is a constant =13.10 mmol/L
Estimation of salivary creatinine:
This was done using RandoxKits BT29 4QY ®, United Kingdom.
The kits operate on the principle that creatinine in alkaline solution
reacts with picric acid to form a colored complex. The procedure
for the measurement is essential as contained in the manufacturer
instructions.
The salivary concentration of creatinine was calculated using the
formula:
formula
Standard concentration is a constant =169 μmol/L
Estimation of salivary glucose:
This was done using RandoxKits BT29 4QY, United Kingdom
The kits followed Urease- Berthelot method of urea estimation.
The procedure for the measurement is essential as contained in the
manufacturer instructions.
The salivary concentration of glucose was calculated using the
formula:
Formula
Estimation of salivary pH:
This was done using pH meter. The instrument was first calibrated
by using standard buffer solution of 4.18, 8 and 11.5 respectively and
there after 0.0 Lml of the sample (saliva) was carried with a pipette to
come in contact with the sensitive part of the probe of the pH meter.
The pH of the saliva shows immediately on the screen.
Statistical analysis:
Data analysis was done using STATA 13 statistical software
(StataCorp, College Station, Texas). Descriptive statistics were used
to characterize socio-demographic variables (such as age and sex)
and the presence of symptoms. Analyzing for descriptive factors
for salivary constituents and age pf participants with continuous
variables include checking for mean, median, mode, and range as
appropriate. The continuous variable was checked for normality test
using Shapiro-Wilks test. Comparison of the mean values of salivary
constituents at the dichotomized age groups and sex were done using
students-test and Wilcoxon rank-sum test as appropriate. Statistical
significance was set at p<0.05.
Results
Sociodemographic of the participants:
A total of 200 subjects participated in the study, 92 (46%) males
and 108 (54%) females. Their mean age + SD was 54+12.23. Majority of the participants were trader with at least primary education.
Yoruba ethnicity (95.5%) was the most common tribe. More than
three-quarter of the participants were above 40 years old (Table 1).
Oral symptoms and health practices:
More than three quarter of the participants had never visited a
dentist before, especially those without diabetes (p=0.18). History of
tooth ache, spontaneous toothy loss, gum bleeding, taste impairment
and mouth odor were significantly higher among diabetes p=0.0001,
0.006, 0.0001, 0.0001, 0.0001 and 0.001 respectively. Most of them
brush once daily using tooth brush and toothpaste only (Table 2).
Sex variations in physical and biochemical analysis of salivary constituents of subjects:
The mean salivary flow rate is higher in males than females and
was significantly lower in diabetes patients, p=0.0077. The saliva of
Diabetes subjects was found to be significantly more acidic compare
to those without diabetes (p=0.0081). Salivary glucose was higher in
female diabetic subjects, the difference was statistically significant,
p=0.004. Salivary creatinine and urea was significantly higher in
diabetes, p=0.00001 and 0.0001 respectively (Table 3).
Age variations in physical and biochemical analysis of some salivary constituents:
Mean salivary flow rate is slightly higher among subjects above
50 years, but the difference was not statistically significant, p=0.226.
Older subjects also had more acidic saliva the difference also not statistically significance. Salivary glucose, creatinine and urea
was higher in subjects above 50 years but the difference were not
statistically significant (Table 4).
Discussion
The physical and chemical properties of saliva are strongly
associated with the changes in internal or external environment of the
individuals. Patients with diabetes, therefore, show some changes in
the saliva which can be a pointer to diagnosis and disease monitoring.
In addition to the chemical and physical properties of diabetes
patients, the present study revealed the association between salivary
parameters, sex and age.
In this study, diabetes mellitus was found to be more frequent
among men when compared women with male to female ration of
3:2. This finding is consistent with the reports of a United Kingdom
based review by Siddiqui et al. which showed a higher prevalence
of DM among males [17]. The sex variation of diabetes mellitus is
attributed to lifestyle changes, predisposition to predisposing factors,
genetics and environments [18,19]. This also showed that diabetes
in more frequent among population of older age group which is
consistent with the findings of Alva et al. 2017 who reported that the
risk equation of diabetes is successful in middle age adult than young
population [20].
Patients with diabetes mellitus often present with oral problems
as a result of the disease process, associated complications and medications. Consistent with other studies, this study found higher
prevalence of oral symptoms among diabetes. More than one-third
(38%) of diabetes patients present with oral symptoms such as
had history of tooth ache, gum bleeding, oral malodour and taste
impairment, this finding is in agreement with some other studies [13].
Tooth ache is usually a result of severe periodontitis and multiple
periodontal abscesses seen in diabetes patients as a result of impaired
immunity, vasculopathy and changes in salivary parameters. Changes
in quantity and quality of saliva produced, tongue depappilation
and vasculitis may be responsible for the taste impairment while
oral malodour is usually attributed to acetone breath and poor oral
hygiene which is more frequent among diabetic patients [13,21].
Various reports had showed that diabetic subjects have lower
salivary flow rate compared to those without diabetes [8,22]. In the
present study, the mean unstimulated salivary flow rate is 0.32+0.13
ml/min which was significantly lower than 0.68+0.32 ml/min of
the non-diabetic patients. This result was similar to the findings
of Hoseini et al. who reported 0.35+0.11 and 0.5+0.07 ml/min as
salivary flow rate of diabetic and non-diabetic patients respectively
[22]. Reduced salivary production in diabetic patients may be
due to dehydration, effects of medication and neuropathy of the
parasympathetic stimulation of the salivary gland in diabetic patients
[22]. This leads to oral problems such as taste impairment, gingivitis,
mucositis, halitosis and poor oral hygiene [13].
DM is associated with variations in saliva composition and
secretion [21]. The pH which measures the degree of acidity or basicity
of substances is also affected in diabetic patients [23]. In this study, we
found a significantly lower (acidic) pH among diabetes participants.
This is consistent with the findings of Seethalakshmi et al. 2016
who analyzed the saliva of 20 diabetic and 20 non-diabetic patients
and observed a reduced pH among diabetic patients compared to
control [24]. The acidity of saliva in diabetes mellitus patients may
be due to organic acid generated following gluconeogenesis and
impaired osmoregulation due to diabetic nephropathy. The pH is also
significantly lowered (acidic) in females probably due to the effects
sex hormones.
Salivary glucose concentration is a reflection of plasma glucose
concentration. Consistent with other studies, salivary glucose of
diabetic participants was significantly higher than that of the nondiabetes
[12,23,25]. Primary saliva, from where the secondary saliva
in the mouth is formed, is essentially an ultra-filtrate of the plasma
and it’s a direct reflection of the level of plasma glucose. Salivary urea
is also significantly higher in males consistent with other studies.
Higher blood sugar among males is due to male predilection of DM.
Like salivary glucose, the concentration of urea and creatinine in
saliva reflect the plasma values and are significantly higher in diabetic
patients [26]. Increase plasma urea is a basic sign of renal problems.
Consistent with scientific literature, salivary urea is significantly
higher in diabetic patients [8,25]. Renal impairment (nephropathy)
is not uncommon in diabetic mellitus; this may be responsible for the
higher values. Higher urea level may also be found in higher protein
diet and exercise. This study showed a higher urea concentration in
saliva of females consistent with other studies.
Qualitative changes in saliva with respect to age are commonly
reported in the literature [12,24,26]. In this study we report higher
PH in subjects older participants above 50 years this may be
connected to to renal impairment which tends to happen at older age
group, Likewise, salivary glucose, urea and creatinine concentration
was found to be significantly higher older individuals. Increasing
age predisposing to renal problems may also be responsible to the
findings.
Salivary analysis has showed significant variations among
diabetic and non-diabetic patients, as revealed in this study which
was done among African population. Also, the relationship between
the salivary and plasma concentration of the substances measured
further reaffirm the potential use of saliva in the diagnosis and
monitoring of diabetic patients. This become especially in resource
limited countries.
Clinical Significance:
This study had shown recent African data on salivary parameters
and oral findings among diabetes and non diabetes. Major findings were reduced salivary flow rate, increase salivary glucose, increased
urea and creatinine concentrations among diabetes. The significant
association between prevalence of oral lesions among diabetes as well
as significant qualitative changes in saliva of diabetes is a potential
non invasive tool of monitoring treatment outcomes of diabetes
and also could enhance the multidisciplinary management of this
distressing metabolic disease in our resource limited environment.
References
Citation
Oyetola EO, Abimbola TA, Adesina OM, Egunjobi SM, Adebayo OF, et al. Clinical Oral Findings and Salivary Analysis of Patients with and Without
Diabetes Mellitus. J Oral Biol. 2019; 6(2):6.