
Research Article
Physio-Chemical Analysis of Unstimulated Saliva of Healthy Nigerian Population
Oyetola EO1*, Akomolafe RO2, OwotadeFJ3 and Egunjobi SM3
- 11Department of Preventive and Community Dentistry, Obafemi Awolowo University, Nigeria
- 2Department of Physiological Sciences, Obafemi Awolowo University, Nigeria
- 3Department of Oral and Maxillofacial Surgery, Obafemi Awolowo University, Nigeria
*Address for Correspondence: Olufemi OE, Department of Preventive and Community Dentistry, Obafemi Awolowo University, Ile Ife, Nigeria, E-mail: phemyhoye12@yahoo.com
Citation: Oyetola EO, Akomolafe R, OwotadeFJ, Egunjobi S. Physio-Chemical Analysis of Unstimulated Saliva of Healthy Nigerian Population. J Oral Biol. 2018; 5(1): 6
Copyright: © 2018 Oyetola EO, et al. This is an open access article distributed under the Creative Commons Attribution License, which permits unrestricted use, distribution, and reproduction in any medium, provided the original work is properly cited..
Journal of Oral Biology | ISSN: 2377-987X | Volume: 5, Issue: 1
Submission: 09 September, 2018| Accepted: 24 October, 2018| Published: 29 October, 2018
Abstract
Background: Saliva is a potential diagnostic tool in the management ofhuman diseases. Analysis of saliva in healthy individuals is vital to comparison in a diseased state. There is a paucity of data on the physicochemical composition of saliva among Nigerians.
Design: Results: Mean age of the participants was 27.7±7.7 years. The mean unstimulated salivary flow rate was 0.398±0.25 mL/min and was higher in men (p=0.033). The mean specific gravity of the saliva was 0.119±0.14 and was higher in women. The mean concentration of sodium, phosphate, chloride and potassium was2.171±0.9 mmol/L, 0.0354±0.021, 1.552±0.492 and 0.0354±0.021 mmol/L, respectively, and they were higher in women except sodium. The pH of saliva was significantly increased in people above 30 years (7.65) compared to those below 30 years (7.47), t-test, p=0.008.
Conclusion: The unstimulated salivary flow rate and specific gravity were higher in males. There were age and sex variations in the selected salivary parameters.
Keywords
Saliva; Diagnosis; Electrolyte; Organic constituents
Introduction
Oral health is more important than generally appreciated as the mouth gives information about systemic health, in addition, diseases in the mouth could also affect the overall general health [1]. Unfortunately, despite the enormous importance of oral health, the awareness and good oral health practices are generally low most especially in the underdeveloped parts of the world [21].
Saliva is a colorless fluid secreted into the oral cavity by salivary glands and gingival crevicular fluid and is of great importance in the maintenance of oral health due to its roles in maintaining oral mucosa immunity and oral homeostasis [3,4]. The major salivary glands are submandibular, sublingual and parotid gland while the minor salivary glands are widely distributed in the oral mucosa [5]. Saliva performs a wide range of functions due to its versatile contents that are physically and naturally combined, making each of the content to retain or perform its function without interference. Saliva it aids swallowing and mastication (due to the lubricating effects of the mucin) and digestion (due to the presence of salivary digestive enzymes, salivary amylase, and salivary lipase). It is also antibacterial (due to the presence of immunoglobulin’s, lysozyme, lactoperoxidase and so on), anti-caries (due to the presence of fluoride) and aids mechanical cleansing due to its high water content. As a result of the vital functions of saliva, a slight reduction in the whole saliva or its constituents will lead to impairments of the salivary functions and subsequently leading to impaired oral functions. Constituents of saliva vary with neural stimulation, age and emotional states of the individuals [4]. Inability to feed well, oral ulcerations, feeling of dryness in the mouth, oral burning sensation and taste impairments are some common presentations in patients with the reduced salivary flow, this often leads to reduced quality of life in such patients [6].
Of great importance in saliva physiology is the potential use of saliva in the diagnosis of human diseases. The diagnosis is made by comparing the vital indices from the saliva of patients with diseases with that of the standard or healthy patients before an inference is deduced [7]. The fundamental step in this procedure will, therefore, involve knowing the empirical indices for healthy patients. An increase in some constituents of saliva could point to the underlying disease. A common example is increased salivary blood sugar which reflects an impaired glucose metabolism, a condition that is seen in diabetic mellitus. Also, increase salivary urea may indicate renal problems. Several studies on quantitative and qualitative properties of saliva have been conducted among Caucasians [8]. However, studies that aim at determining such properties in Nigerians of different age groups are scanty, probably due to cost implications of carrying out such studies or the general low awareness of oral and systemic health interconnections. Local variations exist in the salivary constituents, for instance, the unstimulated salivary flow rate in healthy subjects which was reported among the Caucasians to be 0.1 mL/min was 2.5 mL/min in the Nigerian population [5,6]. In view of the tendency for racial differences in these important characteristics of human saliva, there is a need to establish the correct values for healthy Nigerians. This is the gap that this study aims at filling.
Materials and Methods
This study, designed as a descriptive cross-sectional study, was carried out in Obafemi Awolowo University Ile Ife, Ife Central Local Government Area of Osun State, Nigeria. Subjects for this study were consenting students and staff of Obafemi Awolowo University, Ile Ife Nigeria. Subjects with history suggestive of systemic and oral disease, pregnant and menstruating women, those with recent or concurrent medication/herbal concoction use and those who just had recent oral surgery procedure were excluded from the study.
Sample size determination
The sample size was calculated using the formula for a descriptive study as reported by Eng. (2003) as follows:
formula 1 Where N is the total number of subjects required. SD is the standard deviation from a known study. Tarbay et al. 1997 had reported the mean unstimulated salivary flow rate of healthy subjects to be 0.397±0.26 mL/min; hence SD was taken as 0.26. Zcrit is a constant called Standard Normal Deviance which is 1.96 at clinical significance of 0.05. D is the total width of an expected Confidence Interval (CI) and was set at 0.065. With the power of 90% and the significance level of 0.05, a sample size of 173 subjects was obtained and rounded up to 200 to allow for attrition
formula 2N= 173
The sample size of 173 subjects obtained and rounded up to 200 to allow for attrition.
Sampling technique
The simple random method was used to select the participants among the pool of staff and students of Obafemi Awolowo University, Ile Ife.
Research instrument
The instrument used for data collection was a self-administered questionnaire. The questionnaire was divided into three sections. Section a elicited information on sociodemographic attributes of the patient. Section B elicited information about the flow rate and biochemical analysis of saliva. Section C elicited information on the assessment of the concentration of selected electrolytes in the saliva. The questionnaire was pre-tested using 20 volunteers.
Ethical considerations
Ethical approval was obtained from the Research and Ethics Committee of the Institute of Public Health, Obafemi Awolowo University, Ile Ife.
Saliva collection
Saliva was collected from all subjects between the hours of 10:00 am and 12:00 am using spitting method [9].
Estimation of salivary urea
This was done using Randox® Kits BT294QY, United Kingdom. The kits followed Urease- Berthelot method of urea estimation. The ammonia is the measured photometrically by Berthelot’s reaction. The procedure for the measurement is essential as contained in the manufacturer instructions and the salivary concentration of urea was calculated using the formula:
formula Standard concentration is a constant =13.10mmol/L
Estimation of salivary creatinine
This was done using Randox® Kits BT294QY, United Kingdom. The kits operate on the principle that creatinine in alkaline solution reacts with picric acid to form a colored complex. The procedure for the measurement is essential as contained in the manufacturer instructions.
The salivary concentration of creatinine was calculated using the formula:
formulaStandard concentration is a constant =169 μmol/L
Estimation of salivary glucose
This was done using Randox® Kits BT294QY, United Kingdom. The kits followed Urease- Berthelot method of urea estimation. The procedure for the measurement is essential as contained in the manufacturer instructions.
The salivary concentration of glucose was calculated using the formula:
Estimation of Salivary pH
This was done using pH meter. The instrument was first calibrated by using standard buffer solution of 4.18, 8 and 11.5 respectively and thereafter 0.0Lml of the sample (saliva) was carried with a pipette to come in contact with the sensitive part of the probe of the pH meter. The pH of the saliva shows immediately on the screen.
Estimation of Specific Gravity
This was done using a volumetric pipette and weighing balance. A volume of 0.01mL of saliva was pipette in a tube that was preweighed. The weight of the 0.0lmL volume of saliva was recorded as vs. The specific gravity was calculated as follows;
The Specific Gravity (SG) is equal to the weight of 1mL saliva, if we are the weight of 0.01 mL, then
SG=WsΧ100g/m
Estimation of electrolytes
This was done with atomic absorbance spectrophotometry using atomic absorption spectrophotometer (PG-990R) which followed the principles of Beer-Lambert Law. The calibrations of each of the samples were first done using standard solutions of the electrolytes following the manufactures instructions. Thereafter, the samples were introduced into the machine which allows for sucking of the samples into the nebulizers where the samples become atomized with high energy flame. The Hollow Cathode lamp which is specific for each of the electrolytes to be measured is inserted to the lamp hole. The hollow cathode lamb releases radiation which is absorbed by the atomized samples. The amount of absorbed radiation reflects the actual concentration of the electrolyte which was displayed on the attached monitor. The values of the absorbance were then used to get the actual concentration from the machine.
Data analysis
Data were analyzed using STATA 11 statistical software (StataCorp, College Station, Texas). Descriptive statistics were used to characterize socio-demographic variables such as age and sex. Analyzing for descriptive factors for salivary constituents with continuous variables include checking for mean, median, mode, and range as appropriate. After subjecting to normality tests, comparison of the mean values at the various age groups and sex were done using students-test and ANOVA since the data showed normal distribution. Statistical significance was set at p<0.05.
Results
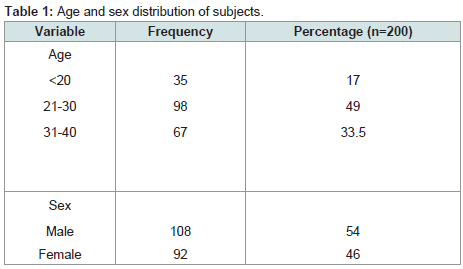
Age and sex distribution of subjects
Two hundred subjects comprising 108 males and 92 females, mean age (SD) 21.7 (7.7) participated in the study. About half (98, 49%) were between ages of 21-30 (Table 1).
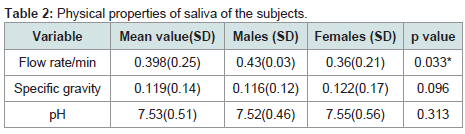
Physical properties of saliva among the subjects
The mean unstimulated salivary flow rate was 0.398±0.25 ml/min. Males had a significantly higher flow rate when compared with females (P=0.033). The mean specific gravity and pH of the participant saliva were 0.119±0.14 and 7.52±0.51 respectively with no statistically significant sex variation p=0.096 and 0.313 respectively (Table 2).
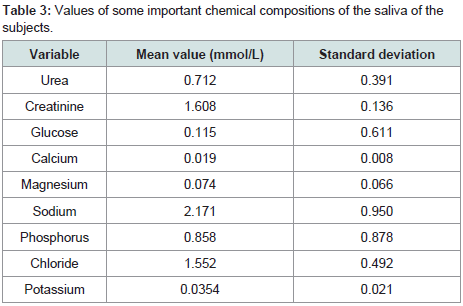
Values of some important chemical compositions of the saliva of the subjects
The most concentrated chemical substance in the present study was sodium ion with the concentration as high as 2.171 mmol/L followed by calcium with a concentration of 0.019 mmol/L. The least concentration was calcium ion with a concentration of 0.19 mmol/L (Table 3).
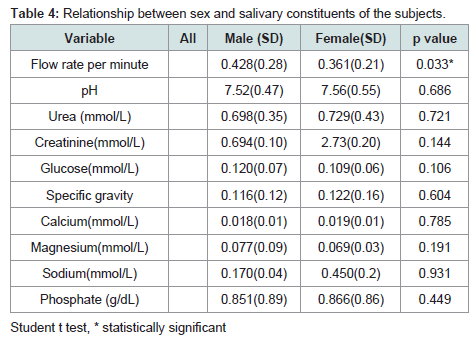
The relationship between sex and salivary constituents of the subjects
Majority of the parameters showed higher values in females with the exception of glucose and magnesium concentrations. However, a significant difference was only seen in salivary flow rate which was significantly higher in females with p=0.0326 and in phosphate concentration which was also higher in females with p=0.449. Glucose and magnesium concentrations were higher in male but the differences were not statistically significant, P=0.1056 and 0.1913 respectively (Table 4).
The relationship between age and salivary constituents of the subjects
The pH of saliva was significantly increased in people above 30 years, p=0.008. Other salivary parameters that are significantly increased at ages above 30 years are creatinine, glucose, specific gravity, calcium, and phosphate concentrations. On the other hand, subjects at ages above 30 years had reduced Sodium and Magnesium concentration but the difference was not statistically significant, p=158 and 0.151 respectively (Table 5).
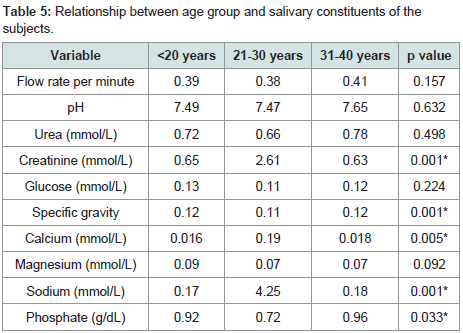
Age-related variations in unstimulated salivary flow rate of the subjects
The highest salivary flow rate was seen between the ages of 31 and 40 years. Subjects ranging in age from 21 to 30 had the lowest flow rate when compared to those below 20 years and those above 30 years (Figure 1).
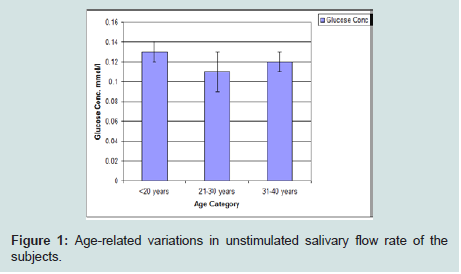
Age-related variations in salivary glucose concentration of the subjects
Glucose concentration was lowest among subjects in the 21 to 30 years age group category. The highest value was seen in subjects within age of 31 to 40 years followed by those with age less than 20 years (Figure 2).
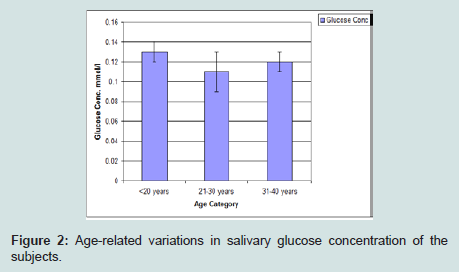
Age-related variations in salivary creatinine concentration of the subjects
Creatinine concentration was highest among those less than 20 years of age, and then the mean values gradually reduce with increasing age (Figure 3).
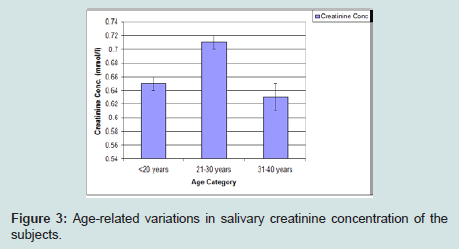
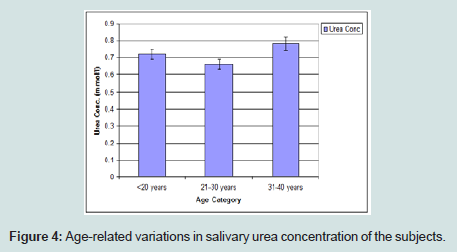
Age-related variations in salivary urea concentration of the subjects
The urea concentration was observed to be gradually increased with age with the highest values recorded at age 31-40 years (Figure 4).
Discussion
The quality and quantity of saliva in the mouth is a reflection of both the general and oral health of the individuals [10]. This study aimed at determining the normal values of selected salivary parameters in our environment with a view to using the values obtained for diagnosis. Saliva consists of inorganic (electrolytes) and organic substances, the concentrations of which vary with respect to the individual disease state and the changes in the environments [4,11,12].
Generally, the mean whole unstimulated salivary flow rate varies from 0.053 mL/min to 0.71 mL/min [13,14]. In this study, the mean unstimulated salivary flow rate was 0.398 ml/min. This result was in agreement with findings from a study among the Brazilians where unstimulated salivary flow rate was 0.33±0.021 mL/min and an Italian population study that reported 0.336 mL/min [15,16]. However, Generally, the mean whole unstimulated salivary flow rate varies from 0.053 mL/min to 0.71 mL/min [13,14]. In this study, the mean unstimulated salivary flow rate was 0.398 ml/min. This result was in agreement with findings from a study among the Brazilians where unstimulated salivary flow rate was 0.33±0.021 mL/min and an Italian population study that reported 0.336 mL/min [15,16]. However,
Sex variations also exist in unstimulated salivary flow rate. Unlike APS et al., who reported higher flow rate among females [4], this study showed higher salivary flow rate in males and this was similar with the findings from a Japanese population and Chinese population [25,26]. The lower salivary flow rate in females has been attributed to the smaller size of major salivary glands found in them and probably the effects of sex hormones [25]. Salivary flow increases with hormone replacement therapy in postmenopausal women indicating that oestrogen and another female hormone may play some roles in improving salivary flow [27].
The concentration of sodium in this study was 2.171 mmol/L, lower than the reports of Kallapur et al. (11.1 mmol/L) Sodium excretion through the sweat glands is usually enhanced in hot weather (dry season) due to dehydration [28]. This study was conducted during the Nigerian dry season (November to April), hence providing the possible reason for reduced salivary sodium.
Like sodium, chloride ion plays vital a role in the maintenance of body fluid osmolality, it is a very important extracellular ion. The concentration of salivary chloride obtained from this study was 15.52 mmol/L. These results were in agreement with a study from European (Belgians) population by Aps et al. 2005 who reported mmol/L [4,15]. The slightly higher value (15.52 mmol/L) found in the present study when compared to the Belgians study might be due to the influence of weather.
Potassium ion concentration in the present study was 0.03 mmol/L. Since potassium is always actively reabsorbed in the salivary ducts, its concentration in the saliva tends to be lower than that in the plasma [4]. According to Ueno et al, plasma and hence salivary potassium are affected by both the cardiovascular and renal status of individuals [29]. Lower potassium concentration (0.03 mmol/L) was obtained from this study when compared with 20 mmol/L reported by Aps et al. 2005 [4]. The fact that this study was also conducted in dry season during which reduction in both quantity and quality of saliva produced is expected may be the reason for the reduced value. Dietary factors and genetic variability have also been linked to heart failure and blood potassium [30]. Angiotensin Receptor Type 1 (AGTR1), which plays a vital role in maintaining blood potassium through Renin Angiotensin Aldosterone System (RAAS), is located on chromosome 3q21-q25 [31]. Genetic variations of this receptor locus on the chromosomes may be another possible reason for the differences in salivary potassium.
Phosphate is quite important in maintaining intracellular fluid homeostasis and is freely filtered into the saliva. The salivary concentration of 8.8 mmol/L for phosphate in this study was higher than that of Rockenberch et al. that reported 5.6 mmol/L [32]. Alterations in calcium and phosphorus metabolism are often reflected in abnormalities of urinary excretion as well as abnormal production of parathyroid hormone. Dietary variation, habits and genetic variations in the locus coding for the hormone receptors may be responsible.
The pH of 7.5 observed in this study is similar to the finding of some earlier studies [14,32]. The presence of standardized buffer systems in the body which a fairly constant acid-base balance in the body irrespective of the environment and diets may be responsible.
Glucose concentration in this study was 0.115 mmol/L, greater than 0.071 mmol/L that was reported by Lasisi et al. The patients who participated in Lasisi’s study fasted overnight, unlike ours who did not fast prior to saliva collection. This may be responsible for the differences in the reports of the two studies. This study also showed a higher salivary glucose among subjects aged 30 years and above. Increasing age is associated with impaired glucose metabolism.
Urea is a product of metabolism of protein which is normally secreted by the kidneys and also not a normal constituent of saliva. In this study, salivary urea concentration of 7.12 mmol/L was obtained. This falls within the range of value of earlier studies which was 7.01-7.22 mmol/L [14]. In a healthy individual with functional kidneys, the concentration of blood urea which also determines salivary urea is well regulated. Salivary urea is essentially a reflection of significant changes in the pathologies involving the kidneys. In this study, the subjects were healthy individuals and hence the findings. Age changes do not show any direct relationship in this study as the concentration was maintained at 0.7 mmol/l, this also may be reflecting the renal impairment among some of the apparently healthy subjects.
Salivary creatinine concentration of 1.608 mmol/L reported in our study is higher than the findings by Lasisi et al. 2016, a study done on Nigerian population during raining season, and that of a Turkish population by Render et al. 2017 that was 0.02 mmol/L and 0.95 mmol/L respectively. Salivary creatinine increases with muscular activities which appear to be commoner among young adults that were used in this study than in the adult subjects used by Lasisi et al. and Render et al. This may be responsible for the relatively higher value obtained in this study. In addition, this study was conducted during dry season which was associated with dehydration and increased salivary creatinine. Other possible reasons include variations in genetic makeup and increased protein diets.
The importance of developing baseline values for assisting salivary diagnosis is vital for medical practice. It is, however, important to take into consideration the average weather condition where the saliva collection was done, age of the patients, choice of diets peculiar to the patients, habits and genetic variability. When all these factors are taken into consideration, it might provide a promising, widely acceptable and efficient diagnostic method in the future. It also noteworthy that the rising concentration of salivary concentration of renal markers shows the possibility of renal impairment as the age increases.
Conclusion
This study has supplied the local values of some quantitative and qualitative salivary parameters. We observed little variations among the selected parameters which show evidence of changes in our genetic and environmental factors when compared to the other countries of the world. A conspicuous finding in this work was a higher salivary flow rate among the males which does not agree with some earlier studies which shows female predilection. Specific gravity was also found to be higher in men. These variations illustrate the uniqueness of the people of Nigeria, and it is necessary to conduct research on the basic data of local populations rather than blindly using data from foreign populations to manage local patients.
References
- Mishra MN (2012) Mouth Mirrors Systemic Diseases. Indian J Public Health Res Dev 3: 83-86.
- Sarumathi T, Saravanakumar B, Datta M, Nagarathnam T (2013) Awareness and knowledge of common oral diseases among primary care physicians. J Clin Diagn Res 7: 768-771.
- Puy CL (2006) The role of saliva in maintaining oral health and as an aid to diagnosis. Med Oral Patol Oral Cir Bucal 11: E449-E455.
- Aps JK, Martens LC (2005) Review: The physiology of saliva and transfer of drugs into saliva. Forensic Sci Int 150: 119-131.
- Humphrey S, Williamson RT (2001) A review of saliva: Normal composition, flow, and function. J Prosthet Dent 85: 162-169.
- Oyetola EO, Owotade FJ, Agbelusi GA, Fatusi O, Sanusi A, et al. (2015) Salivary flow rates of nigerian patients with chronic kidney disease: A case control study. J Contemp Dent Pract 16: 264-269.
- Venkatapathy R, Govindarajan V, Oza N, Parameswaran S, Pennagaram Dhanasekaran B, et al. (2014) Salivary creatinine estimation as an alternative to serum creatinine in chronic kidney disease patients. Int J Nephro 2014: 742-724.
- Shirzaiy M, Heidari F, Dalirsani Z, Dehghan J (2015) Estimation of salivary sodium, potassium, calcium, phosphorus and urea in type II diabetic patients. Diabetes Metab Syndr 9: 332-336.
- Navazesh M, Kumar SK (2008) Measuring salivary flow challenges and opportunities. J Am Dent Assoc 139: 355-405.
- Tschoppe P, Wolgin M, Pischon N, Kielbassa AM (2010) Etiologic factors of hyposalivation and consequences for oral health. Quintessence Int 41: 321-333.
- Agha-Hosseini F, Dizgah I, Amirkhani S (2006) The composition of unstimulated whole saliva of healthy dental students. J Contemp Dent Pract 7: 104-111.
- de Almeida P, Gregio A, Machado M, de Lima A, Azevedo L (2008) Saliva Composition and Functions: A Comprehensive Review. J Contemp Dent Pract 9: 72-80.
- Yamamoto K, Kurihara M, Matsusue Y, Imanishi M, Tsuyuki M, et al. (2009) Whole saliva flow rate and body profile in healthy young adults. Arch Oral Biol 54: 464-469.
- Lasisi TJ, Raji YR, Salako BL (2016) Salivary creatinine and urea analysis in patients with chronic kidney disease: a case control study. BMC Nephrol 17: 10.
- Ana CU, Maria SMS, Paulo C, Teresa CS (2010) Comparative study of the concentration of salivary and blood glucose in type 2 diabetic patients. J Oral Sci 52: 293-298.
- Foglio-Bonda PL, Brilli K, Pattarino F, Foglio-Bonda A (2017) Salivary flow rate and pH in patients with oral pathologies. Eur Rev Med Pharmacol Sci 21: 369-374.
- Shern RJ, Fox PC, Li SH (1993) Influence of age on the secretory rates of the human minor salivary glands and whole saliva. Arch Oral Biol 38: 755-761.
- Sawair FA, Ryalat S, Shayyab M, Saku T (2009) The unstimulated salivary flow rate in a jordanian healthy adult population. J Clin Med Res 1: 219-225.
- Zwier N, Huysmans MC, Jager DH, Ruben J, Bronkhorst EM, et al. (2013) Saliva parameters and erosive wear in adolescents. Caries Research 47: 548-552.
- Baptista H, Lopes Cardoso I (2017) Steinert syndrome and repercussions in dental medicine. Arch Oral Biol 75: 37-47.
- Morzel M, Truntzer C, Neyraud E, Brignot H, Ducoroy P, et al. (2017) Associations between food consumption patterns and saliva composition: Specificities of eating difficulties children. Physiol Behav 173: 116-123.
- Karakoulaki S, Tortopidis D, Andreadis D, Koidis P (2015) Relationship between sleep bruxism and stress determined by saliva biomarkers. Int J Prosthodont 28: 467-474.
- Kavanagh DA, O’Mullane DM, Smeeton N (1998) Variation of salivary flow rate in adolescents. Arch Oral Biol 43: 347-352.
- Inoue H, Ono K, Masuda W, Morimoto Y, Tanaka T, et al. (2006) Gender difference in unstimulated whole saliva flow rate and salivary gland sizes. Arch Oral Biol 51: 1055-1060.
- Li-Hui W, Chuan-Quan L, Long Y, Ru-Liu L, Long-Hui C, et al. (2016) Gender differences in the saliva of young healthy subjects before and after citric acid stimulation. Clin Chim Acta 460: 142-145.
- Suri V, Suri V (2014) Menopause and oral health. J Midlife Health 5: 115-120.
- Kallapur B, Ramalingam K, Bastian, Mujib A, Sarkar A, et al. (2013) Quantitative estimation of sodium, potassium and total protein in saliva of diabetic smokers and nonsmokers: A novel study. J Nat Sci Biol Med 4: 341-345.
- Ueno H, Yoshimura M, Nakayama M, Yamamuro M, Nishijima T, et al. (2010) Clinical factors affecting serum potassium concentration in cardio-renal decompensation syndrome. Int J Cardiol 138: 174-181.
- Lillvis JH, Lanfear DE (2010) Progress toward genetic tailoring of heart failure therapy. Curr Opin Mol Ther 12: 294-304.
- Martin MM, Willardson BM, Burton GF, White CR, McLaughlin JN, et al. (2001) Human angiotensin II type 1 receptor isoforms encoded by messenger RNA splice variants are functionally distinct. Mol Endocrinol 15: 281-293.
- Rockenbach MI, Marinho SA, Veeck EB, Lindemann L, Shinkai RS, et al. (2006) Salivary flow rate, pH, and concentrations of calcium, phosphate, and sIgA in Brazilian pregnant and non-pregnant women. Head Face Med 2: 44.