
Research Article
*Address for Correspondence: Allan M Sheppard, Developmental Epigenetics Group, Liggins Institute, The University of Auckland, 85 Park Road, Grafton, Auckland 1023, New Zealand, E-mail: a.sheppard@auckland.ac.nz
Citation: Zarfeshani A, Ngo S, Murphy R, Sheppard AM. Micro RNAs as Biomarkers of Bariatric Surgery Outcome and Putative Regulators of Hepatokines Selectively after Gastric Bypass, but not Sleeve Gastrectomy. J Obes Bariatrics. 2016;3(1): 12.
Copyright © 2016 Zarfeshani A, et al. This is an open access article distributed under the Creative Commons Attribution License, which permits unrestricted use,distribution, and reproduction in any medium, provided the original work is properly cited.
Journal of Obesity and Bariatrics | ISSN: 2377-9284 | Volume: 3, Issue: 1
Submission: 10 February 2016| Accepted: 16 February 2016 | Published: 22 February 2016
Micro RNAs as Biomarkers of Bariatric Surgery Outcome and Putative Regulators of Hepatokines Selectively after Gastric Bypass, but not Sleeve Gastrectomy
Aida Zarfeshani1, Sherry Ngo1, Rinki Murphy2 and Allan M Sheppard1*
- 1Developmental Epigenetics Group, Liggins Institute, The University of Auckland, 85 Park Road, Grafton, Auckland 1023, New Zealand
- 2Department of Medicine, The University of Auckland, 85 Park Road, Grafton, Auckland 1023, New Zealand
*Address for Correspondence: Allan M Sheppard, Developmental Epigenetics Group, Liggins Institute, The University of Auckland, 85 Park Road, Grafton, Auckland 1023, New Zealand, E-mail: a.sheppard@auckland.ac.nz
Citation: Zarfeshani A, Ngo S, Murphy R, Sheppard AM. Micro RNAs as Biomarkers of Bariatric Surgery Outcome and Putative Regulators of Hepatokines Selectively after Gastric Bypass, but not Sleeve Gastrectomy. J Obes Bariatrics. 2016;3(1): 12.
Copyright © 2016 Zarfeshani A, et al. This is an open access article distributed under the Creative Commons Attribution License, which permits unrestricted use,distribution, and reproduction in any medium, provided the original work is properly cited.
Journal of Obesity and Bariatrics | ISSN: 2377-9284 | Volume: 3, Issue: 1
Submission: 10 February 2016| Accepted: 16 February 2016 | Published: 22 February 2016
Abstract
The obesity prevalence is increasing worldwide, resulting in more bariatric surgeries interventions being performed. However, the success of surgical approaches in treating obesity and its co-morbidities varies between types of surgery and is not readily explained by baseline clinical features. Better understanding is needed of the metabolic shifts, and their underpinning mechanisms, which result from different types of surgery.We investigated effects of bariatric surgery on miRNA profile before and after of either gastric bypass surgery (GBP) or sleeve gastrectomy (SG) in nine obese patients with type 2 diabetes mellitus (T2DM). Recent work has identified early reduction in post-operative circulating levels of the hepatokine fetuin-A (FetA) after GBP but not SG, as a putative candidate to monitor the intervention efficacy. Therefore, we used FFA-induced HepG2 cells to indicate the underlying mechanism these miRNAs could lead to increased FetA level.
Here we defined a specific set of miRNA species whose postsurgery expression among GBP patients correlated strongly with beneficial decreases in body mass index (BMI) and blood glucose (HbA1c) levels. Additionally, we reported that expression of both FetA and leukocyte cell-derived chemotaxin2 (LECT2; another major hepatokine) was dependent on intracellular signaling by metabolic regulator myostatin (MSTN). Finally, we linked the miR-335 activity in particular to FFA-induced, MSTN-dependent regulation of FetA.
These data provide novel mechanistic insights into the metabolic stimulation of hepatokine expression, and the epigenetics role in mediating hepatocellular changes associated with greater weight loss and diabetes remission observed with GBP rather than SG.
Keywords
Bariatric surgery; Hepatokines; MicroRNA; MyostatinAbbreviations
ACC1: Acetyl-CoA Carboxylase; AMPK: AMP-Activated Protein Kinase; BMI: Body Mass Index; BSA: Bovine Serum Albumin; DMEM: Dulbecco’s Modified Eagle Medium; FFA: Free Fatty Acid; FBS: Fetal Bovine Serum; FetA: α2-HS-Glycoprotein (fetuin-A); GBP: Gastric Bypass Surgery; GPAT1: Glycerol-3-Phosphate Acyltransferase; HbA1c: Glycosylated Haemoglobin Level; HDL: High-Density Lipoprotein; HFD: High Fat Diet; HOMA-IR: Homeostatic Model Assessment-Insulin Resistance; IR: Insulin Resistance; LECT2: Leukocyte Cell-derived Chemotaxin 2; MSTN: Myostatin; p(Ser2448)-mTORC1: Mammalian Target of Rapamycin Complex 1; LDL: Low-Density Lipoprotein; NAFLD: Nonalcoholic Fatty Liver Disease; NS: Non- Significant; PBS: Phosphate Buffered Saline; PPARγ: Peroxisome Proliferator-Activated Receptor Gamma; PPIA: Peptidyl-Prolyl Isomerase A; qPCR: Real-time Polymerase Chain Reaction; p70S6K1: Ribosomal Protein S6 Kinase Beta-1; RMA: Robust Multi-Array Average; SDHA: Succinate Dehydrogenase Complex, subunit A; SG: Sleeve Gastrectomy; SREBP-1c: Sterol Regulatory Element-Binding Protein 1c; TSC2: Tuberous Sclerosis Complex 2; TG: Triglyceride; TGF-β: Transforming Growth Factor-β; T2DM: Type 2 Diabetes MellitusIntroduction
The rate of obesity is increasing worldwide, with at least 600 million people recently classified as clinically obese [1] and is associated with elevated morbidity, mortality and healthcare costs [2]. Although bariatric surgery is a more effective intervention than other obesity treatment [2], overall leading to efficient weight loss, the different surgical procedures yield differing degrees of improvement in the attendant metabolic complications, particularly with regard to the remission of type 2 diabetes mellitus (T2DM) [3,4] which is not readily explained by overall weight loss [2]. The majority of prospective studies comparing the remission of T2DM following gastric bypass (GBP) and sleeve gastrectomy (SG) types of bariatric surgery suggest superior results with GBP than SG despite similar concurrent weight loss. While SG is considered a ‘restrictive’ type of surgery where the majority of the stomach is removed, GBP combines this restriction with limited malabsorption, whereby the stomach is reduced to a small pouch (< 30 mL) connected via a tight outlet to the jejunum just past the duodenum, while the jejunal stump is anastomosed to the lower jejunum in a Y conformation. While both procedures produce the rapid induction of negative calorie balance after surgery, the additional foregut bypass and more rapid nutrient delivery to the hindgut may underlie the superior T2DM remission following GBP [5,6].Currently, pre-operative clinical assessment is used to anticipate likely success and is the basis of strategies for individualizing postoperative risk, rather than any assessment of likely metabolic benefit based on objective predictive biomarkers or models [7,8]. While the observed weight loss is initially comparable between GBP and SG over the first 3 years, the remission of T2DM and longer-term outcomes are less predictable [9]. However, the regain of substantial weight appears to be more frequent following SG compared to GBP [10]. Therefore, defining the underlying mechanisms that characterize post-surgery metabolic responses and differentiate the surgical approaches would improve understanding of the physiology linking obesity and T2DM and provide biomarkers with utility for predicting long-term metabolic response ahead of the standard clinical measures of metabolic syndrome. Lower glycosylated haemoglobin (HbA1c), higher C-peptide levels and a shorter duration of diabetes are associated with increased rate of T2DM remission [11,12]. The greater remission of T2DM observed after GBP rather than SG is thought to be due to the greater impact of GBP on gut hormones, bile acids and gut microbiota, however, the precise mechanisms underlying this are not well defined. We hypothesized that the epigenetically mediated alteration of hepatokines such as fetuin-A (FetA; also known as α2- HS-glycoprotein) level that have recently been shown to decrease soon after GBP [13], may also be functionally important for driving remission.
Obesity is associated with the atypical secretion of liver-derived hepatokines [14,15]. FetA is expressed predominantly in the liver [16] and plays a major role in regulating insulin sensitivity, via the inhibition of insulin receptor tyrosine kinase mainly in liver, and peripherally in skeletal muscle [17]. FetA mRNA expression andcirculating serum levels are increased in mice and humans with high liver-fat content [18,19], suggesting this hepatokine may be key to understanding lipid-induced inflammation and metabolic syndrome disorders. In addition, leukocyte cell-derived chemotaxin 2 (LECT2), another secreted protein expressed mainly by the liver, is implicated in the homeostasis of hepatic natural killer cells and maybe represent a molecular link between obesity and insulin resistance (IR) in skeletal muscles [20]. However, its importance in the context of over-nutrition induced hepatic fat accumulation has not yet been established.
Increasingly, the intracellular form of myostatin (MSTN), a member of the transforming growth factor-β (TGF-β) superfamily typically associated with suppressing muscle growth, has been linked with the regulation of whole body metabolism. Elevated MSTN expression is linked with metabolic disorders, such as obesity [21] and T2DM [22], while MSTN-null mice are resistant to high fat-induced IR and obesity [23]. In this study we show that MSTN regulates palmitate stimulated FetA expression in liver cells. Further, a pilot study of pre- and post-operative blood samples identifies miRNA species whose expression is strongly correlated with post-GBP levels of BMI and HbA1c. We then demonstrate FFA stimulation of these miRNA in liver cells, and that suppression of miR-355 in particular, inhibits the palmitate induced expression of both MSTN and FetA. Thus, obesity-dependent hepatokine production is likely to be a metabolic shift driven by the epigenetically dependent activation of MSTN signalling pathways [24-29].
Material and Methods
Chemicals and antibodiesLow-glucose Dulbecco’s modified eagle medium (DMEM) and fetal bovine serum (FBS) were purchased from Invitrogen (CA, USA). The rapamycin was from Calbiochem (Billerica, MA, USA). All other chemicals were from Sigma (St. Louis, MO, USA) unless otherwise stated. Antibodies for mTOR, pmTOR, AMPK and pAMPK were from Cell Signaling Technology (Boston, MA, USA) and B-actin antibody was from Santa Cruz Biotechnology (Santa Cruz, CA, USA). All these antibodies were previously characterized. The predesigned miRNA primers/ inhibitors and siRNAs were from Qiagen (Hilden, Germany).
Human clinical study
Nine obese subjects with T2DM participated in a prospective randomised bariatric surgery (four received GBP and five received SG). Serum samples were obtained 3 days pre-operatively and 1 year post-operatively after either GBP or SG. Detailed clinical information about these subjects is presented elsewhere (Evennett NJ et al. in preparation). All patients provided written informed consent and the experiments conformed to the principles set out in the WMA Declaration of Helsinki and the Department of Health and Human Services Belmont Report. All experimental protocols were registered at https://clinicaltrials.gov/ (NCT01486680) and approved by our regional ethics committee (NZ93405).
Cell culture and treatment
The human hepatoma HepG2 cell line (ATCC, Manassas, VA, USA) was cultured in DMEM supplemented with 10% FBS and incubated in a humidified atmosphere of 5% CO2 at 37 °C. Cells were seeded at 105 cells/cm2 and after 36 hours, washed twice with serumfree medium followed by overnight incubation before treating (or not) with FFAs. Sodium palmitate and sodium oleate were conjugated to 2% fatty acid-free bovine serum albumin (BSA) dissolved in 50% ethanol in phosphate buffered saline (PBS). In all experiments, cells were treated with 0.25 mM of palmitate-BSA and oleate-BSA for 24 hours unless otherwise stated and 2% BSA was used as control. Cells were pre-incubated with rapamycin (10 nM in DMSO) for either 3 hours or 12 hours prior to the addition of sodium palmitate.
miRNA microarray
Frozen plasma samples thawed on ice at room temperature and were centrifuged to remove insoluble material. 200 μl of each supernatant was transferred to new tubes and 1ml of Qiazol was added. After incubation, 200 μl of chloroform and 1.5 vol of ethanol was added before adding the sample to a Qiagen miRNeasy serum/ plasma kit column (Qiagen, Hilden, Germany) and then processed according to the manufacturer’s instruction. Reverse transcription was carried out using 155 ng total RNA. Then, cRNA was conjugated with Biotin using Affymetrix Flash Tag Biotin HSR RNA Labeling kit. The fragmented-Biotin-labelled cRNA was then used in the array (Affymetrix GeneChip, miRNA 4.0). After removing unbounded RNA by washing, hybridization was evaluated by fluorescent staining (GeneChip Hybridization, Wash and Stain kit) before scanning with a GeneChip Scanner 3000 system. Robust multi-array average (RMA) background correction and quartile normalization also used to modify signals intensity. Log2 transformed values were used for further statistical analysis.
RNA isolation and quantitative real-time PCR
Criteria for candidate miRNA selection for qPCR validation were: (1) at least a ranked ± 2 fold change in differential expression from the microarray analysis, (2) their putative function in the context of obesity and diabetes based on the existing literature, (3) in silico identification of predicted or validated miRNA targets using miRBase (http://microrna.sanger.ac.uk/) and miRWalk (http://www. umm.uni-heidelberg.de/apps/zmf/mirwalk/) databases.
Total RNA including miRNAs was isolated from treated or not HepG2 cells with FFAs using PureLink RNA Mini Kit (Invitrogen, CA, USA). RNA was quantitated using a NanoDrop ND-1000 Spectrophotometer (NanoDrop Technologies, DE, USA). 2 μg of total RNA was used for cDNA synthesis using Transcriptor First Strand Synthesis kit (Roche, Mannheim, Germany). Real-time polymerase chain reaction (qPCR) analysis was carried out in 10 μl volumes containing Light Cycler 480 SYBR Green (Roche, Mannheim, Germany), 0.5 mM of reverse or forward PCR primers (Table 1) and 1 μl of first-strand cDNA on a LightCycler-480 II (Roche, Switzerland). The mRNA expression levels were normalized against peptidylprolyl isomerase A (PPIA) and succinate dehydrogenase complex, subunit A (SDHA). The cDNA synthesis was carried out with 2 μg total RNA using a miScript II RT Kit (Qiagen, Hilden, Germany) and expression of the miR-17, miR-27b, miR-29a, miR-99a, miR-148b, miR-192, miR-335 and miR-4532 was examined with miScript SYBR Green PCR kit and predesigned miScript primers (Qiagen, Hilden, Germany). Data was normalized to snoRNA SNORD72 and snRNA RNU6-2 expressions as their expression levels remained relatively constant across the samples.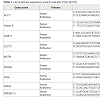 Western blotting
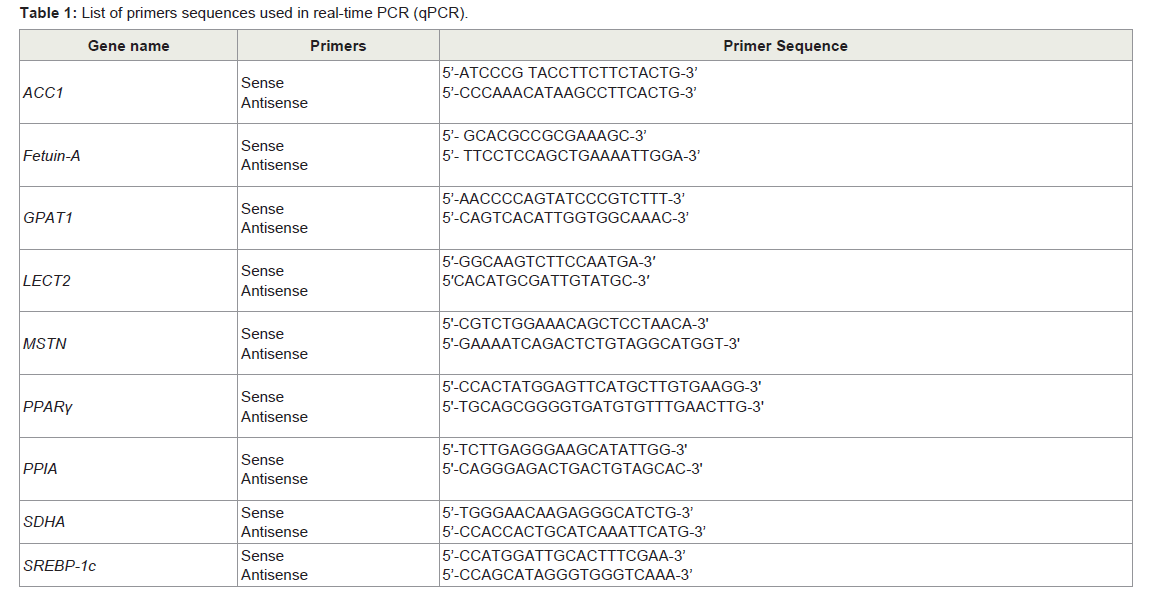
Table 1: List of primers sequences used in real-time PCR (qPCR).
HepG2 cells were washed twice with ice-cold PBS and lysed with ice-cold lysis buffer containing 50 mM HEPES, 150 mM NaCl, 10 mM EDTA. Na2 and 1% Triton X-100 with protease and phosphatase inhibitors. 20 μg of protein from whole cell lysates was then resolved by 10% SDS-PAGE gels and transferred to polyvinylidene fluoride membranes (Millipore, MA, USA). Primary and secondary antibodies were diluted in 3% BSA/PBS-0.1% Tween 20. Protein bands were visualised by using enhanced chemiluminescense using ECL reagent (ThermoScientific, Meridian, USA). Image J software (National Institutes of Health; http://imagej.nih.gov/ij/) was used for densitometric analysis of the protein bands.
Reverse transfection
Predesigned MSTN siRNA (4392420-s5679, Invitrogen, CA, USA) or miScript miRNA inhibitors for miR-27b (MIN0000419, Qiagen, Hilden, Germany), miR-29a (MIN0000086, Qiagen, Hilden, Germany), miR-192 (MIN0000222, Qiagen, Hilden, Germany) and miR-335 (MIN0000765, Qiagen, Hilden, Germany) were used to inhibit MSTN and differentially expressed miRNAs (Qiagen, Hilden, Germany) following qPCR to assess their target genes expression. Inhibitors and negative control oligonucleotides (4390843/4464076, Invitrogen, CA, USA) were reverse transfected into HepG2 cells in 6-well plates using Lipofectamine RNAiMAX (Invitrogen, CA, USA). In brief, Lipofectamine and diluted inhibitors were incubated with Opti-MEM I Medium (Invitrogen, NY, USA) in the wells for 20 min at room temperature. Cells were then added at a density of 105 cells/ ml. Transfected cells were washed twice with serum-free medium followed by overnight incubation and exposed to FFA depends on the assays.
Statistical analysis
IBM SPSS statistical program (version 21, NY, USA) was used for data analysis. All results were presented as mean ± SEM from at least three independent experiments done in triplicates. Either one-way ANOVA with a LSD post-hoc test or independent samples t-test with SD was used to determine differences between groups. Pearson correlation analysis with a two-tailed test of significance was performed. P ≤ 0.05 was considered statistically significant.
Results
Clinical characteristicsFor this study, subjects were chosen based on similarity of baseline characteristics with respect to pre-operative T2DM and morbid obesity. One year post surgery, both post-GBP (P ≤ 0.05) and post- SG subjects showed a loss in body weight compared to pre-surgery, however it was not significant in SG (Table 2). These subjects averaged a body mass index (BMI) of 29.05 (post-GBP) and 28.62 (post-SG) indicating significantly improved post-surgery BMI classification from Class II/III obesity to overweight. Waist circumference was ignificantly improved from 124.33 ± 7.2 pre-GBP to 96.75 ± 14.5 post-GBP (P ≤ 0.05; Table 2). A similar improvement was also seen between pre- and post-SG albeit not significant. (HbA1c), as a proxy for blood glucose, was significantly decreased by about 20 mM (P ≤ 0.05) from about 65 mM pre-surgery to about 45 mM post-surgery. Subjects ‘homeostatic model assessment of insulin resistance’ (HOMA-IR) decreased from >3 before surgery to about 2.1 after both surgery types, although not to statistically significant levels (Table 2). Blood pressure, triglyceride (TG) and high-density lipoprotein (HDL) were in the normal range either before or after surgery considering that medications to lower glucose or TG were used pre-operation. The increased post-operative low-density lipoprotein (LDL) level could be also be accounted by discontinued medications and altered dietary behaviours (Table 2). All subjects, immediately pre-operation were on a very low calorie diet to achieve pre-operative weight loss and reduce liver fat to make laparoscopic surgery safer. This diet may have affected HOMA-IR and lipid measurements.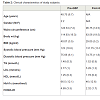 Distinct microRNA expression profile between pre- and post-bariatric surgery
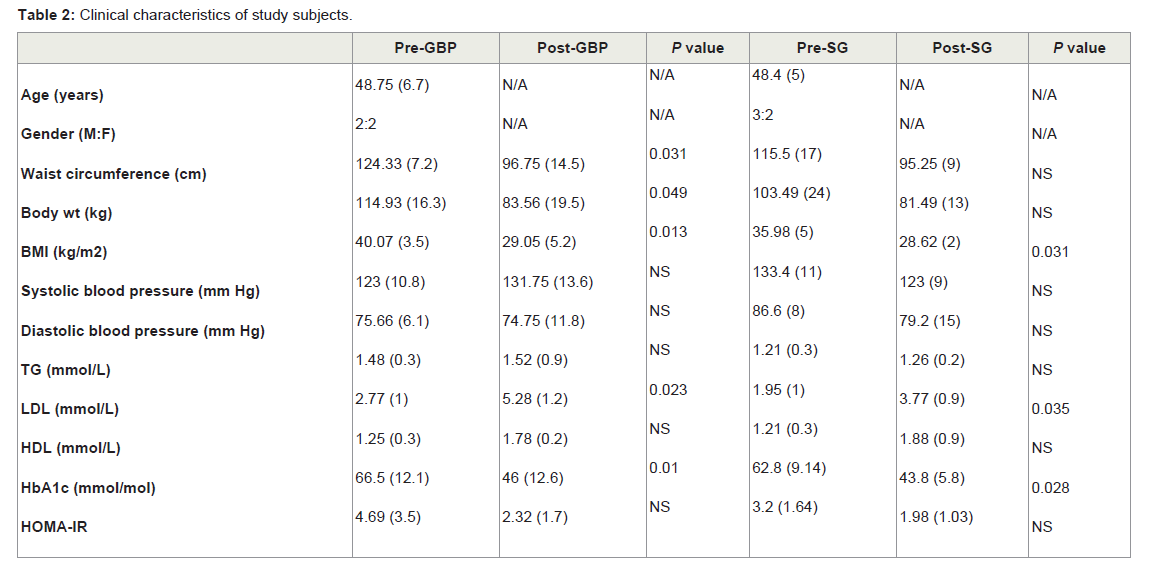
Table 2: Clinical characteristics of study subjects.
To explore changes in miRNA expression profile in reponse to weight loss after bariatric surgery, pre- and post-surgery sera wereassayed using the Affymetrix GeneChip microarray. MiRNAs with at least ± 2 fold differential expression (P ≤ 0.05) were selected for further analysis. Among these, 71 and 12 miRNAs were up-regulated post GBP and SG respectively, while 209 and 60 miRNAs were downregulated post GBP and SG respectively. Hierarchical clustering revealed distinct clustering of pre-GBP from post-GBP subjects (Figure 1A). However, the clustering of pre-SG from post-SG subjects was less distinct compared that of GBP surgery type (Figure 1B). That, our data show a distinct differential miRNA profile resulting from GBP rather than SG is suggestive of GBP surgery type being a more efficacious intervention compared to SG. Based on our criteria of generating a shortlist of high-confidence candidate miRNAs for further evaluation in our HepG2 in vitro model, we identified 8 miRNAs. This functionally informed list of differentially expressed miRNAs is summarized in Figure 1C.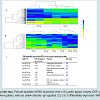 Fatty acids induced hepatokines expression in HepG2 cells
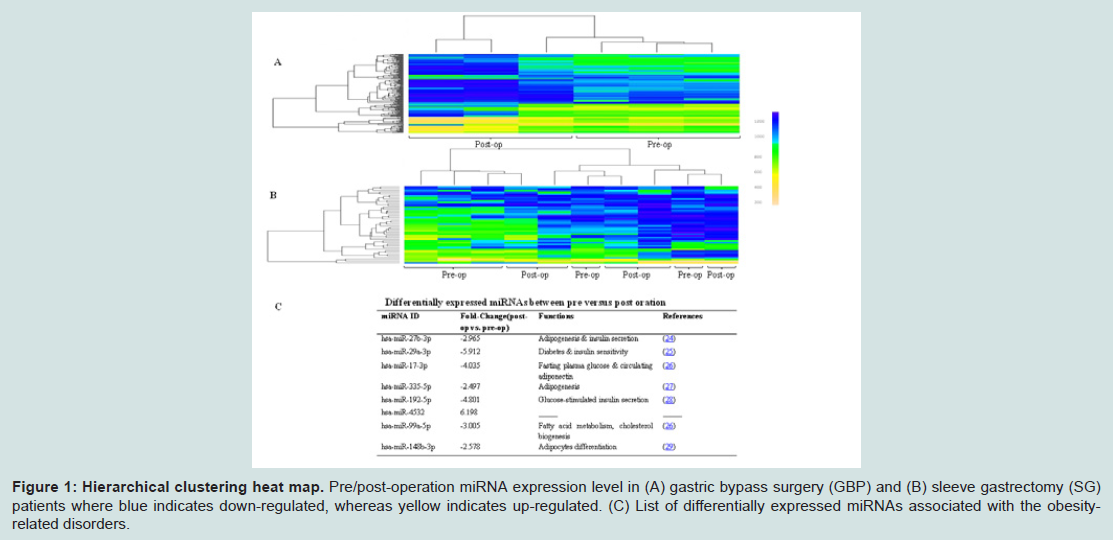
Figure 1: Hierarchical clustering heat map. Pre/post-operation miRNA expression level in (A) gastric bypass surgery (GBP) and (B) sleeve gastrectomy (SG) patients where blue indicates down-regulated, whereas yellow indicates up-regulated. (C) List of differentially expressed miRNAs associated with the obesityrelated disorders.
Circulating FFAs from visceral fat stores can lead to hepatic fat accumulation which is associated with up-regulation of certain hepatokines including FetA which was also downregulated after GBP but not SG in subjects from similar cohort study [13]. To investigate changes in expression of FFA-responsive hepatokines, we induced HepG2 cells with palmitate or oleate, and then assessed RNA level of candidate genes by real time qPCR. Peroxisome proliferator-activated receptor gamma (PPARγ) is a nuclear receptor that is elevated in fatty liver and regulates hepatic TG homeostasis [30]. We found that palmitate- and oleate-treated HepG2 increased PPARγ expression by 3 fold (P ≤ 0.01) and 5.7 fold (P ≤ 0.01) respectively compared to untreated cells (control) (Figure 2A). In addition, palmitate and oleate stimulated the expression of acetyl-CoA carboxylase (ACC1) and glycerol-3-phosphate acyl transferase (GPAT1) up to 2.1 fold (P ≤ 0.01) and 1.8 fold (P ≤ 0.05), respectively (Figure 1A); the latter are two key enzymes associated with hepatic FA biosynthesis [31]. We also found that palmitate and oleate stimulated the expression of sterol regulatory element-binding protein 1c (SREBP-1c), a transcription factor that plays a key role in regulating the expression of these hepatic lipid synthesis genes [32] by 2.6 fold (P ≤ 0.01) compared to control (Figure 2A). Hepatokine expression correlates well with elevated hepatic mRNA levels of key enzymes involved in lipid metabolism and may be functionally linked with progression to non-alcoholic fatty liver diseases (NAFLD), obesity and systemic IR [20,33], consistent in both in vitro and animal models, and with circulating levels measured in human cohorts [14]. To assess whether FFA, induced changes in endogenous expression of these hepatokines in vitro, we measured mRNA levels after palmitate and oleate treatment in HepG2 cells. We found that FetA was overexpressed by about 2.6 fold (P ≤ 0.01) in FFA-induced cells (Figure 2B) compared to control. In contrast, LECT2 was up-regulated by 2.9 fold (P ≤ 0.01) after induction with palmitate, but not oleate (Figure 2B).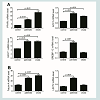 Myostatin mediates the effects of free fatty acids on hepatokine Fetuin-A
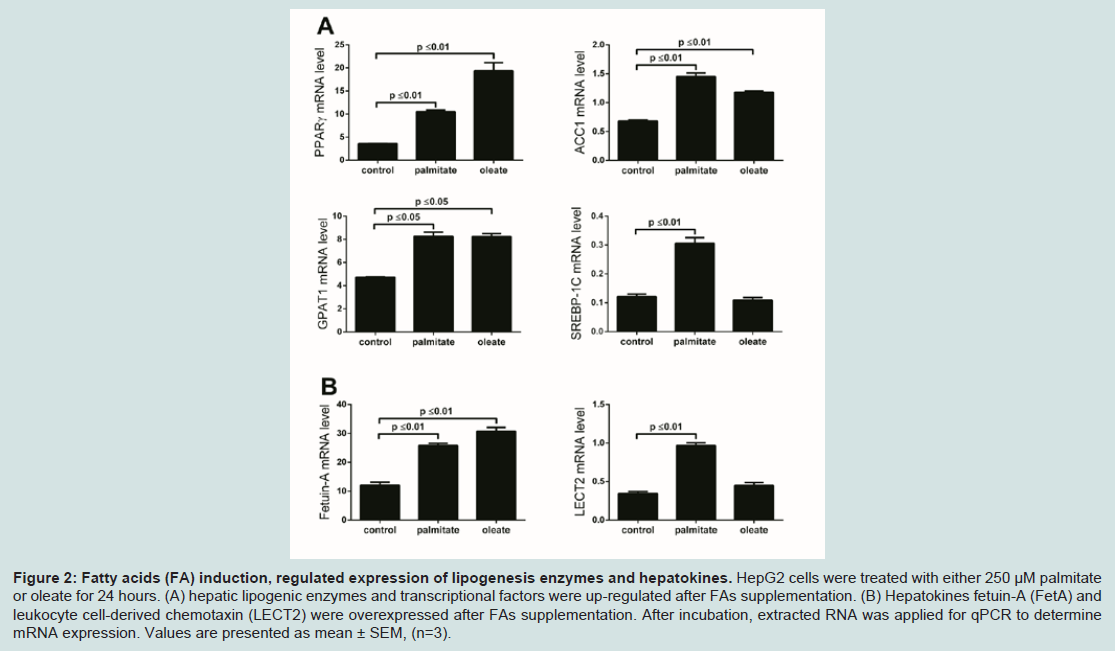
Figure 2: Fatty acids (FA) induction, regulated expression of lipogenesis enzymes and hepatokines. HepG2 cells were treated with either 250 μM palmitate or oleate for 24 hours. (A) hepatic lipogenic enzymes and transcriptional factors were up-regulated after FAs supplementation. (B) Hepatokines fetuin-A (FetA) and leukocyte cell-derived chemotaxin (LECT2) were overexpressed after FAs supplementation. After incubation, extracted RNA was applied for qPCR to determine mRNA expression. Values are presented as mean ± SEM, (n=3).
Myostatin depletion attenuates hepatic steatosis and reduces adipose formation in high fat diet (HFD)-induced obese mice [34]. Perhaps unsurprising then, we found that palmitate dramatically induced MSTN expression by 7.3 fold (P ≤ 0.05) within 24 hours of treatment (Figure 3A). To investigate a possible role of MSTN in the regulation of FFA-induced hepatokines and hepatic TG synthesis, we performed siRNA-mediated knockdown of MSTN in HepG2 followed by FFA induction to assess changes in hepatokine RNA levels. We routinely achieved knockdown efficiency of 75% (P ≤ 0.01) compared to control i.e. cells that were transfected with negative control oligonucleotides (Figure 3B). We found that MSTN knockdown reduced endogenous FetA expression by 2.9 fold (P ≤ 0.01), and 5.5 fold (P ≤ 0.01) in FFA-induced HepG2 cells (Figure 3C). In contrast, while endogenous LECT2 expression was also decreased by 2.3 fold (P ≤ 0.05) after MSTN knockdown, it was up-regulated following palmitate treatment (3.8 fold; P ≤ 0.01) suggesting that feedback mechanisms may influence LECT2 expression. In addition, in the absence of MSTN, GPAT1 expression was reduced by 1.7 fold (P ≤ 0.05) and SREBP-1c expression was decreased by 2 fold (P ≤ 0.05) in unstimulated controls and both remained close to control levels following FFA-induction (P ≤ 0.01), in the absence of MSTN However, MSTN would appear to regulate only specific elements of FFA-dependent gene expression as there was no change in the level of either control or FFA-induced ACC1 expression after MSTN knockdown (Figure 3C).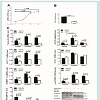
 MicroRNAs may play a role in the regulation of myostatin in the presence of palmitate
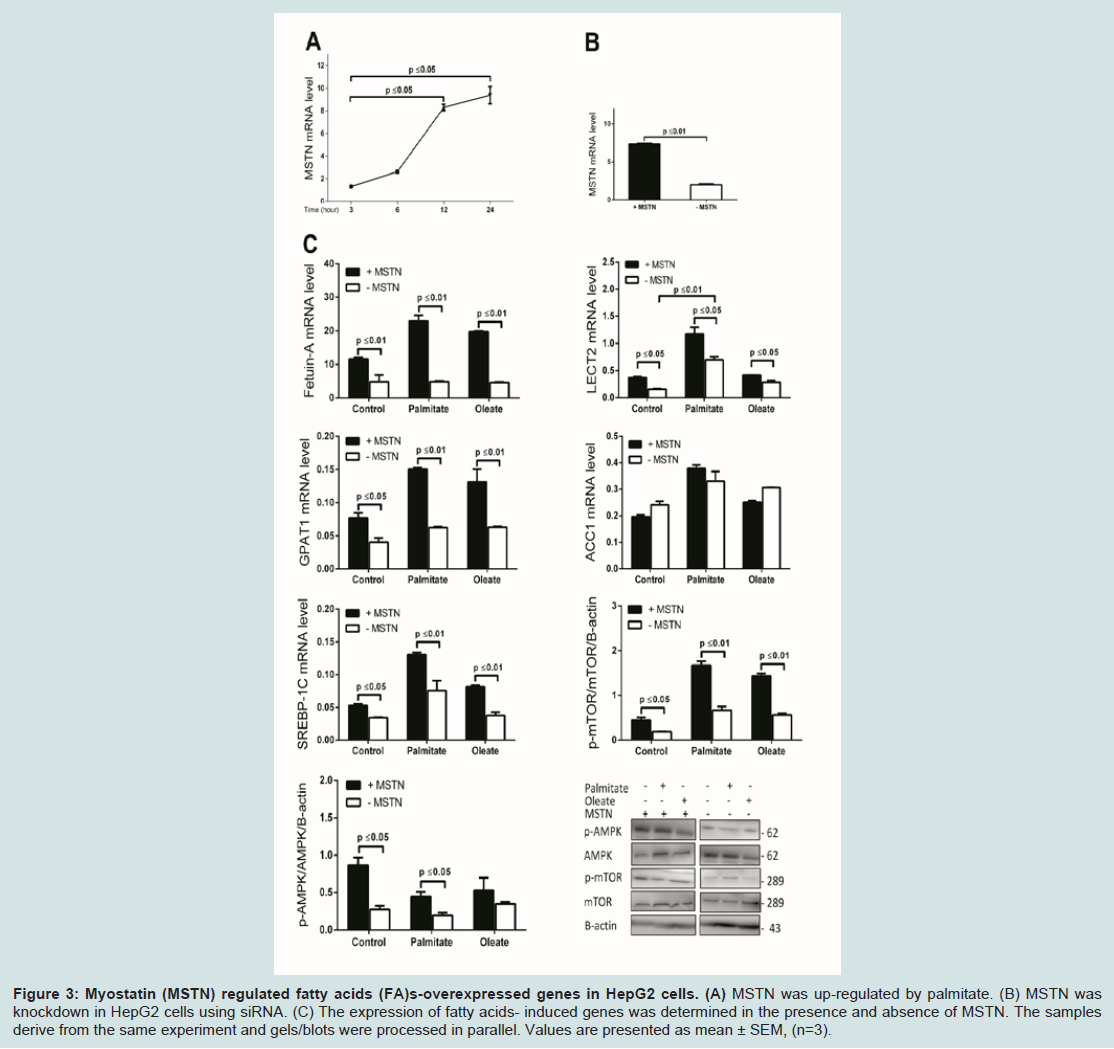
Figure 3: Myostatin (MSTN) regulated fatty acids (FA)s-overexpressed genes in HepG2 cells. (A) MSTN was up-regulated by palmitate. (B) MSTN was knockdown in HepG2 cells using siRNA. (C) The expression of fatty acids- induced genes was determined in the presence and absence of MSTN. The samples derive from the same experiment and gels/blots were processed in parallel. Values are presented as mean ± SEM, (n=3).
The strong correlation between circulating MSTN expression and obesity [21], and following weight loss [35] in humans, suggest it may have an important role in energy metabolism. In light of this, we investigated changes in the activity of the two main cellular energy sensors and regulators, AMP-activated protein kinase (AMPK) and mammalian target of rapamycin complex 1 (mTOR) under the conditions of our experiments. In control cells, following MSTN knockdown, phosphorylation of AMPK at Thr172 site (pAMPK) was reduced by 3.2 fold (P ≤ 0.05) and pAMPK remained relatively unchanged in FFA-treated compared to control cells (Figure 3C). We also found that MSTN knockdown significantly reduced the phosphorylation of mTOR at Ser2448 site (pmTOR) by 2.2 fold (P ≤ 0.05) in controls and similarly, by 2.6 fold (P ≤ 0.01) in FFA-induced HepG2 cells (Figure 3C).
Figure 4A). Whilst we found pAMPK level to remain relatively unchanged, pmTOR level increased by 1.9 fold (P ≤ 0.01), to maximal levels by 6 hours of palmitate treatment relative to the 3-hour treatment (Figure 4A). Likewise, FetA expression increased by 2.1 fold (P ≤ 0.05) by 6 hours, and 3 fold (P ≤ 0.05) by 12 hours of palmitate treatment compared to the 3-hour treatment (Figure 4A). The similar temporal expression patterns suggested that activation of mTOR might be necessary for palmitate-induction of FetA. We used a pharmacological approach to test these further, treating cells with the selective inhibitor rapamycin prior to palmitate induction. We assayed the effect of different doses of rapamycin (0, 5,10 and 25 nM) on mTOR phosphorylation and 10 nM of rapamycin for 12 hours was shown as efficient dose. We found only a mild 1.2 fold decrease (not statistically significant) in pmTOR level following a 3-hour treatment of 10 nM rapamycin. However, pmTOR level was decreased significantly and maximally by 1.5 fold (P ≤ 0.05) following 12 hours of 10 nM rapamycin treatment (Figure 4B). After first suppression of MSTN by siRNA, we found that palmitate-induced FetA expression was significantly and similarly decreased by 3 fold (P ≤ 0.01), irrespective of pharmacological inhibition of pmTOR (Figure 4C). Notably, MSTN inhibition did significantly reduce pmTOR (2 fold; P ≤ 0.05) (Figure 4C). Collectively, these findings suggest that the previously reported palmitate induced phosphorylation of mTOR [36] is MSTN dependent, but that the MSTN-mediated FFA induction of FetA expression does not require pmTOR, suggesting that it is occurring through a transcriptional mechanism.
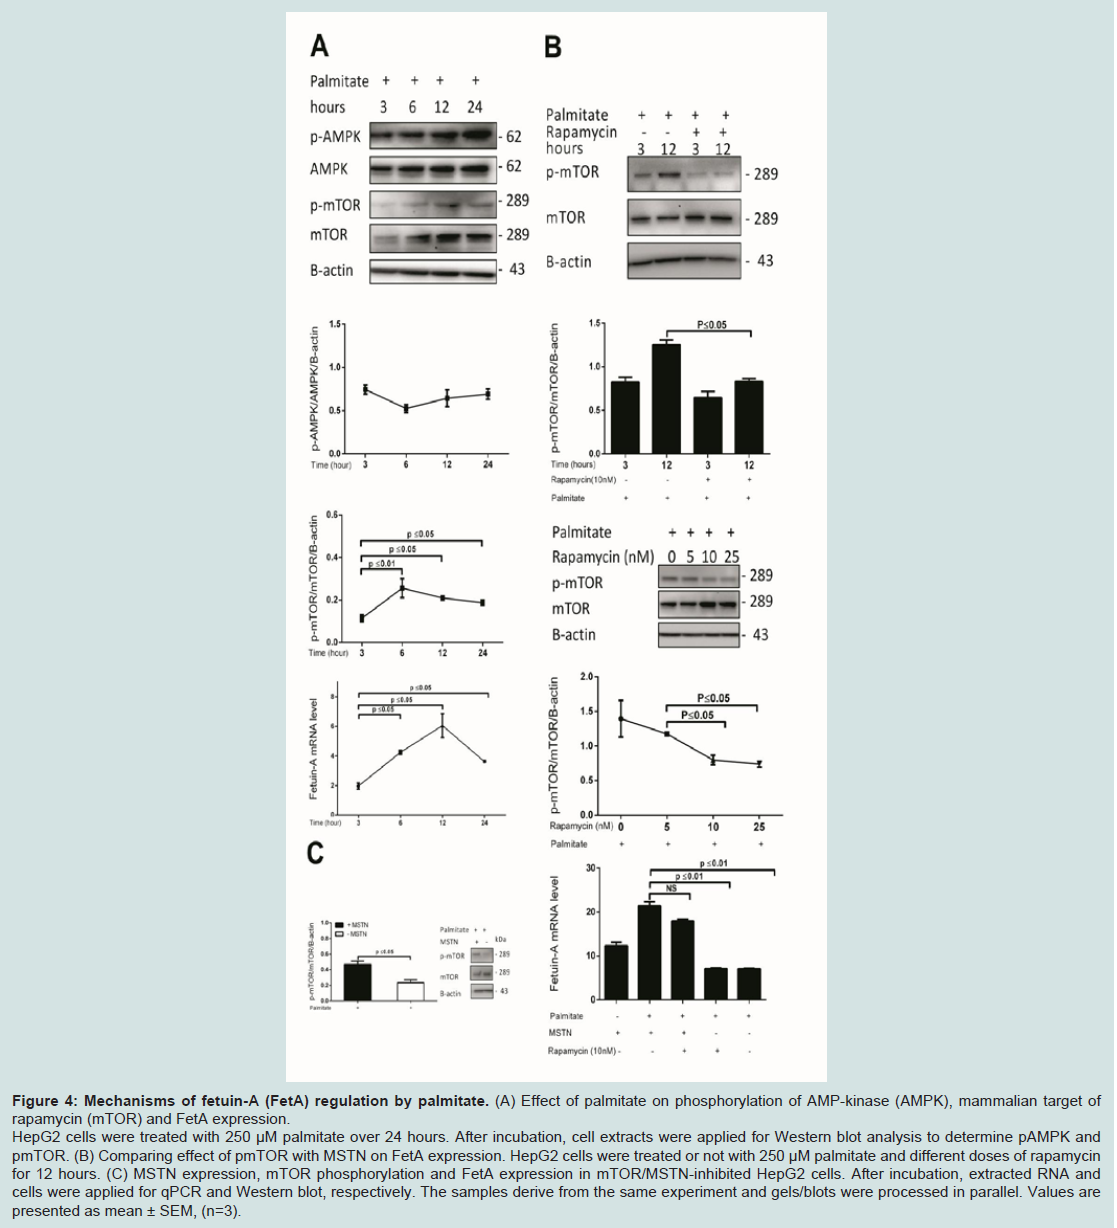
Figure 4: Mechanisms of fetuin-A (FetA) regulation by palmitate. (A) Effect of palmitate on phosphorylation of AMP-kinase (AMPK), mammalian target of rapamycin (mTOR) and FetA expression. HepG2 cells were treated with 250 μM palmitate over 24 hours. After incubation, cell extracts were applied for Western blot analysis to determine pAMPK and pmTOR. (B) Comparing effect of pmTOR with MSTN on FetA expression. HepG2 cells were treated or not with 250 μM palmitate and different doses of rapamycin for 12 hours. (C) MSTN expression, mTOR phosphorylation and FetA expression in mTOR/MSTN-inhibited HepG2 cells. After incubation, extracted RNA and cells were applied for qPCR and Western blot, respectively. The samples derive from the same experiment and gels/blots were processed in parallel. Values are presented as mean ± SEM, (n=3).
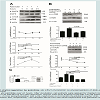
To determine the possible role of obesity-related miRNAs in regulating the hepatokines of interest, we first confirmed the expression of our 8 candidate plasma miRNAs after FFA exposure using our in vitro hepatic model. We found that expression of 4 miRNAs, miR-27b miR-29a, miR-192 and miR-335, was increased by 3 fold (P ≤ 0.05) after palmitate treatment relative to untreated cells,but was unchanged after oleate treatment (Figure 5A). In contrast, expression of miR-99a was reduced by 3 fold (P ≤ 0.05) after palmitate treatment relative to untreated cells, and a similar response was seen with oleate treatment albeit not significant (Figure 5A). MiR-4532 was increased by 1.7 fold (P ≤ 0.05) after palmitate stimulation only. No change in the expression of either miR-17 or miR-148b was observed in HepG2 cells supplemented with FFAs. Our finding that miR-27b, miR-29a, miR-192 and miR-335 were inducible with palmitate is consistent with our results of reduced circulating levels in the blood in post-operative GBP subjects.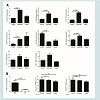 We then investigated the effect of the selected miRNAs suppression on MSTN and FetA expression in the presence of palmitate. Among these, miR-335 exhibited the best alignment with MSTN and FetA following its inhibition in the presence of palmitate. We found that with suppression of miR-335 in our in vitro model, palmitate was not able to stimulate either MSTN or FetA expression (Figure 5B). This data are parsimonious with the finding that miR-335 is over expressed in obese subjects before GBP surgery and suggests that this miRNA enables FetA regulation by FFAs, therefore this miRNA may provide a valuable biomarker in the context of obesity associated metabolic disease progression or remission.
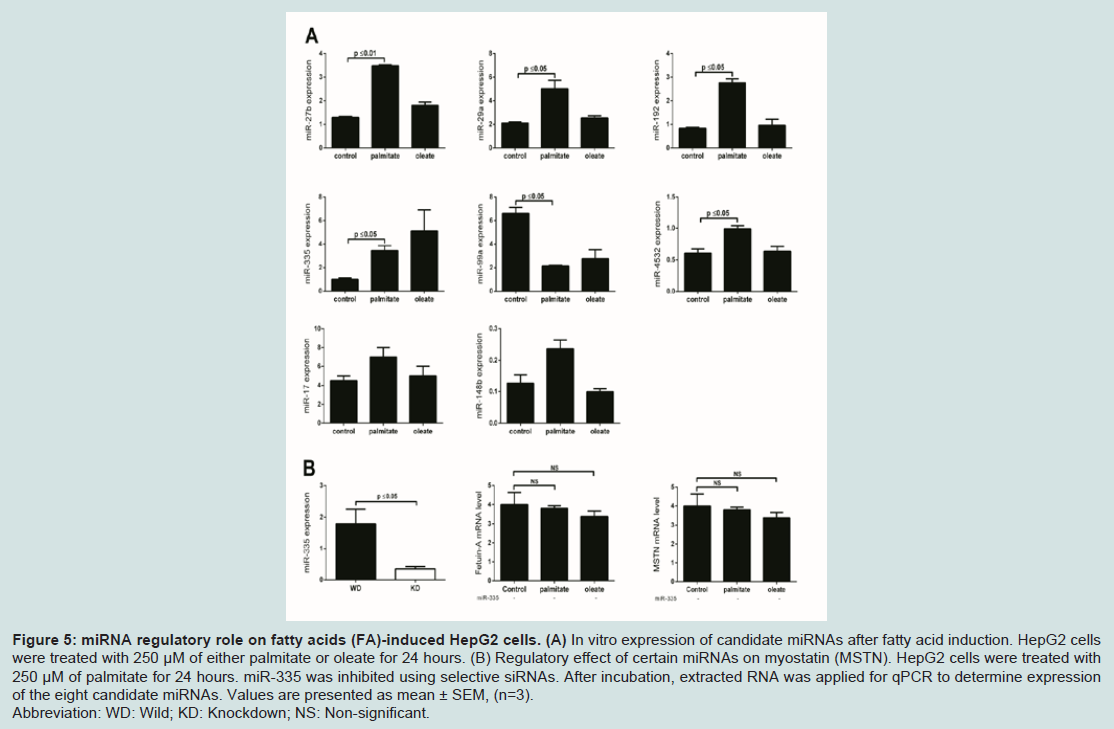
Figure 5: miRNA regulatory role on fatty acids (FA)-induced HepG2 cells. (A) In vitro expression of candidate miRNAs after fatty acid induction. HepG2 cells were treated with 250 μM of either palmitate or oleate for 24 hours. (B) Regulatory effect of certain miRNAs on myostatin (MSTN). HepG2 cells were treated with 250 μM of palmitate for 24 hours. miR-335 was inhibited using selective siRNAs. After incubation, extracted RNA was applied for qPCR to determine expression of the eight candidate miRNAs. Values are presented as mean ± SEM, (n=3). Abbreviation: WD: Wild; KD: Knockdown; NS: Non-significant.
BMI and HbA1c were correlated with microRNAs expression
BMI is used to measure obesity in a population, while HbA1c is the indicator of glycaemia which is an accepted diagnostic and monitoring tool for diabetes. Since both of these measures were significantly (P ≤ 0.05) decreased after both types of surgery (Table 2), we looked for possible correlation with miRNAs that overexpressed in both plasma and FFA-induced hepatocytes (Table 3). Interestingly, we found that only after GBP surgery, expression of the miRNAs miR-335, miR-27 and miR-29 was well correlated with BMI (P ≤ 0.05); all three of these were reduced with decreased BMI. Also post- GBP, both miR-29 and miR-192 were highly correlated with HbA1c concentration and expression of these miRNAs was also reduced (P ≤ 0.05) in parallel with the decrease in HbA1c after surgery. However, we found no correlation between either of these clinical measures and miRNAs expression, before or after SG surgery. Notably, in SG cases the pre-operative miRNA appears to have greater variance than the post-operative miRNA levels.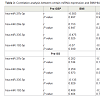 In contrast, a Kolmogorov-Smirnov statistical test showed that the frequency distribution of miRNA expression in the pre-GBP surgery cases was significantly (P ≤ 0.05) different to the frequency distribution post-GBP surgery. The frequency distributions we observed were clearly skewed and after a logarithmic transformation of the miRNA data, an analysis of variance of the miRNA levels pre and post-GBP showed that the mean miRNA level post-GBP was significantly (P ≤ 0.01) less than the pre-GBP miRNA levels, but the residuals were not significantly different from normal, as assessed by a Shapiro-Wilk test. In conclusion, the changes we have measured in miRNA expression levels are well correlated with the overall changes in BMI and HbA1c observed after GBP surgery, but not after SG surgery.
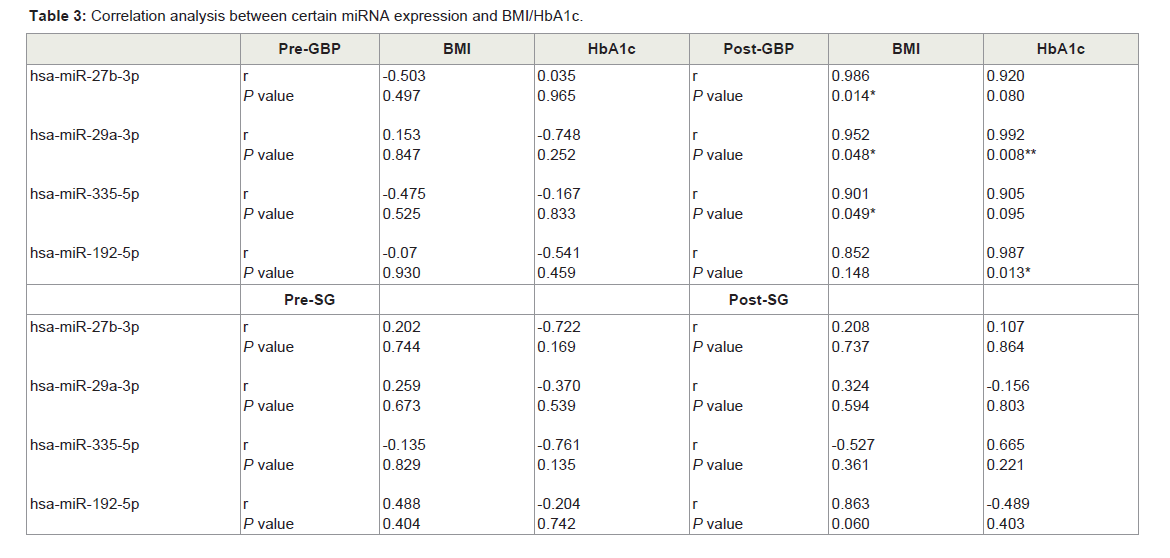
Table 3: Correlation analysis between certain miRNA expression and BMI/HbA1c.
Discussion
The post-operative success in maintaining remission of obesity and T2DM varies significantly depending upon the type of bariatric surgery, suggesting different metabolic shifts may occur with each surgical strategy. Currently it is difficult to accurately assess the likely efficacy of different approaches to bariatric surgery, given the present knowledge of these shifts. In this context, one metabolic feature which may be of particular relevance is the secretion of hepatokines, which affect glucose metabolism and promote obesity induction [14,15], and are reported to decrease significantly following GBP [13,37]. Pre-operative subjects with high serum levels of the hepatokine FetA have an increased risk of clinical outcomes such diabetes [38], stroke [39] and obesity related disorders such as NAFLD [40]. FetA is known to inhibit insulin-stimulated phosphorylation of the insulin receptor and the insulin substrate-1 protein, in both liver and skeletal muscles [17]. Further, it may serve as an adaptor protein for saturated FFAs enabling them to activate Toll-like receptor 4, leading to inflammatory signalling and IR [40]. Similarly, serum levels of LECT2 are also elevated in subjects with fatty liver and obesity [33], and again its secretion is believed to link obesity with IR in skeletal muscles [20]. Our findings confirm the stimulation of hepatic FetA and LECT2 expression by palmitate and oleate (Figure 2), the most abundant saturated and mono-unsaturated FAs respectively in human fat depots [41] and two of the plasma FFAs which decrease significantly following bariatric surgeries (Murphy et al. unpublished observations).Although long appreciated for its impact on whole body metabolism and in determination of muscle mass, MSTN has more recently been linked to glucose and lipid homeostasis. However, its precise function remains somewhat enigmatic. While a loss-offunction MSTN mutation enhances glucose tolerance and protection against IR in mice maintained on a HFD [42], the restoration of its function with recombinant protein in MSTN mutant mice fed a HFD, paradoxically led to greater IR [43]. Further, MSTN depletion with a ‘floxed’ MSTN gene construct caused hepatic steatosis and fat accumulation in muscles of HFD fed mice [44], yet inactivation of MSTN inhibitory genes leads to increasing MSTN activity, and greater hepatic steatosis and hypertension in mice [45]. We observed increased MSTN transcription in FFA-induced hepatocytes and suppression of MSTN by siRNA clearly mediated the effect of palmitate and oleate on both FetA and LECT2 (Figure 3).
AMPK is a central metabolic switch influenced by MSTN activity that regulates glucose and lipid metabolism in response to nutrients [42]. A decrease in the AMP: ATP ratio leads to AMP binding to the γ subunit and thus increased phosphorylation and activation of pAMPK, which in turn directly phosphorylates tuberous sclerosis complex 2 (TSC2) to promote the conversion of Rheb-GTP to Rheb- GDP. In this way, catabolic pathways are directed towards ATP generation [46]. A consequence of these shifts is the inhibition of phosphor-mTOR [47]. The functionally related serine/threonine protein kinase mTOR belongs to the phosphoinositide-3-kinaserelated kinase group and governs cellular homeostasis by synergizing anabolic and catabolic processes with nutrient and energy signalling [47]. pmTOR acts as a scaffold to recruit a complex of downstream substrates, including ribosomal S6 kinase beta 1 (p70S6K1), which regulate mRNA translation and whose activity is acutely inhibited by the drug rapamycin [48]. While FFAs such as plamitate have recently been shown to promote translation via recruiting mTOR onto the lysosomal surface [36,49], it has also been suggested that pAMPK activation can supress palmitate-induced hepatic FetA expression [47,50]. We found that while pmTOR and FetA were both induced by palmitate stimulation, pAMPK levels decreased and subsequently remained suppressed even as FetA continued to increase with time. Additional experiments with rapamycin confirmed that the palmitate induction of hepatic FetA is not a consequence of the FFA effect on translation, but rather is a result of MSTN activity acting to suppress AMPK function and to drive the process of transcription.
We have also shown that distinct miRNAs present in serum preoperatively in patients with morbid obesity and T2DM are associated with weight and glycemia achieved 1 year after GBP surgery. MiRNAs are known to regulate expression of genes at the post-transcriptional level, via either degradation of target mRNA or inhibitory translation [51,52], and are suggested as putatively valuable biomarkers given their tissue specific expression and association with clinic-pathologic variables [53]. The up-regulation of numerous miRNAs is associated with obesity in mice fed HFD [54] and hepatic lipid content in humans [55,56]. In this pilot study, we have observed differences in the expression of a particular set of circulating miRNAs following surgery, although these were only significant with GBP. To further validate the potential relevance of these changes, we correlated expression of these miRNA species with clinically recognized measures. Although obesity is associated with an increase in impaired glucose tolerance (revealed by IGTT), dyslipidemia and diabetes [57], fasting blood glucose measures are often not diagnostically accurate, as many subjects with abnormal glucose tolerance often record normal range IGTT values [58,59]. An increasingly used alternative for assessment of pre-diabetic and T2DM status is measurement of serum HbA1c, the levels of which seem to more accurately reflect longer term glucose control and appear to be less biologically variable [57]. Notably, expression of miR-29 showed a positive correlation with both BMI and HbA1c levels post-GBP, while miR-27 (for BMI), miR-335 (for BMI) and miR-192 (for HbA1c) were also strongly correlated after GBP surgery. Strikingly, we did not see any evidence of correlation between miRNA expression level and metabolic status either pre- or post-SG bariatric surgery. Moreover, we also found miR-335 to be a determinant of elevated MSTN and FetA expression ((Figure 5)), suggesting that the pathological secretion of hepatokines is regulated in significant measure through epigenetic mechanisms and the major regulatory role of liver, however we have no evidence of plasma miRNAs tissue of origin in this study. Consistent with this, the up-regulation of miR-335 has previously been linked with both increased hepatic TG content and adipose tissue lipid metabolism in genetically obese mice [27], and with human adipocyte differentiation [60]. Most importantly, we found that miR-335 expression is critical for the ability of FFAs to stimulate hepatokine FetA expression (and its upstream regulator MSTN) arguing for an important role in underpinning the pathogenic changes associated with disease progression in metabolic syndrome. In summary, we demonstrate a role for miR-335 in hepatokine FetA regulation (that was overexpressed through FFA induction in hepatocytes), which recent studies suggest is significantly reduced following GBP bariatric surgery in obese patients. Further, we suggest miR-335 activity may be a key to shifts in metabolic state, specifically affecting the MSTNdependent regulation of physiologically significant targets such as FetA. Finally, we present pilot data suggesting that a distinct set of miRNAs (including miR-335) are differentially expressed pre- and post-GBP surgery in serum of patients presenting with morbid obesity and T2DM, and are strongly correlated with BMI and HbA1c levels in these subjects.
Acknowledgements
AZ is supported by a Univ. of Auckland Doctoral Scholarship and the Liggins institute Doctoral Scholarship Fund. The funders played no role in the conception or design of this study, data collection and analysis, decision to publish, or preparation of this manuscript. There are no potential conflicts of interest relevant to this articleReferences
- World Health Organization (2008) Obesity and overweight, Fact sheet N°311.
- Neff KJ, Olbers T, le Roux CW (2013) Bariatric surgery: the challenges with candidate selection, individualizing treatment and clinical outcomes. BMC Med 11: 8.
- Reoch J, Mottillo S, Shimony A, Filion KB, Christou NV, et al. (2011) Safety of laparoscopic vs open bariatric surgery: a systematic review and meta-analysis. Arch Surg 146: 1314-1322.
- Smith BR, Schauer P, Nguyen NT (2008) Surgical approaches to the treatment of obesity: bariatric surgery. Endocrinol Metab Clin North Am 37: 943-964.
- Lee WJ, Chong K, Ser KH, Lee YC, Chen SC, et al. (2011) Gastric bypass vs sleeve gastrectomy for type 2 diabetes mellitus: a randomized controlled trial. Arch Surg 146: 143-148.
- Schauer PR, Kashyap SR, Wolski K, Brethauer SA, Kirwan JP, et al. (2012) Bariatric surgery versus intensive medical therapy in obese patients with diabetes. N Engl J Med 366: 1567-1576.
- Ogden J, Avenell S, Ellis G (2011) Negotiating control: patients’ experiences of unsuccessful weight-loss surgery. Psychol Health 26: 949-964.
- Saltzman E, Anderson W, Apovian CM, Boulton H, Chamberlain A, et al. (2005) Criteria for patient selection and multidisciplinary evaluation and treatment of the weight loss surgery patient. Obes Res 13: 234-243.
- Kehagias I, Karamanakos SN, Argentou M, Kalfarentzos F (2011) Randomized clinical trial of laparoscopic Roux-en-Y gastric bypass versus laparoscopic sleeve gastrectomy for the management of patients with BMI< 50 kg/m2. Obes Surg 21: 1650-1656.
- Himpens J, Dobbeleir J, Peeters G (2010) Long-term results of laparoscopic sleeve gastrectomy for obesity. Ann Surg 252: 319-324.
- Hayes MT, Hunt LA, Foo J, Tychinskaya Y, Stubbs RS (2011) A model for predicting the resolution of type 2 diabetes in severely obese subjects following Roux-en Y gastric bypass surgery. Obes Surg 21: 910-916.
- Lee WJ, Chong K, Ser KH, Chen JC, Lee YC, et al. (2012) C-peptide predicts the remission of type 2 diabetes after bariatric surgery. Obes Surg 22: 293-298.
- Jüllig M, Yip S, Xu A, Smith G, Middleditch M, et al. (2014) Lower fetuin-A, retinol binding protein 4 and several metabolites after gastric bypass compared to sleeve gastrectomy in patients with type 2 diabetes. PloS One 9: e96489.
- Stefan N, Häring HU (2013) The role of hepatokines in metabolism. Nat Rev Endocrinol 9: 144-152.
- Stefan N, Häring HU (2011) The metabolically benign and malignant fatty liver. Diabetes 60: 2011-2017.
- Denecke B, Graber S, Schafer C, Heiss A, Woltje M, et al. (2003) Tissue distribution and activity testing suggest a similar but not identical function of fetuin-B and fetuin-A. Biochem J 376(Pt 1): 135-145.
- Auberger P, Falquerho L, Contreres JO, Pages G, Le Cam G, et al. (1989) Characterization of a natural inhibitor of the insulin receptor tyrosine kinase: cDNA cloning, purification, and anti-mitogenic activity. Cell 58: 631-640.
- Stefan N, Hennige AM, Staiger H, Machann J, Schick F, et al. (2006) Alpha2-Heremans-Schmid glycoprotein/fetuin-A is associated with insulin resistance and fat accumulation in the liver in humans. Diabetes Care 29: 853-857.
- Haukeland JW, Dahl TB, Yndestad A, Gladhaug IP, Løberg EM, et al. (2012) Fetuin A in nonalcoholic fatty liver disease: in vivo and in vitro studies. Eur J Endocrinol 166: 503-510.
- Lan F, Misu H, Chikamoto K, Takayama H, Kikuchi A, et al. (2014) LECT2 functions as a hepatokine that links obesity to skeletal muscle insulin resistance. Diabetes 63: 1649-1664.
- Hittel DS, Berggren JR, Shearer J, Boyle K, Houmard JA (2009) Increased secretion and expression of myostatin in skeletal muscle from extremely obese women. Diabetes 58: 30-38.
- Chen Y, Cao L, Ye J, Zhu D (2009) Upregulation of myostatin gene expression in streptozotocin-induced type 1 diabetes mice is attenuated by insulin. Biochem Biophys Res Commun 388: 112-116.
- Zhao B, Wall RJ, Yang J (2005) Transgenic expression of myostatin propeptide prevents diet-induced obesity and insulin resistance. Biochem Biophys Res Commun 337: 248-255.
- Karbiener M, Fischer C, Nowitsch S, Opriessnig P, Papak C, et al. (2009) microRNA miR-27b impairs human adipocyte differentiation and targets PPARgamma. Biochem Biophys Res Commun 390: 247-251.
- He A, Zhu L, Gupta N, Chang Y, Fang F (2007) Overexpression of micro ribonucleic acid 29, highly up-regulated in diabetic rats, leads to insulin resistance in 3T3-L1 adipocytes. Mol Endocrinol 21: 2785-2794.
- Klöting N, Berthold S, Kovacs P, Schön MR, Fasshauer M, et al. (2009) MicroRNA expression in human omental and subcutaneous adipose tissue. PloS One 4: e4699.
- Nakanishi N, Nakagawa Y, Tokushige N, Aoki N, Matsuzaka T, et al. (2009) The up-regulation of microRNA-335 is associated with lipid metabolism in liver and white adipose tissue of genetically obese mice. Biochem Biophys Res Commun 385: 492-496.
- Hennessy E, Clynes M, Jeppesen PB, O’Driscoll L (2010) Identification of microRNAs with a role in glucose stimulated insulin secretion by expression profiling of MIN6 cells. Biochem Biophys Res Commun 396: 457-462.
- Xie H, Lim B, Lodish HF (2009) MicroRNAs induced during adipogenesis that accelerate fat cell development are downregulated in obesity. Diabetes 58: 1050-1057.
- Gavrilova O, Haluzik M, Matsusue K, Cutson JJ, Johnson L, et al. (2003) Liver peroxisome proliferator-activated receptor gamma contributes to hepatic steatosis, triglyceride clearance, and regulation of body fat mass. J Biol Chem 278: 34268-34276.
- Nagle CA, Klett EL, Coleman RA (2009) Hepatic triacylglycerol accumulation and insulin resistance. J Lipid Res 50 Suppl: S74-S79.
- Sekiya M, Hiraishi A, Touyama M, Sakamoto K (2008) Oxidative stress induced lipid accumulation via SREBP1c activation in HepG2 cells. Biochem Biophys Res Commun 375: 602-607.
- Okumura A, Unoki-Kubota H, Matsushita Y, Shiga T, Moriyoshi Y, et al. (2013) Increased serum leukocyte cell-derived chemotaxin 2 (LECT2) levels in obesity and fatty liver. Biosci Trends 7: 276-283.
- Zhang C, McFarlane C, Lokireddy S, Masuda S, Ge X, et al. (2012) Inhibition of myostatin protects against diet-induced obesity by enhancing fatty acid oxidation and promoting a brown adipose phenotype in mice. Diabetologia 55: 183-193.
- Milan G, Dalla Nora E, Pilon C, Pagano C, Granzotto M, et al. (2004) Changes in muscle myostatin expression in obese subjects after weight loss. J Clin Endocrinol Metab 89: 2724-2727.
- Hatanaka M, Maier B, Sims EK, Templin AT, Kulkarni RN, et al. (2014) Palmitate induces mRNA translation and increases ER protein load in islet β-cells via activation of the mammalian target of rapamycin pathway. Diabetes 63: 3404-3415.
- Brix JM, Stingl H, Höllerl F, Schernthaner GH, Kopp HP, et al. (2010) Elevated Fetuin-A concentrations in morbid obesity decrease after dramatic weight loss. J Clin Endocrinol Metab 95: 4877-4881.
- Stefan N, Fritsche A, Weikert C, Boeing H, Joost HG, et al. (2008) Plasma fetuin-A levels and the risk of type 2 diabetes. Diabetes 57: 2762-2767.
- Tuttolomondo A, Di Raimondo D, Di Sciacca R, Casuccio A, Bivona G, et al. (2010) Fetuin-A and CD40 L plasma levels in acute ischemic stroke: differences in relation to TOAST subtype and correlation with clinical and laboratory variables. Atherosclerosis 208: 290-296.
- Trepanowski JF, Mey J, Varady KA (2014) Fetuin-A: a novel link between obesity and related complications. Int J Obes (Lond) 39: 734-741.
- Kingsbury KJ, Paul S, Crossley A, Morgan DM (1961) The fatty acid composition of human depot fat. Biochem J 78: 541-550.
- Allen DL, Hittel DS, McPherron AC (2011) Expression and function of myostatin in obesity, diabetes, and exercise adaptation. Med Sci Sports Exerc 43: 1828-1835.
- Wilkes JJ, Lloyd DJ, Gekakis N (2009) Loss-of-function mutation in myostatin reduces tumor necrosis factor alpha production and protects liver against obesity-induced insulin resistance. Diabetes 58: 1133-1143.
- Burgess K, Xu T, Brown R, Han B, Welle S (2011) Effect of myostatin depletion on weight gain, hyperglycemia, and hepatic steatosis during five months of high-fat feeding in mice. PLoS One 6: e17090.
- Mukherjee A, Sidis Y, Mahan A, Raher MJ, Xia Y, et al. (2007) FSTL3 deletion reveals roles for TGF-beta family ligands in glucose and fat homeostasis in adults. Proc Natl Acad Sci U S A 104: 1348-1353.
- Hardie DG (2005) New roles for the LKB1→ AMPK pathway. Curr Opin Cell Biol 17: 167-173.
- Sengupta S, Peterson TR, Sabatini DM (2010) Regulation of the mTOR complex 1 pathway by nutrients, growth factors, and stress. Mol Cell 40: 310-322.
- Kambadur R, Sharma M, Smith TP, Bass JJ (1997) Mutations in myostatin (GDF8) in double-muscled Belgian Blue and Piedmontese cattle. Genome Res 7: 910-916.
- Yasuda M, Tanaka Y, Kume S, Morita Y, Chin-Kanasaki M, et al. (2014) Fatty acids are novel nutrient factors to regulate mTORC1 lysosomal localization and apoptosis in podocytes. Biochim Biophys Acta 1842: 1097-1108.
- Jung TW, Youn BS, Choi HY, Lee SY, Hong HC, et al. (2013) Salsalate and adiponectin ameliorate hepatic steatosis by inhibition of the hepatokine fetuin-A. Biochem Pharmacol 86: 960-969.
- Ying SY, Chang DC, Miller JD, Lin SL (2006) The microRNA: overview of the RNA gene that modulates gene functions. Methods Mol Biol 342: 1-18.
- Tanzer A, Stadler PF (2006) Evolution of microRNAs. Methods Mol Biol 342: 335-350.
- Heneghan HM, Miller N, Kerin MJ (2010) Role of microRNAs in obesity and the metabolic syndrome. Obes Rev 11: 354-361.
- Takanabe R, Ono K, Abe Y, Takaya T, Horie T, et al. (2008) Up-regulated expression of microRNA-143 in association with obesity in adipose tissue of mice fed high-fat diet. Biochem Biophys Res Commun 376: 728-732.
- Whittaker R, Loy PA, Sisman E, Suyama E, Aza-Blanc P, et al. (2010) Identification of MicroRNAs that control lipid droplet formation and growth in hepatocytes via high-content screening. J Biomol Screen 15: 798-805.
- Rottiers V, Näär AM (2012) MicroRNAs in metabolism and metabolic disorders. Nat Rev Mol Cell Biol 13: 239-250.
- Lee HS, Park HK, Hwang JS (2012) HbA1c and glucose intolerance in obese children and adolescents. Diabet Med 29: e102-e105.
- http://www.ncbi.nlm.nih.gov/pubmed/21185103.
- Wiegand S, Maikowski U, Blankenstein O, Biebermann H, Tarnow P, et al. (2004) Type 2 diabetes and impaired glucose tolerance in European children and adolescents with obesity--a problem that is no longer restricted to minority groups. Eur J Endocrinol 151: 199-206.
- Zhu L, Chen L, Shi CM, Xu GF, Xu LL, et al. (2014) MiR-335, an adipogenesis-related microRNA, is involved in adipose tissue inflammation. Cell Biochem Biophys 68: 283-290.