
Journal of Neurology and Psychology
Download PDF
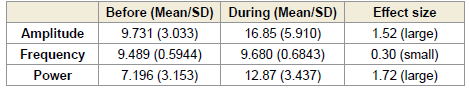 Table 1:Descriptive statistics of electrode O1- Before vs During
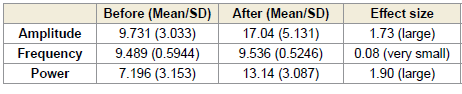 Table 2:Descriptive statistics of electrode O1- Before vs After
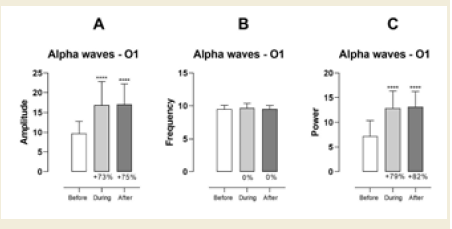 Figure 1: EEG assessment of alpha waves before, during, and after a
20-minute brainwave stimulation session in the O1 region. The data was
analyzed by One-way ANOVA or Kruskal-Wallis test when appropriate. The
value for significant statistical difference was set at <0.05. * Represents the
significant statistical difference from baseline.
Figure 1: EEG assessment of alpha waves before, during, and after a
20-minute brainwave stimulation session in the O1 region. The data was
analyzed by One-way ANOVA or Kruskal-Wallis test when appropriate. The
value for significant statistical difference was set at <0.05. * Represents the
significant statistical difference from baseline.
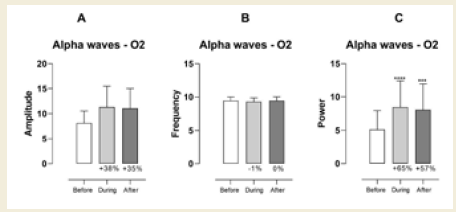 Figure 2: EEG assessment of alpha waves before, during, and after a
20-minute brainwave stimulation session in the O2 region. The data was
analyzed by One-way ANOVA or Kruskal-Wallis test when appropriate. The
value for significant statistical difference was set at <0.05. * Represents the
significant statistical difference from baseline
Figure 2: EEG assessment of alpha waves before, during, and after a
20-minute brainwave stimulation session in the O2 region. The data was
analyzed by One-way ANOVA or Kruskal-Wallis test when appropriate. The
value for significant statistical difference was set at <0.05. * Represents the
significant statistical difference from baseline
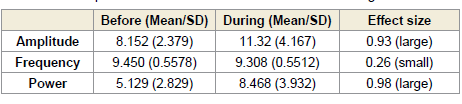 Table 3:Descriptive statistics of electrode O2 - Before vs During
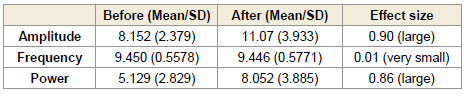 Table 4:Descriptive statistics of electrode O2- Before vs After
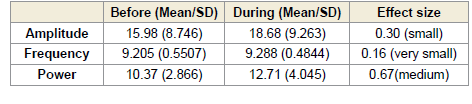 Table 5:Descriptive statistics of electrodes F3-C3 - Before vs During
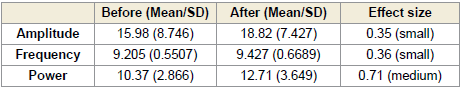 Table 6:Descriptive statistics of electrodes F3-C3 - Before vs After
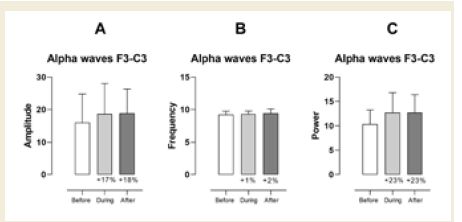 Figure 3:EEG assessment of alpha waves before, during, and after a
20-minute brainwave stimulation session in the F3-C3 region. Data were
analyzed using one-way ANOVA or the Kruskal-Wallis test, when appropriate.
Figure 3:EEG assessment of alpha waves before, during, and after a
20-minute brainwave stimulation session in the F3-C3 region. Data were
analyzed using one-way ANOVA or the Kruskal-Wallis test, when appropriate.
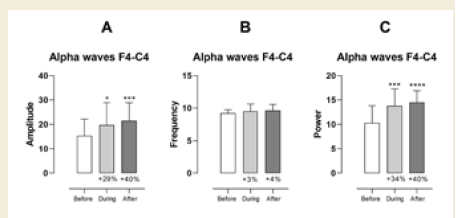 Figure 4:EEG assessment of alpha waves before, during, and after a
20-minute brainwave stimulation session in the F4-C4 region. The data was
analyzed by One-way ANOVA or Kruskal-Wallis test when appropriate. The
value for significant statistical difference was set at <0.05. * Represents the
significant statistical difference from baseline.
Figure 4:EEG assessment of alpha waves before, during, and after a
20-minute brainwave stimulation session in the F4-C4 region. The data was
analyzed by One-way ANOVA or Kruskal-Wallis test when appropriate. The
value for significant statistical difference was set at <0.05. * Represents the
significant statistical difference from baseline.
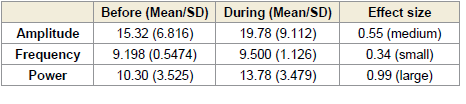 Table 7:Descriptive statistics of electrodes F4-C4 - Before vs During
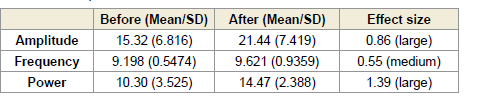 Table 8:Descriptive statistics of electrodes F4-C4 - Before vs After
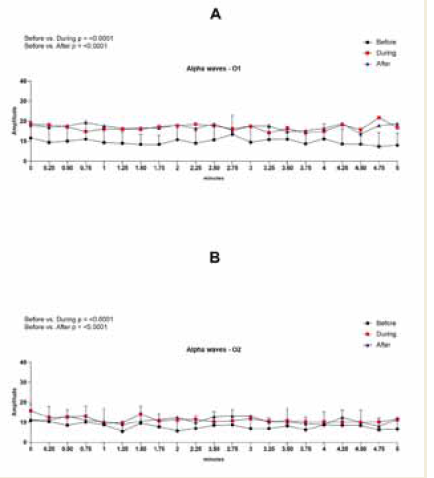 Figure 5:EEG assessment of alpha wave amplitude during the 0.25 to
5-minute interval of a 20-minute brainwave stimulation session in the O1
region in graph A and in the O2 region in graph B. To analyze the data a Twoway
ANOVA test was performed followed by Tuckey’s multiple comparison
test. The value for significant statistical difference was set at <0.05.
Figure 5:EEG assessment of alpha wave amplitude during the 0.25 to
5-minute interval of a 20-minute brainwave stimulation session in the O1
region in graph A and in the O2 region in graph B. To analyze the data a Twoway
ANOVA test was performed followed by Tuckey’s multiple comparison
test. The value for significant statistical difference was set at <0.05.
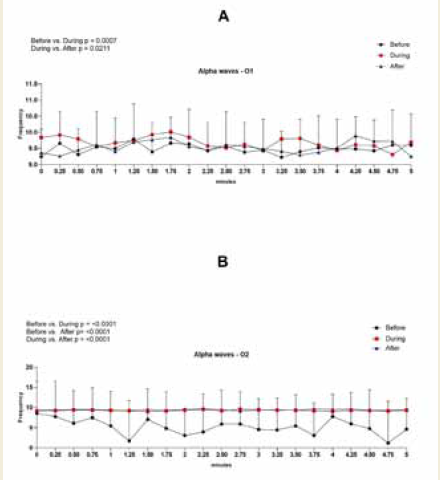 Figure 6:EEG assessment of alpha wave frequency during the 0.25 to
5-minute interval of a 20-minute brainwave stimulation session in the O1
region in graph A and in the O2 region in graph B. To analyze the data a Twoway
ANOVA test was performed followed by Tuckey’s multiple comparison
test. The value for significant statistical difference was set at <0.05.
Figure 6:EEG assessment of alpha wave frequency during the 0.25 to
5-minute interval of a 20-minute brainwave stimulation session in the O1
region in graph A and in the O2 region in graph B. To analyze the data a Twoway
ANOVA test was performed followed by Tuckey’s multiple comparison
test. The value for significant statistical difference was set at <0.05.
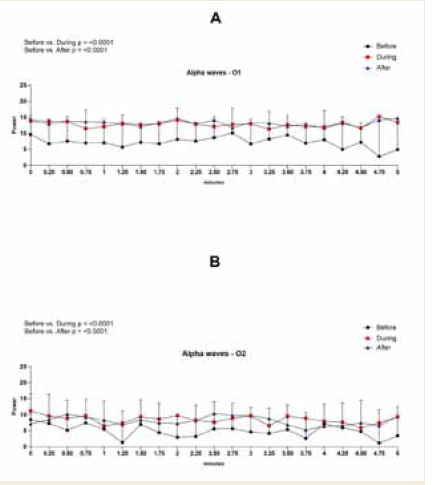 Figure 7: EEG assessment of alpha wave power during the 0.25 to 5-minute
interval of a 20-minute brainwave stimulation session in the O1 region in
graph A and in the O2 region in graph B. To analyze the data a Two-way
ANOVA test was performed followed by Tuckey’s multiple comparison test.
The value for significant statistical difference was set at <0.05.
Figure 7: EEG assessment of alpha wave power during the 0.25 to 5-minute
interval of a 20-minute brainwave stimulation session in the O1 region in
graph A and in the O2 region in graph B. To analyze the data a Two-way
ANOVA test was performed followed by Tuckey’s multiple comparison test.
The value for significant statistical difference was set at <0.05.
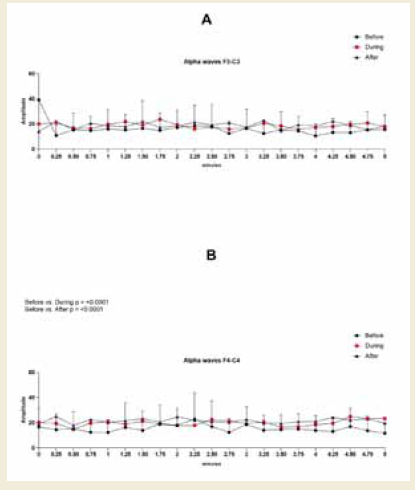 Figure 8:EEG assessment of alpha wave amplitude during the 0.25 to 5-minute
interval of a 20-minute brainwave stimulation session in the F3-C3 region in
graph A and in the F4-C4 region in graph B. To analyze the data a Two-way
ANOVA test was performed followed by Tuckey’s multiple comparison test.
The value for significant statistical difference was set at <0.05.
Figure 8:EEG assessment of alpha wave amplitude during the 0.25 to 5-minute
interval of a 20-minute brainwave stimulation session in the F3-C3 region in
graph A and in the F4-C4 region in graph B. To analyze the data a Two-way
ANOVA test was performed followed by Tuckey’s multiple comparison test.
The value for significant statistical difference was set at <0.05.
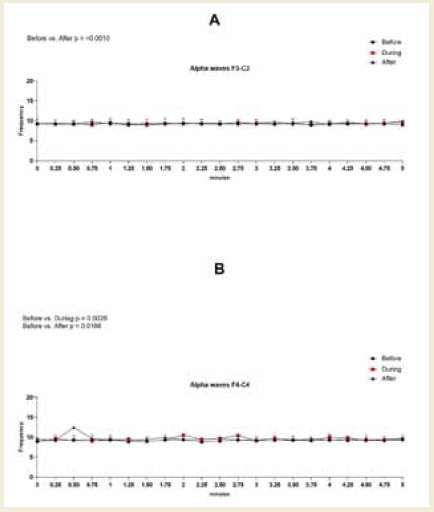 Figure 9:EEG assessment of alpha wave amplitude during the 0.25 to 5-minute
interval of a 20-minute brainwave stimulation session in the F3-C3 region in
graph A and in the F4-C4 region in graph B. To analyze the data a Two-way
ANOVA test was performed followed by Tuckey’s multiple comparison test.
The value for significant statistical difference was set at <0.05.
Figure 9:EEG assessment of alpha wave amplitude during the 0.25 to 5-minute
interval of a 20-minute brainwave stimulation session in the F3-C3 region in
graph A and in the F4-C4 region in graph B. To analyze the data a Two-way
ANOVA test was performed followed by Tuckey’s multiple comparison test.
The value for significant statistical difference was set at <0.05.
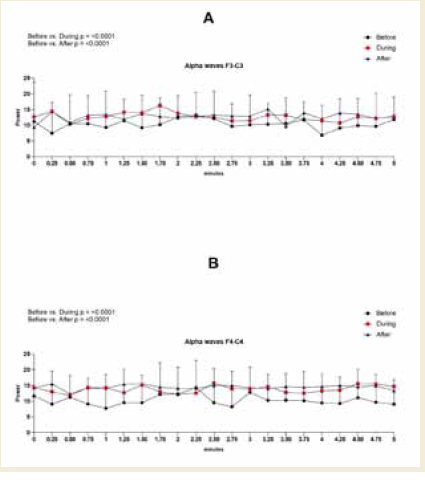 Figure 10:EEG assessment of alpha wave amplitude during the 0.25 to
5-minute interval of a 20-minute brainwave stimulation session in the F3-
C3 region in graph A and in the F4-C4 region in graph B. To analyze the
data a Two-way ANOVA test was performed followed by Tuckey’s multiple
comparison test. The value for significant statistical difference was set at <0.05.
Figure 10:EEG assessment of alpha wave amplitude during the 0.25 to
5-minute interval of a 20-minute brainwave stimulation session in the F3-
C3 region in graph A and in the F4-C4 region in graph B. To analyze the
data a Two-way ANOVA test was performed followed by Tuckey’s multiple
comparison test. The value for significant statistical difference was set at <0.05.
• Real-time EEG monitoring in 30 healthy adults revealed significant increases in alpha amplitude and power, particularly in the occipital and right frontal regions.
• These findings suggest that aBWE may be an effective noninvasive method to enhance relaxation and mental clarity by increasing alpha brainwave activity. Further studies are encouraged to explore its long-term benefits and applications.
• Exploratory analyses showed that individuals with lower baseline alpha levels experienced greater increases, suggesting that baseline alpha may predict response to aBWE.
Research Article
Impact of Audiovisual Brainwave Entrainment on Alpha Wave Activity: A Real-Time EEG Assessment
Cidral-Filho FJ1,2,3, Prasad OP4* and Donatello NN1,2
1Laboratory of Experimental Neurosciences, University of South
Santa Catarina (UNISUL), Palhoça, Santa Catarina - Brazil
2Integrative Wellbeing Institute (IWI), Windermere, Florida - United States of America
3Research Laboratory of Posturology and Neuromodulation (RELPON), Department of Human Neuroscience, Sapienza University, Rome - Italy
4Sri Sri Neuro Centre, Warangal, Telangana - India
2Integrative Wellbeing Institute (IWI), Windermere, Florida - United States of America
3Research Laboratory of Posturology and Neuromodulation (RELPON), Department of Human Neuroscience, Sapienza University, Rome - Italy
4Sri Sri Neuro Centre, Warangal, Telangana - India
*Address for Correspondence:Prasad OP, Sri Sri Neuro Centre, Warangal, Telangana–India, E-mail Id:
dromprakash9876@gmail.com
Submission: July 11, 2025
Accepted: September 15, 2025
Published: September 19, 2025
Copyright: © 2025 Cidral-Filho FJ, et al. This is an open access article
distributed under the Creative Commons Attribution License, which
permits unrestricted use, distribution, and reproduction in any medium,
provided the original work is properly cited.
Abstract
Objective: In this study, we aimed to investigate the impact of
a 20-minute audiovisual brainwave entrainment session on alpha
brainwave activity using continuous real-time electroencephalogram
(EEG) monitoring.
Methods: The study was conducted at the Electrophysiology Laboratory of Sri Sri Neuro Centre in Warangal, Telangana. The research included 30 healthy participants aged 18 to 65 (male and female), with no neurological or psychiatric conditions. The BrainTap headset was used for audiovisual brain entrainment targeting alpha waves, and wave activity was measured before, during, and after the session. The EEG electrodes were placed in the left side of the occipital region (O1), in the right occipital region (O2), in the left frontal lobe (F3-C3) and in the right frontal lobe (F4-C4) for readings of brainwaves’ amplitude, frequency and power.
Results: Significant increases in alpha amplitude and power were observed during and after the session, particularly in the left (O1) and right (O2) occipital regions, with large effect sizes (all p < 0.0005). In the right frontal region (F4–C4), alpha activity also increased significantly, with medium to large effect sizes. Although changes in the left frontal region (F3–C3) were not statistically significant, moderate increases in amplitude, frequency, and power were noted. Exploratory analyses indicated that individuals with lower baseline alpha values showed greater increases, suggesting baseline activity may predict response to the intervention.
Conclusions: This study demonstrates that a 20-minute session of audiovisual brainwave entrainment significantly increases alpha brainwave activity, particularly in individuals with low baseline levels. These findings support the potential of this non-invasive technique to enhance alpha activity and inform future applications for relaxation, mental clarity, and cognitive support. Further research is needed to explore its long-term benefits and applications.
Introduction
Alpha brainwaves, typically ranging from 8 to 12 Hz, represent
the dominant neural oscillation in healthy, awake individuals during
relaxed, eyes-closed states. They are most prominently observed in
the parieto-occipital cortex, including areas associated with visual
processing, and are believed to originate from thalamocortical
circuitry. Alpha activity has been implicated in a range of cognitive
functions such as internal visual attention, perception, memory
retention, and conscious awareness (De Koninck et al., 2023) [1].
Importantly, alpha oscillations are thought to exert an inhibitory
control over cortical excitability, helping regulate information
flow and sensory processing (Jensen and Mazaheri, 2010) [2]. This
modulatory role makes alpha a compelling target for external brain
stimulation approaches, including techniques like audiovisual
brainwave entrainment. Recent findings with transcranial alternating
current stimulation (tACS) in the alpha range have shown that
enhancing alpha activity can yield lasting neurophysiological and
behavioral effects, with potential relevance for clinical conditions
involving cognitive deficits, consciousness disorders, and chronic
pain (De Koninck et al., 2023) [1].
Audiovisual brainwave entrainment (aBWE) is a non-invasive
technique that employs rhythmic light and sound stimuli to
synchronize brainwave frequencies with external cues. By targeting
specific frequencies, such as the alpha range, aBWE aims to promote
desired mental states. Studies have demonstrated that aBWE can
effectively influence alpha wave activity, leading to benefits like
enhanced relaxation and influence of cognitive aspects (Cidral-Filho
et al., 2025) [3].
While the use of aBWE devices like the BrainTap headset
continues to grow, studies employing EEG to objectively measure
their neurophysiological impact are still relatively limited. This study
seeks to bridge that gap by investigating the impact of a 20-minute
aBWE session on alpha brainwave activity using real-time EEG
monitoring. By focusing on healthy adults without neurological or
psychiatric conditions, the research aims to provide insights into the
potential of aBWE as a tool for enhancing mental well-being and
cognitive performance.
Methods
This study was conducted at the Electrophysiology Laboratory of
Sri Sri Neuro Centre, located in Warangal, Telangana, India. A total
of 30 healthy adults, both male and female, aged between 18 and 65
years, were enrolled. Participants were screened to ensure they had
no history of neurological or psychiatric disorders. Informed consent
was obtained from all individuals prior to participation.
Each participant underwent a single 20-minute session of audiovisual brainwave entrainment (aBWE) using the BrainTap® headset. The device delivers synchronized light and sound stimulation designed to promote alpha brainwave activity within the frequency range of 8 to 13 Hz. Electroencephalogram (EEG) recordings were performed to evaluate brainwave changes before, during, and after the session. The EEG recording for the “during” phase began two minutes after the start of the session to allow the stimulation to stabilize.
Each participant underwent a single 20-minute session of audiovisual brainwave entrainment (aBWE) using the BrainTap® headset. The device delivers synchronized light and sound stimulation designed to promote alpha brainwave activity within the frequency range of 8 to 13 Hz. Electroencephalogram (EEG) recordings were performed to evaluate brainwave changes before, during, and after the session. The EEG recording for the “during” phase began two minutes after the start of the session to allow the stimulation to stabilize.
EEG data were acquired using a Nihon Kohden EEG machine,
a clinically validated system for neurophysiological monitoring.
Electrodes were positioned according to the international 10–20
system at four key locations: the left occipital region (O1), the right
occipital region (O2), the left frontal region (F3–C3), and the right
frontal region (F4–C4). These placements allowed for the monitoring
of alpha wave activity in both posterior and frontal cortical regions.
The EEG analysis focused on three key parameters: amplitude,
which reflects the height of the brainwave signal in microvolts (μV);
frequency, which measures the number of cycles per second in Hertz
(Hz); and power, which represents the overall energy of the signal,
measured in microvolts squared (μV²) or decibels (dB).
The EEG signals were preprocessed to ensure data quality.
Artifacts were removed, and a notch filter was applied to eliminate
electrical interference. Power spectral analysis and Density Spectral
Array (DSA) techniques were used to evaluate brainwave activity
within the 8 to 13 Hz alpha frequency band. These methods enabled
real-time assessment of dynamic changes during the intervention.
Statistical analysis was conducted to compare alpha wave
activity across the three phases: before, during, and after the session.
Depending on the distribution of the data, either one-way analysis
of variance (ANOVA) or the Kruskal–Walli’s test was used. When
significant differences were identified, appropriate post hoc multiple
comparison tests were applied. A p-value of less than 0.05 was
considered statistically significant. Effect sizes were also calculated to
determine the magnitude of observed changes.
To examine whether baseline alpha activity predicted individual
responsiveness to the aBWE session, Spearman rank-order correlation
analyses were conducted separately for each electrode region (O1,
O2, F3–C3, F4–C4) and EEG metric (alpha amplitude, frequency,
and power). Three variables were included in the analysis for each
metric: Alpha Baseline, average value before the session; Alpha
Change During, change from baseline to the middle of the session;
Alpha Change After, change from baseline to the post-session period.
All analyses were performed using Jamovi, and Spearman’s rho (ρ)
was selected due to the non-parametric nature of the data. The goal
was to assess: (a) whether baseline levels were predictive of change
during or after the session, and (b) whether there was consistency
between the changes observed during and after the session.
Results were interpreted using a significance threshold of p < .05.
Correlation strength was categorized as weak (|ρ| < 0.30), moderate
(0.30 ≤ |ρ| < 0.50), and strong (|ρ| ≥ 0.50).
Results
The analysis of EEG data revealed significant changes in alpha
wave activity across multiple brain regions following the audiovisual
brainwave entrainment session. In the left occipital region (O1), alpha
amplitude significantly increased during the session (p < 0.0001) and
remained elevated after the session (p < 0.0001), with large effect sizes
of 1.52 [Table 1] and 1.73 [Table 2], respectively. Similarly, alpha
power at this site demonstrated a significant rise during (p < 0.0001)
and after (p < 0.0001) the session, with large effect sizes of 1.72 (Table
1) and 1.90 (Table 2), respectively [Figure 1].
In the right occipital region (O2), a significant increase in alpha
power was observed both during (p < 0.0001) and after (p < 0.0005)
the session. These changes were associated with large effect sizes of
0.98 [Table 3] and 0.86 [Table 4], respectively. Although increases in
amplitude and frequency were also noted in this region, they did not
reach statistical significance[Figure 2].
In the left frontal region (F3–C3), no statistically significant
differences were observed in alpha amplitude, frequency, or power.
However, percentage increases were observed across all parameters.
Specifically, amplitude increased by 17% during and 18% after the
session compared to baseline, frequency rose by 1% and 2%, and
power showed a 23% increase in both comparisons [Figure 3].
In contrast, the right frontal region (F4–C4) exhibited statistically
significant increases. Alpha amplitude increased during (p = 0.0117)
and after (p < 0.0001) the session, with a medium effect size (0.55,
[Table 7] during and a large effect size (0.86, (Table 8) after the
session. Alpha power in this region also increased significantly during
(p = 0.0003) and after (p < 0.0001) the session, with large effect sizes
of 0.99 [Table 7] and 1.39 [Table 8], respectively [Figure 4].
To explore individual variability in responsiveness to the aBWE
session, correlation analyses were conducted to examine whether
baseline alpha values predicted the magnitude of change during or
after the session across amplitude, frequency, and power metrics.
Additional correlations between change during and after the session
were evaluated to assess intra-individual consistency.
In the occipital region O1, baseline amplitude was not significantly
associated with changes during (ρ = –0.053, p = .780) or after (ρ =
–0.177, p = .348) the session. However, amplitude changes during and
after the session were significantly correlated (ρ = 0.501, p = .005),
indicating consistent response patterns. For alpha frequency, baseline
values predicted changes after the session (ρ = –0.649, p < .001), with
lower initial frequencies showing greater increases. No significant
correlation was observed with changes during the session, although
changes during and after were moderately correlated (ρ = 0.421, p =
.020). Regarding power, baseline levels were strongly and negatively
associated with changes both during (ρ = –0.532, p = .003) and after
the session (ρ = –0.645, p < .001), suggesting greater reactivity among
participants with lower initial power. Changes during and after were
also strongly correlated (ρ = 0.776, p < .001).
In the occipital region O2, no significant associations were
observed between baseline amplitude and changes during or after the
session. However, a moderate correlation between changes during
and after (ρ = 0.464, p = .010) indicated intra-individual consistency.
Baseline alpha frequency showed moderate negative correlations with
change during (ρ = –0.409, p = .025) and change after (ρ = –0.417, p
= .022), again suggesting greater responsiveness among those with
lower resting frequency. A moderate correlation between changes
during and after was also observed (ρ = 0.368, p = .046). No significant
correlations were found between baseline power and change scores,
but changes during and after the session were moderately to strongly
correlated (ρ = 0.545, p = .002), reinforcing the presence of stable
intra-individual responsiveness.
In the frontal region F3–C3, baseline amplitude was strongly
predictive of change after the session (ρ = –0.599, p < .001), but
not during. Amplitude changes during and after the session were
moderately correlated (ρ = 0.556, p = .002). Baseline frequency
showed a moderate negative correlation with change during the
session (ρ = –0.418, p = .022), and a trend toward significance after
the session (ρ = –0.327, p = .078). No significant correlation was
observed between frequency changes during and after the session.
Power demonstrated a strong negative correlation between baseline
and post-session change (ρ = –0.587, p < .001), and a trend during
the session (ρ = –0.357, p = .053). Power changes during and after the
session were strongly correlated (ρ = 0.591, p < .001).
In the frontal region F4–C4, baseline amplitude was not associated
with change during the session and showed a borderline negative
correlation with post-session change (ρ = –0.349, p = .060). However,
changes during and after were strongly correlated (ρ = 0.660, p <
.001). For frequency, no significant associations were found with
baseline values, but the correlation between changes during and after
approached significance (ρ = 0.351, p = .057), indicating consistent
response trends. Power analysis revealed a strong negative correlation
between baseline values and post-session change (ρ = –0.598, p <
.001), with a trend during the session (ρ = –0.283, p = .129). A strong
correlation between power changes during and after the session was
observed (ρ = 0.688, p < .001).
Overall, these findings suggest that participants with lower
baseline alpha frequency and power, particularly in occipital and
frontal regions, exhibited greater increases in these metrics following
the aBWE session. Moreover, the consistent correlations between
changes during and after the session across multiple channels and
parameters support the presence of stable, trait-like responsiveness
to the intervention.
Discussion
This study demonstrates that a single 20-minute session of
audiovisual brainwave entrainment using the BrainTap headset
significantly enhances alpha brainwave activity, particularly in the
occipital and right frontal regions. These findings are consistent
with the proposed mechanism of action of aBWE, which aims to
synchronize endogenous brain activity with externally delivered
rhythmic auditory and visual stimuli.
Importantly, correlation analyses revealed that individuals with lower baseline alpha frequency and power tended to exhibit greater increases in these measures following stimulation, particularly in occipital and frontal regions. This inverse relationship suggests that initial resting-state alpha levels may serve as predictors of responsiveness to aBWE. Furthermore, strong positive correlations between changes during and after the session were observed across multiple metrics and brain regions, indicating consistent intraindividual responsiveness and potentially stable neuroplastic effects.
The observed increases in alpha amplitude and power, especially in the O1 and O2 regions, suggest heightened neural synchrony in posterior cortical areas commonly associated with visual processing, relaxation, and internalized attention. Enhanced alpha activity in these areas may reflect a transition from external task engagement toward a relaxed but alert state. This aligns with previous research indicating that alpha oscillations are a hallmark of meditative and restorative cognitive states (Abhang et al., 2016) [4].
In the present study, the F3–C3 region did not show statistically
significant changes in alpha amplitude or power following the aBWE
session. However, modest percentage increases were observed,
which may suggest a subtle modulation not captured with statistical
significance in this sample. Prior research has indicated that alpha
activity in the left frontal region may be more variable and task dependent,
especially in resting-state conditions. For instance, Zhao
et al. (2024) [5] found associations between alpha parameters in F3
and executive functioning, particularly in clinical populations or
under cognitive task demands. Bonança (2024) [6] reported frontal
theta increases but not consistent alpha changes during active math
tasks, emphasizing the differential roles of frontal regions under
cognitive load. Additionally, studies on microstate dynamics suggest
that posterior alpha power may modulate or interact with frontal
systems, dynamically shaping network activation (Croce, 2020) [7].
Therefore, the absence of strong effects in F3–C3 in this resting-state
protocol may reflect a more indirect or state-dependent role of left
frontal alpha activity, as opposed to the more robust and consistent
alpha generation observed in occipital and right frontal regions.
These findings contribute to the growing body of evidence
suggesting that non-invasive neuromodulation techniques such as
aBWE can induce measurable neurophysiological changes in brain
function. Given the role of alpha oscillations in stress regulation,
attentional control, and mental clarity, these results may have
broad implications for applications in mental wellness, workplace
performance, and potentially in clinical interventions targeting
dysregulated alpha activity.
However, some limitations should be acknowledged. The study
lacked a sham or control condition, making it difficult to fully isolate
the specific contribution of the BrainTap stimulation from placebo
effects or general relaxation. The sample included only healthy
participants, and the effects of repeated sessions or long-term use
were not evaluated. Additionally, while EEG provides excellent
temporal resolution, it does not allow for source localization of alpha
activity beyond the electrode level.
In interpreting these findings, it is important to consider the distinction between statistical significance and effect size, particularly in the context of EEG research, which is often characterized by high inter-individual variability and relatively small sample sizes. In this study, regions such as O2 and F4–C4 exhibited both statistically significant increases in alpha power and large effect sizes, underscoring the robustness of the observed effects. More broadly, the inclusion of effect size metrics alongside p-values provides a more comprehensive interpretation of intervention outcomes. Even when statistical significance is not reached, medium or large effect sizes may reflect meaningful physiological modulation, especially in small samples where statistical power is limited. This dual-metric approach is particularly relevant for evaluating the neurophysiological impact of non-invasive brain stimulation techniques such as aBWE.
In interpreting these findings, it is important to consider the distinction between statistical significance and effect size, particularly in the context of EEG research, which is often characterized by high inter-individual variability and relatively small sample sizes. In this study, regions such as O2 and F4–C4 exhibited both statistically significant increases in alpha power and large effect sizes, underscoring the robustness of the observed effects. More broadly, the inclusion of effect size metrics alongside p-values provides a more comprehensive interpretation of intervention outcomes. Even when statistical significance is not reached, medium or large effect sizes may reflect meaningful physiological modulation, especially in small samples where statistical power is limited. This dual-metric approach is particularly relevant for evaluating the neurophysiological impact of non-invasive brain stimulation techniques such as aBWE.
Future research should investigate the longitudinal effects of
repeated aBWE sessions, explore different stimulation protocols,
and include control groups to rule out non-specific effects. Studies
involving clinical populations may also help determine whether this
approach can benefit individuals with disorders linked to dysregulated
alpha activity, such as anxiety or insomnia.
In summary, these results further support the effectiveness of
the intervention in modulating alpha activity, especially among
individuals with lower baseline alpha power or frequency, who
demonstrated the most pronounced increases. This finding suggests
aBWE may be particularly well-suited for populations with hypoactive
alpha states, potentially including those with stress, anxiety, or
cognitive overload.
Conclusion
The results of this study demonstrate that a single 20-minute
session of audiovisual brainwave entrainment using the BrainTap
headset significantly enhances alpha brainwave activity, particularly
in the occipital and right frontal regions. These changes were marked
by statistically significant increases in both amplitude and power,
with large effect sizes observed in multiple sites.
Additionally, exploratory analyses suggest that baseline alpha power and frequency may predict the magnitude of response, with individuals showing lower initial levels exhibiting greater changes. These findings support the relevance of individual variability in resting-state EEG profiles as potential biomarkers of responsiveness to aBWE interventions.
The findings suggest that audiovisual entrainment is a promising non-invasive technique for modulating brain activity associated with relaxation, internalized attention, and mental clarity. While the effects were immediate and robust, further research is needed to explore the duration of these changes, their functional outcomes, and their applicability in clinical or performance-oriented settings.
This study contributes to the growing evidence base supporting brainwave entrainment technologies and highlights the value of realtime EEG assessments in understanding their neurophysiological impact.
Executive Summary:
• This white paper summarizes a pilot study examining the
effects of a 20-minute audiovisual brainwave entrainment
(aBWE) session using the BrainTap headset on alpha
brainwave activity.• Real-time EEG monitoring in 30 healthy adults revealed significant increases in alpha amplitude and power, particularly in the occipital and right frontal regions.
• These findings suggest that aBWE may be an effective noninvasive method to enhance relaxation and mental clarity by increasing alpha brainwave activity. Further studies are encouraged to explore its long-term benefits and applications.
• Exploratory analyses showed that individuals with lower baseline alpha levels experienced greater increases, suggesting that baseline alpha may predict response to aBWE.
Acknowledgements
We would like to thank Dr. Patrick Porter from BrainTap for
donating the BrainTap devices used in this study.
References
Citation
Cidral-Filho FJ, Prasad OP, Donatello NN. Impact of Audiovisual Brainwave Entrainment on Alpha Wave Activity: A Real-Time EEG Assessment. J Neurol Psychol. 2025; 11(1): 01.