
Journal of Nutrition & Health
Download PDF
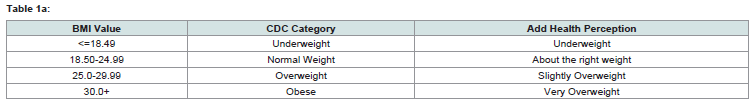 Table 1a:
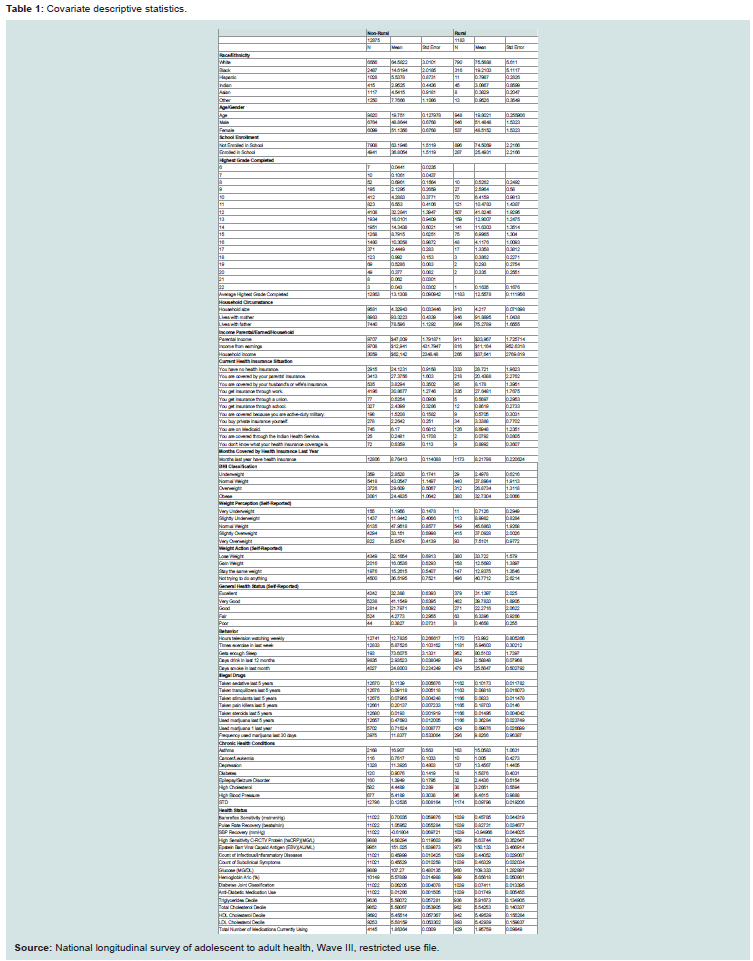 Table 1:: Covariate descriptive statistics.
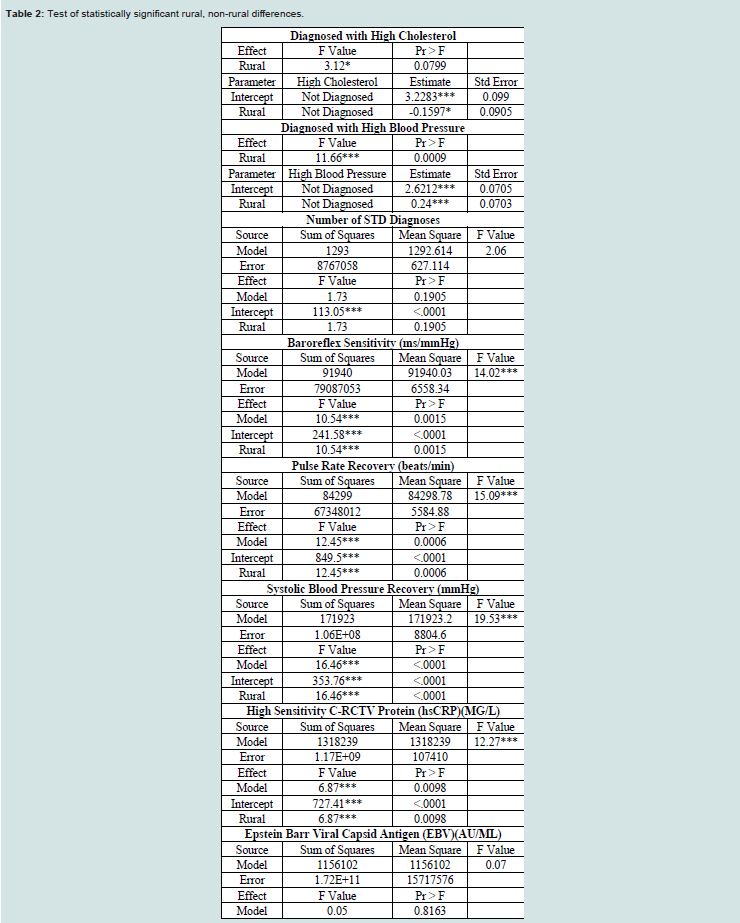 Table 2:: Test of statistically significant rural, non-rural differences.
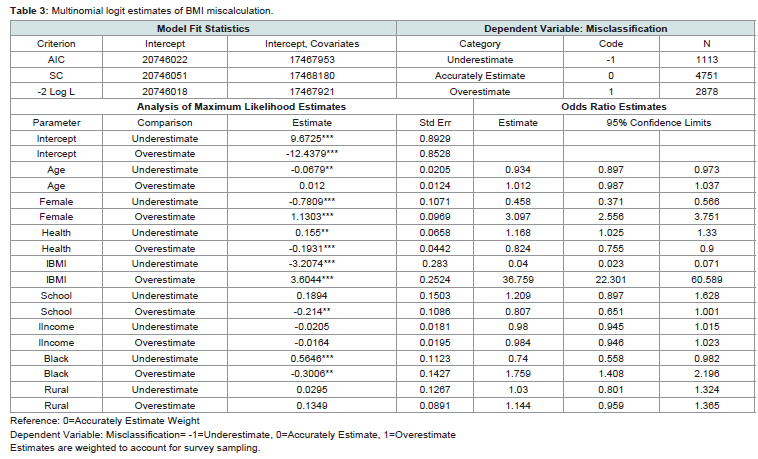 Table 3: Multinomial logit estimates of BMI miscalculation.
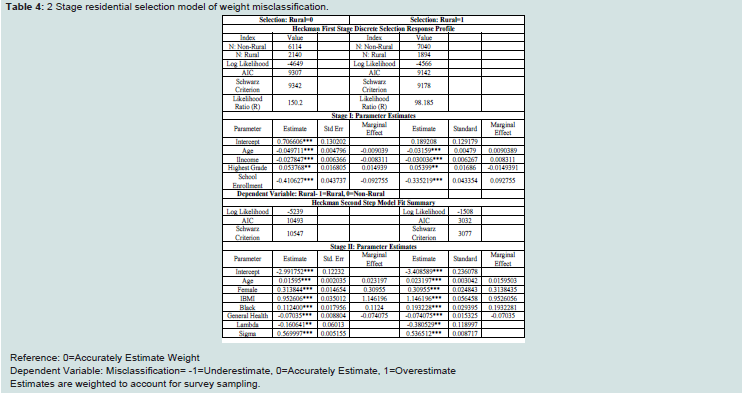 Table 4: 2 Stage residential selection model of weight misclassification.
Review Article
Rural Adolescent Health: Issues, Behaviors and Self-Reported Awareness
Jacobs MM*
Health Services and Information Management, East CarolinaUniversity, USA
*Address for Correspondence: Jacobs MM, Health Services and Information Management, East Carolina University, 600 Moye Blvd Mail Stop 668, Health Sciences Building 4340E, Greenville NC, 27834, USA, Tel: 252-744-6182, E-mail: Jacobsm17@ecu.edu
Submission: 25 March, 2020;
Accepted: 26 April, 2020;
Published: 29 April, 2020
Copyright: © 2020 Jacobs MM, et al. This is an open access article
distributed under the Creative Commons Attribution License, which
permits unrestricted use, distribution, and reproduction in any medium,
provided the original work is properly cited.
Abstract
Purpose:
The purpose of the study was to examine the health
status of rural adolescents and young adults through a comprehensive
review of detailed health information, behavior and health awareness.
The disparity in health awareness between rural and non-rural residents
compared and evaluated.
Methods:
Rural-Urban Commuting Area (RUCA) codes were
combined with respondent-level data from the Longitudinal Survey
of Adolescent to Adult Health (Add Health) to classify individuals
as rural/non-rural residents. Health characteristics and perceived
health awareness was tested for statistically significant differences.
Differences in weight perception accuracy was compared for
systematic differences controlling for self-selection into rural areas
using a two-stage selection model.
Findings:
Analysis revealed that rural residents have a higher
incidence of major health conditions including epilepsy, high
cholesterol, high blood pressure and diabetes. Additionally, they have
a higher prevalence of unhealthy behaviors including drinking and
drug use. Rural residents are less likely to be insured, but more likely to
be overweight or obese. While rural adolescents are more likely to misclassify
their body weight, this misclassification is a result of the higher
incidence of overweight rather than the residential location.
Conclusion:
The higher prevalence of chronic conditions
combined with the lower income and education levels suggests
the rural environment is a unique and potentially challenging
context for adolescent health. Improving rural adolescent health will
require innovative solutions appropriate for rural environments and
changes in individual health literacy. Solutions must be multisectoral,
engaging education, economic development, and other community
perspectives to establish key drivers for health equity.
Purpose
Since 2000, the rural population has grown less than urban and
suburban, resulting a in smaller share of Americans living in rural
counties (Pew Research Center 2018). A lower population base has
led to a lack of health facilities. Marginalized rural populations are
particularly vulnerable to underrepresentation and policy neglect [1].
The difficulty in accessing quality health care combined with the rising
cost of health care has put rural communities at risk for poor health
outcomes [2]. A lack of information on the health status and risks of
adolescent youth in rural areas undermines policymakers’ ability to
justify competitive budget expenditures for preventive care in rural
areas. It is crucial to understand who they are and what contributes
to health, chronic disease and conditions, to address the healthcare
needs of rural communities.
Despite the difficulties faced by rural residents and evidence of
disparate health, recent literature has focused primarily on substance
(drug and alcohol) abuse, fertility, or mental health issues. While
many comprehensive health assessments of rural adolescents and
young adults in Africa, Asian, and Latin American have been
published over recent decades, less attention has been directed to the general health of young people in the United States. This study
will supplement existing literature by providing an assessment of
adolescent/young adult health in the US. This study uses a unique
dataset with comprehensive health, clinical and biological outcomes
to focus on three dimensions of adolescent health-chronic disease,
health behavior and health self-awareness-in order to provide an
understanding of the health issues faced by rural adolescents and
possible avenues to health solutions.
High-risk behavior is a significant health risk faced by young
adults. A rural environment presents developmental risk behaviors
that may increase the probabilities for adverse health outcomes
in adolescence. Rural adolescents, particularly among poor and
minority youth, are susceptible to significant risk behaviors and
health concerns [1]. Studies have found that alcohol and drug use,
pregnancy, and sexually transmitted disease rates are higher among
rural adolescents [3,4]. Rural areas have higher rates of alcohol,
tobacco, and methamphetamine use, while prescription drug abuse
and heroin use has grown in towns of every size. Rural youth are
particularly vulnerable to the availability of marijuana because of the
ability to produce the illegal drugs in rural regions and greater difficulty
providing treatment [5]. Drug and alcohol abuse is difficult to combat
in rural areas due to limited resources for prevention, treatment, and
recovery [6]. Factors contributing to drug abuse in rural America
include low educational attainment, poverty, unemployment, highrisk
behaviors, and isolation [6]. Lack of employment opportunities,
transportation, educational opportunities, health services, and
health insurance are associated with living in rural areas and have
been shown to increase rural adolescents’ health vulnerability [7].
Additionally, rural adolescents with drug and alcohol abuse problems
face the challenges of accessing adequate treatment and recovery [8].
Rates of both teen and unintended teen pregnancy are over 60
percent higher in rural areas than urban. Disparities in teen birth
rates for those in rural counties are associated with reduced access to
health services, lack of health insurance, poverty, and the proportion
of female-headed households [9]. Such high rates are also directly
associated with sexual activity and contraceptive use [10]. National
data indicate that, compared to urban teens, rural teen females are more likely to report ever having had sex, yet less likely to report
the use of contraception at first sex [11]. More troubling is that
young adults represent only 25 percent of the sexually experienced
population but 50 percent of all new sexually transmitted diseases
[12]. While educating adolescents on sexual health topics has been
shown to curb unplanned pregnancies and decrease the incidence of
sexually transmitted diseases, these sexual education programs are
costly to implement and politically controversial [13].
One of the most frequently cited indicators of rural health is
the disproportionately high rates of overweight and obesity rates.
Residence in rural areas is associated with higher prevalence or
increased odds of obesity compared to those living in urban areas.
Rural adolescents have 26 percent greater odds of obesity, compared
to urban adolescents. While most studies focus on those individual
factors such as poverty rates, low education levels, and lifestyle
differences that may contribute to obesity, some examine associations
with environmental characteristics such as food environment [1],
physical changes, and social dynamics [14]. It is generally accepted
that longer exposure to certain physical and social environments
may contribute to differences in urban and rural obesity, but the
mechanisms through which environmental aspects promote obesity
warrants further study [15].
Young adults, like most residents of rural communities, often
struggle with access to care. This struggle is mainly due to unique
rural challenges like few local doctors, poverty, and remote locations
[16]. Rural areas suffer from a lack of physicians, specialists, nurses,
and other healthcare practitioners, making it more difficult and
cumbersome to obtain adequate preventative care [13]. Research
estimates that an effective and efficient physician-to-population
ratio is 1:1200, but the ratio is only 1:1910 in rural areas compared to
1:1300 in urban areas. National Rural Health Association reports that
there are nearly 10 times more specialists per 100,000 urban residents
compared to rural communities [16]. The lack of local doctors and
living in remote areas contributes to delay or avoid care because of
the great distance needed to travel for care.
Mental health services are even more challenging to obtain. Rural
youth are among one of the groups that have higher rates of suicide
in comparison to their urban peers [16]. More than 85% of rural
residents live in areas with shortages of mental health professionals
[17]. This shortage of leaves 65% of rural residents to receive mental
health services from their primary care physicians despite having a
higher incidence of mental illness, depression, and other treatable
mental/emotional conditions [18,19]. Subsequently, rural residents
are more likely to use pharmacology than psychotherapy to treat
mental health disorders [20]. While mental health falls outside the
scope of this study, the author plans subsequent analyses focusing
specifically on this sector.
This study proceeds with a discussion of the data and methodology utilized, including the identification strategy and health outcomes
selected, followed by a detailed outline of the primary significant
differences between rural and non-rural youth and the most prevalent
concerns among young adults in rural areas. Regression analysis
attempts to explain some of these observed differences and most
startling concerns. These ideas are then summarized with concluding
remarks.
Methods
Identification: One primary explanation for variation in rural
health outcomes research is the variable definition of rural. While the
many definitions of the term rural seldom agree, the USDA Economic
Research Service recommends that the choice of a rural definition be
based on the purpose of the activity or the availability of information.
This study utilizes the Rural-Urban Commuting Area (RUCA)
codes which classify U.S. census tracts using measures of population
density, urbanization, and daily commuting. RUCA codes are readily
available in the data set used for this analysis. The most recent RUCA
codes are based on data from the 2010 decennial census and the 2006-
10 American Community Survey (ACS).
The Office of Management and Budget (OMB) uses RUCA
codes to identify counties as metropolitan, micropolitan or neither.
A metropolitan area contains a core urban area of 50,000 or more
population while a micropolitan area contains an urban core of at least
10,000, but less than 50,000. All counties not part of a Metropolitan
Statistical Area (MSA) are considered rural. Micropolitan counties
are considered non-metropolitan or rural along with all counties
not classified as metro or micro. After the 2010 Census, the nonmetro
counties contained 46.2 million people-15 percent of the
US population and 72 percent of the land area of the country. This
included all census tracts inside metropolitan counties with the codes
4-10 to be rural. Based on this assessment and review, this study
classified respondents in areas with RUCA codes of 4-10 as rural
aligning with OMB recommendations.
Data: Analysis utilizes data from the National Longitudinal
Study of Adolescent to Adult Health (Add Health)-a longitudinal
study of adolescents in grades 7-12 during the 1994-95 school year
followed into young adulthood with four in-home interviews. Add
Health combines longitudinal survey data on respondents’ social,
economic, psychological and physical well-being with contextual data
on the family, neighborhood, community, school, friendships, peer
groups, romantic relationships and biological data, providing unique
opportunities to study how social environments and behaviors in
adolescence link to health and achievement outcomes in young
adulthood.
Data in this analysis is drawn specifically from Wave III
conducted in August 2001-April 2002. Wave III, conducted when
respondents were between 18 and 26 years old, focuses on how
adolescent experiences and behaviors are relate decisions, behavior and health outcomes in the transition to adulthood. Biological
specimens, urine and saliva samples, were obtained from a subset
of Wave III respondents for tests Chlamydia Trachomatis (CT),
Neisseria gonorrhoeae (GC), and other experimental STI testing.
An Oral Mucosal Transudate (OMT) specimen allowed for Human
Immunodeficiency Virus Type-1 (HIV-1) testing along with other
curable STDs. Saliva samples enabled DNA extraction, purification
and subsequent genotyping of respondents.
In addition to biological and health outcomes data, Wave III
contains data specific to the late adolescent, young adulthood life
stage on parent-child and sibling relations, contact with friends
from high school, the role of mentors and mentoring relationships,
personal income, wealth and debt, civic and political participation,
children and parenting, involvement with the criminal justice system,
and religion and spirituality. Wave III also has extensive information
on health and health related behavior including diet, physical activity,
access and use of health services, sexual behavior, contraception,
sexually transmitted infections, pregnancy and childbearing, suicidal
intentions and thoughts, mental health and depression, drug and alcohol use and abuse, injury, delinquency, and violence in addition
to physical measurements of height and weight. Mean values for
biological, demographic, social and behavioral characteristics are
given in (Table 1).
Covariates-Health Related Behaviors: A variety of behavioral
patterns are included in the Add Health survey. As with all surveys,
patterns of omission, valid skip, non-response and refusal can impact
the robustness of response data. In order to capture behavioral
impacts on health and provide robust estimates, exercise frequency,
sleep sufficiency, television watching, cigarette smoking, alcohol
consumption and marijuana and illegal drug use are examined.
Illegal drugs include sedatives, tranquilizers, stimulants, pain killers
and steroids used by respondents anytime during the five years prior
to their interview. Additionally, this study examines frequency of
marijuana use in the last 12 months and last 4 weeks.
Alcohol consumption is measured as the number of days the
respondent drank in the last 12 months, while smoking is measured
as the number of days in the last month the respondents smoked.
Binary indicators are added for having health insurance and receiving
enough sleep, while variant terms measure the frequency of exercise
and hours of television watching in an average week.
Covariates-Health Issues/Indicators: Three measure of
cardiovascular fitness are provided-Systolic Blood Pressure (SBP)
Recovery, Pulse Rate Recovery (PRR) and Baroreflex Recover.
First, SBP recovery after exercise represents an important index of
cardiovascular and autonomic nervous system response to physical
stress and has been shown to be a clinical tool applied toward
diagnosing cardiovascular abnormalities. Second, PRR is a pulse
measurement taken immediately following intense exercise. PRR is
used in some fitness tests to evaluate the heart’s ability to recover from
exercise and is used to evaluate the heart’s ability to recover from
exercise. Finally, the baroreflex acts as an effective buffer of short-term
blood pressure fluctuations that accompany daily life. Studies suggest
that a diminished baroreflex recovery is an independent risk factor
for sudden death after myocardial infarction. In hypertensive humans
and animals, the baroreflex control of heart rate is diminished.
In addition to SBP Recovery, PRR and Baroreflex recovery, thirteen
additional clinical measures are reported for each respondent. These
measures indicate the existence, persistence or maintenance of health
issues. 1) High Sensitivity C-reactive Protein (hsCRP) is a protein
that increases in the blood with inflammation and infection as well
as following a heart attack, surgery, or trauma. Studies have suggested
that a persistent low level of inflammation is often associated with
Cardiovascular Disease (CVD). The hs-CRP test accurately measures
low levels of CRP to identify low but persistent levels of inflammation
and helps predict a person’s risk of developing CVD.
The 2) Epstein Barr Viral Capsid Antigen (EBV) indicates that
a person has or has had the Epstein Barr Virus. EBV is a member
of the herpes virus family and one of the most common viruses to
infect people around the world. According to the Centers for Disease
Control and Prevention (CDC) most people will contract EBV at some
point. In adolescents and adults, it causes an illness called infectious
mononucleosis, or mono, in about 35 to 50 percent of cases. Also
known as “the kissing disease,” EBV is usually spread through saliva and rarely through blood or other bodily fluids.
Additionally, 3) Glucose level, 4) Hemoglobin A1c level, 5)
Triglycerides Decile, 6) Total Cholesterol Decile, 7) HDL Cholesterol
Decile and 8) LDL Cholesterol Decile are provided in addition to
four summary measure. The first summary measure, 9) Count of
Common Subclinical Symptoms numerates the sources of infection
or inflammation that have the potential to confound hsCRP-based
estimates of cardiovascular disease risk. High hsCRP concentrations
triggered searches for non-cardiovascular (e.g. infectious or
inflammatory) diseases which were counted and categorized.
The second summary measure, 10) Count of Infectious/
Inflammatory Diseases, therefore, counts and categorizes these
conditions to enable investigators to control for potential
confounding in hsCRP analyses. The third summary measure, 11)
Diabetes Joint Classification, classifies respondents as having diabetes
if they had a fasting glucose ≥ 126 mg/dl, non-fasting glucose ≥ 200
mg/dl, HbA1c ≥ 6.5%, self-reported history of diabetes except during
pregnancy or used anti-diabetic medication in the past four weeks.
Finally, 12) Anti-Diabetic Medication Use, flags those who report
using medications in the past four weeks associated with one or
more of the following therapeutic classification codes: antidiabetic
agents, sulfonylureas, non-sulfonylureas, insulin, alpha-glucosidase
inhibitors, thiazolidinediones, meglitinides, miscellaneous
antidiabetic agents, antidiabetic combinations, dipeptidyl peptidase
4 inhibitors, amylin analogs or incretin mimetics. A final indicator,
13) Total Medications Currently using, captures drug use at the time
of the survey.
In addition to these clinical measures, Add Health Respondents
indicate whether they have ever been diagnosed by a doctor or nurse
with any of the following conditions: asthma, cancer/leukemia,
depression, diabetes, epilepsy/seizure disorder, high cholesterol,
high blood pressure, bacterial vaginosis, cervicitis/ or mucopurulent
cervicitis, chlamydia, genital herpes, genital warts, gonorrhea,
hepatitis B, HIV/AIDS, human papilloma virus, pelvic inflammatory
disease, syphilis, trichomoniasis, urethritis or vaginitis. For the
purpose of this analysis, Sexually Transmitted Diseases (STD) are
collapsed into a single category indicating whether a respondent had
been diagnosed with at least one STDs.
Covariates-Self-Reported Health Awareness: The CDC categorizes
weight as (i) Underweight, (ii) Normal Weight, (iii) Overweight, and
(iv) Obese based on their BMI level. Compared to other measure of
body fatness, BMI appears to be correlated with various metabolic
and disease outcomes. Despite criticisms of this generic scale, in
general, BMI is an inexpensive and easy-to-perform method of
screening for weight category. This analysis examines whether one’s
own body perception aligns with their BMI classification. Add Health
respondents classify their weight status as (i) Very Underweight, (ii)
Slightly Underweight, (iii) Right Weight, (iv) Slightly Overweight,
and (v) Very Overweight. Assuming that these categories represent
self-assessments of BMI, they are aligned with the CDC categories as
outlined in (Table 1a).
Given the very small proportion of the sample classified as very
underweight, both underweight categories are combined into a single
underweight group. Analysis will compare individual’s assessment of their weight to the classification of their actual BMI to determine
whether they systematically under, over or accurately estimate their
body weight. The extent to which respondents over, under or accurately
assess their weight is also examined and how mis-estimation varies by
rural/urban status. These BMI classifications will also be compared to
their reported intention to gain weight, lose weight, maintain weight
or do nothing about their body weight, referred to as weight action.
In addition to awareness of weight and necessary weight action, this
study also examines individual assessment of their personal health
which they classify as excellent, very good, food, fair or poor.
Statistical analysis: To accommodate the design of Add
Health, statistical analysis needs to account for the sample weights,
stratification, and clustering that was part of the sample design.
Failure to account for sampling weights will affect the calculation
of the point estimate while misspecification of the stratification or
clustering will impact the calculation of the standard errors. Various
procedures in SAS software package (SAS 9.4, Cary, NC) allow
for correct estimation of variances/standard errors from complex
samples. Rural and non-rural samples were test for statistically
significant differences. All health issues, health related behaviors and
self-reported health awareness aspects outlined above were examined.
Appropriate logistic, ANOVA or linear testing techniques were used
to test discrete, continues and categorical covariates for significant
differences between rural and non-rural groups.
To explain observed differences in weight and weight
classification, a multinomial logit model evaluates respondent over
(1), under (-1) or accurate (0) BMI classification (measured relative
to their actual weight classification) as a function of age, BMI
level, gender, income, general health, rural residence and school
enrollment. Since individuals chose many aspects of their domestic
environment including geographic location (urban, rural, suburban,
etc.), it is possible that residential self-selection could bias estimates by
confounding differences in the locations themselves with rural-nonrural
disparities. To ensure that estimates are robust to residential
selection, weight misclassification was also estimated using a twostage
estimation selection procedure with discrete data following the
framework popularized by [21,22].
Accounting for individual selection into rural areas, allows for
evaluation of the differences in misclassification holding residential
selection constant. Stage one-selection-frames a binary indicator for
rural residency as a function of age, adolescent school enrollment
and income. Stage two-response-contends that misclassification
is a function of age, gender, BMI and general health status. BMI is
used as an explanatory variable to allow for systematic various in
misclassification along the BMI distribution.
Results
Demographic characteristics: Results of listed in Table II. Few
demographic differences between rural and non-rural residents
exist. They appear to have similar age, gender, household size and
household composition profiles. Respondents in both groups are
equally distributed male and females, live in 3-4 person households
and are between 18 and 24 years old. Surprisingly, the proportion
living with their biological mother and/or father does not significantly
differ, however, they do present significantly different education and income profiles. Consistent with previous findings, rural
residents have lower earned income and educational attainment.
Three income measurements-parent’s income, own earned income
and own household income-were examined and show statistically
lower income for rural residents who also have statistically lower
educational attainment and fewer individuals enrolled in school. The
racial/ethnic composition of rural and non-rural populations also
differ significantly. Rural populations appear to be less diverse than
others consisting of over 75 percent whites, compared to 65 percent
in other areas. Minorities have a smaller representation in rural areas
compared to non-rural communities (Table 2).
Health Issues/Indicators: There is a large difference in the
health insurance status of the two groups. A higher percentage of
rural residents have no health insurance, while less are covered
by the insurance of a spouse or parent. They report that they held
insurance for fewer months last year compared to non-rural young
adults. While not directly related, it is likely that the lack of insurance
coverage or full-year insurance coverage contributed to worse health
outcomes by reducing the quantity and/or quality of care received
[23]. Health disparities have also been linked to lack of preventative
health services obtained [24].
One of the most unique aspects of the Add Health data is the
large amount of medical diagnosis and clinical information available.
Comparing diagnosis data between non-rural and rural adolescent
and young adults show higher rates of asthma, epilepsy/seizure
disorders, diabetes, high cholesterol, high cholesterol and high blood
pressure in rural residents. Diabetes, high cholesterol and high blood
pressure are known comorbidities of overweight and obesity and
higher rates of excess weight among rural residents’ likely attributes
to the higher rates of related comorbidities [25,26]. Additionally,
rural adolescents have higher triglycerides and hs-CRP indicating
high levels of these fatty particles in the blood and greater risk of heart
disease. Rural residents also show statistically higher rates of seizure
disorders-a condition that has been growing in prevalence over the
last decade, according to the CDC. Studies attributed these higher
rates to the increased prevalence of untreated traumatic head injuries.
SBP Recover, PRR and BRS differ between rural and non-rural
residents suggesting lower relative cardiac fitness, increased tendency
towards Cardiovascular Disease (CVD) and higher likelihood of
coronary issues or disorders. While detailed medical review of these
factors lies outside the scope of this paper, they can be impacted by a
variety of factors including our age, medical conditions, medications,
diet, and fitness level.
Health Related Behaviors: There is no difference in exercise
frequency, sleep or hours of television. The proportions of those who
reported having used sedatives, pain killers, stimulants, tranquilizers or
steroids in the last five years do not differ significantly. Rural residents
consume alcohol and marijuana more frequently. These trends are
supported by literature showing large differences were exhibited in
marijuana use, both across nonmetropolitan‐metropolitan status and
across youth from metropolitan and nonmetropolitan counties, but
that rates of illicit drug use were essentially the same regardless of
location [27,28].
Self-Reported Health Awareness: Many of these health conditions
are the result of excess body weight or obesity. Examination of BMI
showed higher BMI among rural youth. While these BMI levels are
highly unhealthy, it does not appear that rural respondents are aware
of their situation or report an intention to change. Roughly equal
proportions of both rural and non-rural residents report that they are
overweight, despite a greater prevalence of overweight and obesity
among rural residents. This indicates that either rural respondents
are not aware of their BMI status or refuse to report themselves as
such. Furthermore, they do not appear to be any more likely to report
wanting to lose weight than their non-rural counterparts.
Finally, given the results presented above, rural and urban
residents report similar self-assessments of their overall health. This
lack of health awareness among rural residents has been found by
other researchers as well [29]. The lack of awareness or refusal to
accept their status is often perpetuated by the community at large and
ignorance regarding the detrimental health effects of excess weight
[30].
Misclassification Selection Model: Multinomial logit model
estimates of weight misclassification show that misclassification type
varies by age, gender, school enrollment, and general health status,
but not by income or rural residency (Table 3). As individuals age
and increase BMI they are less likely to underestimate and more
likely to overestimate their weight. As adolescents leave school and
experience health declines more likely to overestimate and less likely
to underestimate their body weight. Blacks and females tend to
overestimate weight. The multinomial showed that misclassification
does not differ significantly for rural and non-rural residents when
controlling for age, BMI, gender and other factors.
Multinomial odds ratio estimates suggest that BMI is the largest
and most important driver of weight misclassification. Estimates
suggest that the probability of overestimation increases as BMI
increases with an odds ration of 36.054. Estimates suggest that BMI is
the primary driver of misclassification. A two-stage sample selection
model tests the robustness of these results. This technique controls for
self-selection into rural areas before estimating the misclassification
model. Two-stage estimates suggest that those factors associated with
weight misclassification are similar for rural and non-rural residents.
Controlling for residential self-selection, model results show that BMI
is the primary determinant of misclassification and misclassification
type [31,32] (Table 3 and 4).
Conclusion
While demographically similar, rural and non-rural youth have
vastly different health profiles, behaviors and self-awareness. This
study utilizes RUCA codes to classify adolescents as rural based on
the OMB county classifications. OMB considers counties within
census tracks with codes between 4 and 10 to be non-metropolitan.
Adolescents within these non-metropolitan, rural areas have higher
incidence of all major health conditions including epilepsy, high
cholesterol, diabetes and high blood pressure. Not only are these
health concern more prevalent among rural individuals compared to
their urban counterparts, but their health concerns extend beyond
measurable conditions to include a higher prevalence of unhealthy
behaviors including drinking and marijuana use.
While generally similar in health, rural adolescents are more likely to be overweight or obese than urban. However, rural adolescents do
not appear to be aware of the severity of their excess weight or the
adverse health conditions that it causes-high cholesterol, high blood
pressure and diabetes-which disproportionately impact rural youth.
Disparate health outcomes could be partially attributed to the lack
of preventative care. These findings that speak to the complexity
of adolescent health. Not only does healthcare appear less readily
available, but the ability of individuals in rural communities to afford
health services is also questionable. Substantially lower income
among individuals and household combined with lower educational
attainment likely play an integral low in the worse health outcomes
of rural adolescents.
Rural areas have a higher prevalence of overweight compared to
non-rural. Individuals in rural areas are also more likely to misclassify
their body weight. Regression analysis explores the determinants of
over, under and accurate weight classification. Race, age, gender and
health are related to weight misclassification, while income and rural
residency are not. Robustness test verify that BMI is the primary
determinant of BMI misclassification. As BMI increases, individuals
are more likely to underestimate their weight status. Results transcend
self-selection into rural areas showing that BMI misclassification is
primarily determined by BMI level irrespective of residential location.
The rural environment is a unique and potentially challenging
context for adolescent health. Lower income and education likely
contribute to the disparate health circumstances of young, rural
adults. Rural settings may present compounding barriers to health
care for young adults, including isolation, insufficient financial
resources, lack of available services, impaired geographic accessibility,
and concerns for confidentiality within the small community settings.
These conditions combined with the inherently different health
infrastructure in rural areas necessitate new, less conventional health
interventions to create sustained change and drive health equality.
References
Citation
Jacobs MM. Rural Adolescent Health: Issues, Behaviors and Self-Reported Awareness. J Nutri Health. 2020;6(1): 11.