
Journal of Nutrition & Health
Download PDF
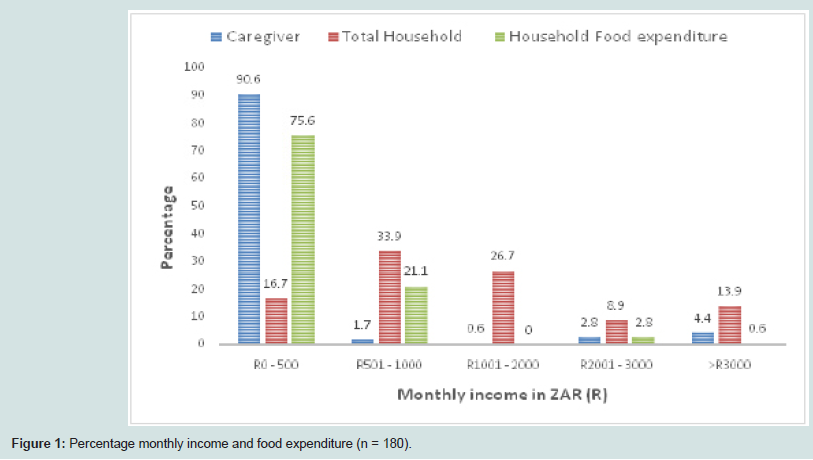 Figure 1: Percentage monthly income and food expenditure (n = 180).
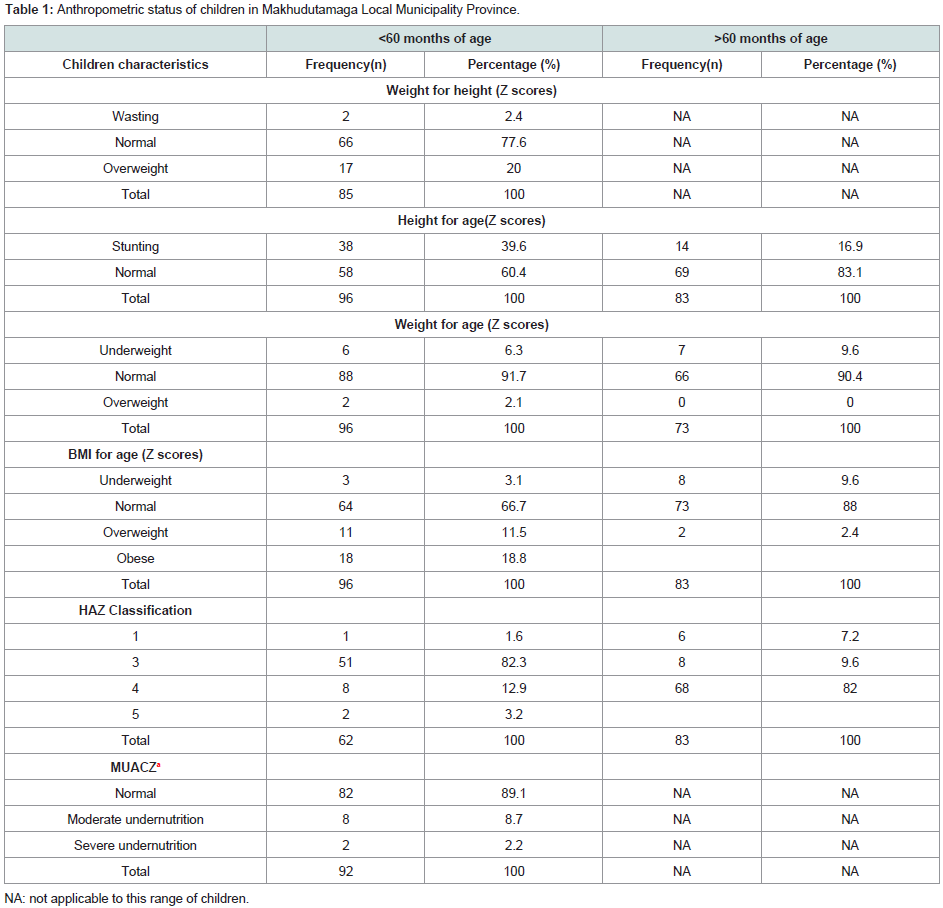 Table 1: Anthropometric status of children in Makhudutamaga Local Municipality Province.
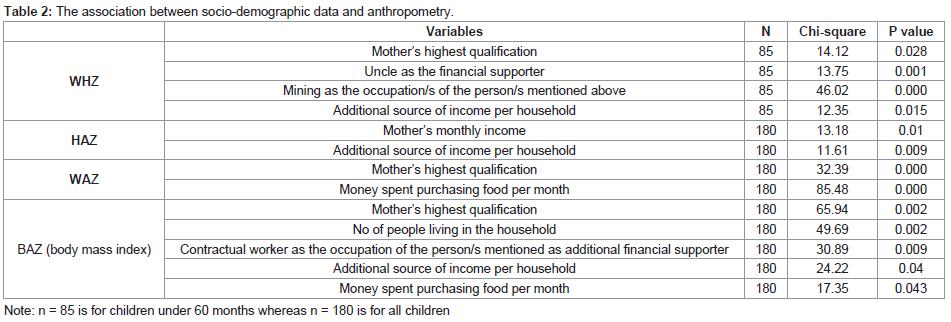 Table 2: The association between socio-demographic data and anthropometry.
Research Article
Socioeconomic Determinants Influencing Nutritional Status of Children in Sekhukhune District of Limpopo Province in South Africa
Phooko-Rabodiba DA1, Tambe BA2, Nesamvuni CN3 and Mbhenyane XG4*
1Department of Human Nutrition, University of Limpopo, South
Africa
2Division Human Nutrition, Stellenbosch University, South Africa
3Department of Nutrition, University of Venda, South Africa
4Division Human Nutrition, Stellenbosch University, South Africa
*Address for Correspondence: Mbhenyane XG, Professor and Research Chair, Division Human Nutrition, Stellenbosch University, PO Box 241, Cape Town, 8000, South Africa; Tel: +2721 938 9135, E-mail: xgm@sun.ac.za
Submission: 16 February, 2019;
Accepted: 13 August, 2019;
Published: 16 August, 2019
Copyright: © 2019 Phooko-Rabodiba DA, et al. This is an open access article distributed under the Creative Commons Attribution License, which permits unrestricted use, distribution, and reproduction in any medium, provided the original work is properly cited.
Abstract
South Africa has adequate food supplies to feed the entire
population at national level. However, reports have shown evidence
of under-nutrition among certain parts of the population due to lack
of access. The aim of the study was to determine the relationship
between socioeconomic status of the household and the nutritional
status of children one to twelve years (1-12 years) in Sekhukhune district
of Limpopo Province.
The study used exploratory designs. A structured interviewer-led
questionnaire was used to determine socio-economic parameters and
standard anthropometric procedures. All analyses were done using
Statistical Package for Social Sciences version 20. A total number of
180 mother-child pairs participated in the study. The sample distribution
for children was 46.1% male and 53.9% females. Most mothers were
unemployed and spent less than 500.00 ZAR (≈50 USD) per month to
purchase food for the household. There was a high (39.6%) prevalence
of stunting among children under the age of 60 months, a medium
prevalence of underweight, and a low prevalence of wasting in all
children. Most caregivers were overweight or obese. Maternal level
of education and household income was significantly associated with
anthropometric status indicators (p<0.05).
This study revealed a high rate of unemployment, poor household
income and purchasing power, and high level of food insecurity.
This might have contributed to the high prevalence of stunting and
a medium prevalence of underweight recorded in the study. There is
urgent need to address basic needs to improve access to nutrient rich
foods and health care.
Keywords
Socioeconomic determinants; Nutritional status; Children under 12 years; Limpopo province; South Africa
Introduction
Malnutrition remains a problem in many parts of the world,
815 million people throughout the world are malnourished due to
insufficient food in 2016, up from 777 million in 2015 [1]. Chronic
undernutrition could result in stunting, wasting, and underweight.
According to recent studies, approximately 52 million children under
five suffer from wasting; their weight is too low for their height, while
155 million suffer from stunting globally [2]. In Africa, an estimated
47 million children are stunted, 35 million are underweight, and 11
million are wasted according to Kleynhans et al. [3]. These children
begin their lives at a marked disadvantage: they face learning
difficulties in school, earn less as adults, and face obstacles to
contribute in their societies [2].
The South Africa Demographic and Health Survey 2016 for
children aged between one to five years showed a high rate (27%
and 22%) of stunting at national level and in Limpopo Province
respectively [4]. Another study in South Africa by Shisana et al. reported 26.5%, 11.9%, and 9.4% stunting in one to three year old’s,
four to six year old’s [5], and seven to nine year old’s respectively at
national level. Sekhukhune district exhibited a high rate of stunting
(36%) in children 13 to 215 months of age according to Food
Insecurity and Vulnerability Information Management System for
South Africa [6]. Greater Sekhukhune District Municipality (GSDM)
is an underprivileged area and was identified as a nodal site by
Integrated Sustainable Rural Development Programme (ISRDP), due
to its high unemployment rate of 69% to 82.4% [7].
United Nations International Children’s Emergency Fund
(UNICEF) conceptual framework of child malnutrition explained
the determinants of undernutrition. This framework classifies factors
into three levels: the immediate, the underlying, and basic causes.
Dietary intake and infections are classified as immediate causes [8-10]. Household food security, inadequate care and feeding practices,
unhealthy household environment, and limited access to healthcare
services are the underlying causes [11,12]. While basic causes
include limited land for cultivation, parental low level of education,
employment status, and household income, just to name a few [13,14].
This study was conducted in Limpopo province because of the
high (49.9%) unemployment rate compared to other provinces
and because of the inadequate information available on the child
nutrition status at the Sekhukhune district level [15]. The high rate
of unemployment and poverty in the province could have an impact
on nutritional status of the children between 1 to 12 years. This
study, therefore, aimed to investigate determinants associated with
underweight, stunting, and wasting in the Sekhukhune District in
Limpopo Province of South Africa.
Materials and Methods
The study used an exploratory and correlational research design
and it aimed at establishing a relationship between socioeconomic
characteristics of the mother and nutritional status of children aged 1 to 12 years. The study used both quantitative and qualitative data
collection techniques to collect data over a period of 24 months.
The study setting was GSDM, one of the five districts of the
Limpopo Province contributing to 20% of the provincial population
of 5.5 million. One local municipality in GSDM, Makhuduthamaga,
was purposively selected.
The study populations were mothers/caregivers with children 1 to
12 years of age living in Makhuduthamaga Local Municipality of GSD
Min Limpopo Province. Makhuduthamaga Local Municipality M
constitutes 27% (262921) of the total population of GSDM with 13.8%
(134068) children aged 0 to 17 years, and approximately 100 villages
[15]. The calculated sample size was 180 households, giving a total
360 mothers/caregivers and their children calculated using a Slovin
formula to give 80% power. Simple random sampling was used to
select nine villages, which is approximately 10% of the total number of
villages in Makhuduthamaga. All villages from the municipality were
identified using a local map, numbers were assigned, and nine villages
were blindly selected. Systematic random sampling was used to select
households from the selected villages. Upon entering each village, the
first house from the point of entry or the chief’s kraal was selected and
thereafter every fifth house on alternate sides were selected. Twenty
households per village were selected until the study population of 180
was reached. From each household, one child between 1 to 12 years
was randomly selected to be part of the study group. If the household
had more than one child within the selected study age group, every
child was allocated a number and the child with the lowest allocated
number was selected. If the household had no children in that age
group, the household was skipped. The total sample was thus 180
mothers/caregivers and 180 children aged between 1 and 12 years.
Data collection:
A questionnaire was used to collect data from participants
regarding socioeconomic status and anthropometric characteristics
in their various households. The socioeconomic characteristics
collected included: age of the child; age, educational level, marital
status, employment status and income of the mother; total household
income and household income spent on food while anthropometric
parameters of both adult/caregiver and child included weight, height,
and mid upper arm circumference. The questionnaires included close
and open-ended questions, and the questionnaires were administered
by the researcher and the assistant using the local language. The length
of children less than three years who were unable to stand erect,
were measured using a height board with the caregiver supporting
the torso and legs pressed downwards and the other family member
supporting the head as the researcher took measurements. The
children were measured twice, and the average was computed. The
heights of children who were older than three years were measured
using an electronic height rod. The subject was standing erect,
looking straight ahead without tipping the head down. The top of
the ear and the outer corner of the eye were in a line parallel to the
floor (Frankfort plane).Weight was measured twice in light clothing
and barefooted using a Tanita electronic scale and the average weight
was recorded. However, in cases where the child could not stand on
the scale, the mother’s weight was taken with and without the baby,
the latter was subtracted from the former weight and the difference
was recorded as the child’s weight. The scale was calibrated daily and zeroed before collecting data on each participant [16]. The mid upper
arm circumference was measured with a measuring tape [17].
Ethical considerations:
The Higher Degrees Committee of University of Venda approved
the research proposal. An approval letter and oral permission was
received from the Municipal Manager of Makhuduthamaga Local
Municipality, and traditional authorities respectively. The study
was explained to the participants, who were then requested to fill a
consent form to be part of the research. The procedures complied
with requirements of the Declaration of Helsinki (2008).
Data analysis:
Data was entered to a Microsoft Office Excel sheet and exported
to Statistical Package for the Social Sciences (SPSS) version 20 for
data processing and analyses. Anthropometric data of children was
analysed using Z-scores and comparing it to the National Centre for
Health and Statistics (NCHS) for children above five years, and the
WHO standards was used for children under five years of age [18]. The
anthropometric indices were interpreted as stunting, (height-for-age
<-2SD) and severe stunting (height-for-age <- 3SD), wasting (weightfor-
height <-2SD), severe underweight (weight-for-height <-3SD),
and overweight (weight-for-age >2SD) using WHO classification of
malnutrition in children. Descriptive statistics were used for analysing
the socio-economic variables. The relationship between different
socio-economic variables, particularly mothers’ employment status
and nutritional status, was statistically analysed using Pearson’s Chisquare
Test. Variables were considered significant if P-values were
less than 0.05. Income is reported in South African currency rand or
ZAR.
Results
Sociodemographic characteristics:
A total number of 180 mother-child pairs participated in the
study. The sample distribution for the children were 46.1% male and
53.9% female. The minimum age of the children was 12 months, the
maximum age 142 months, while the average age was 38 months.
Regarding the caregivers’ information, 73.9% of children were taken
care of by their mothers, 23.3% by their grandmothers, and 2.8% by
other siblings or relatives. In addition, 87.2% of the caregivers were
between 20 to 59 years of age, 1.7% between 13 to 19 years, and 11.1%
greater than 60 years. Majority (53.3%) of the caregivers had high
school level of education, 20.6 % of caregivers had primary school
level, 23.9% never attended formal school, and only 2.2% obtained
tertiary level education. A caregiver was regarded as single if he/she
was unmarried or widowed, and married if he/she was married or
living together with a partner. Most caregivers (53.4%) were single,
whilst 46.7% were married.
Regarding the economic status of the households, most of the
caregivers (92.2%) were unemployed while only 7.8% were employed.
In addition, only 21.1% of fathers were employed, 24.4% unemployed,
and 54.5% of households were without fathers living with them.
More than half (53.9%) of the children were financially supported
by grandparents, 12.2% by their fathers, 9.4% by their mothers, and
7.8% by other members of family, whereas 16.7% had no financial
supporter.
Figure 1 shows that most caregivers earned less than 500
ZAR monthly and therefore lived below the poverty line, which is
estimated at 1 USD/day or R10.00/day [19]. Household additional
income was also assessed. Out of the 81.1% of households who had
an additional income, 76.7% received income from child support
grant, 1.1% received old age pensions, and 3.3% received resources
from family members. The total household income was the sum of the
income from the caregiver and additional income from other sources.
Figure 1 shows that half (50.6%) of the households had a total income
of less than 1000.00 ZAR per month per household, 35.6% had a total
income of between 1001.00 ZAR and 3000.00 ZAR. This shows very
poor households falling into the low-income group. Regarding food
purchasing power per household, the majority of caregivers (96.7%)
spent 1000.00 ZAR or less on food on a monthly basis Figure 1.
Anthropometric status of children and caregivers:
Table 1 shows the anthropometric indices of children. These have
been separated according to age starting with below 60 months and
the other above 60 months. There was a high rate of stunting at 39.6%
for children below 60 months, which is a significant health concern
since it is above 20% [20,21]. There was a low rate of wasting and
undernutrition, while the children who were overweight and obese
were 20% and 18.8% respectively.
The data shows that 16.9% of the children above 60 months were
stunted and low rate of underweight. Low overweight and obese rates
are observed in this group compared to the below 60 months old
children Table 1.
Table 2 illustrates associations between variables using the Chi
square test. Only variables which have shown significance at p<0.05
have been included. The data shows that the anthropometric indices
are associated with socio-demographic parameters that are typical for
a poor household, such as mother’s income and number of people in
the household Table 2.
Discussion
The results from the current study showed that most children
were cared for by their mothers (73.9%) or grandmothers (22.2%).
A similar care pattern was observed in the 1999 NFCS-SA wherein
63% of children were taken care of by their mothers and 21% by
grandparents. The findings are contrary to the research results by
Madhavan and Townsend which showed that high unemployment
rate push men and women to migrate to urban areas [22], leaving
children in the care of aunts and grandparents. The majority (87%)
of mothers/caretakers were between 20 to 59 years of age. This
reflected the available time and physical strength for taking care of
children. It also showed that the information given was reliable as it
was given by mature adults. Others reported that increased maternal
age may reflect the maturity and the availability of resources in terms
of money and time for rearing children [23].There were few childheaded
households.
The current findings revealed that approximately half of the
mothers/caregivers had attended high school, whilst 20.6% had
attended primary school, and 23.9% were illiterate. In addition,
maternal level of education was significantly associated with wasting
(p=0.028) and risk of underweight (p=0.000). This is because
education increases awareness and understanding of health issues,
proper hygiene practices, and financial security [23]. The results
are similar to the findings from the SADHS 2016 whereby 34% of
mothers had attended high school and 6% primary school [24].
The 2011 South African census showed that 20.9% adults above 20
years were illiterate, 21% had grade 12, while only 6.1% had tertiary
qualifications [25]. The study findings also concurred with the 1999
NFCS-SA findings, which showed that maternal education was
significantly associated with wasting and underweight in all groups
of children [26].
Approximately 92.2% of mothers were unemployed, which is higher compared to the national unemployment rate of almost 50%
and expanded the unemployment rate of 55.7% in Limpopo Province
and 51.6% in Greater Sekhukhune district [26]. Although most
(92.2%) of the mothers were unemployed, the official unemployment
rate, which is the rate of people who were actively looking for a job,
in the past four weeks prior to the study was 15%. This was lower
compared to the South African rate of 23.3% in 1999 [26].
Unsurprisingly, almost 91% of mothers had an income of less
than 500.00 ZAR per month and 33.9% of the households had a total
income of less than 1000.00 ZAR. Furthermore, maternal income was
significantly associated with stunting among children under the age
of 12 in the study area. Similar results were reported by Statistics SA
in 2005 and 2007, which showed that the majority (67%) of children in South Africa lived in households that had a monthly income of
1200.00 ZAR or less. Census 2011 showed that the average household
income was 45 977.00 ZAR [25]. These results clearly indicate that
most children lived in poor households because they lived below
the poverty line of approximately 8.00 ZAR (US $1) per person per
day, as stipulated by the World Bank. Shariff and Khor conducted a
similar study where demographic [28], socio-economic, expenditure,
and copying strategies were collected from 200 women of poor
households in Malaysia. They observed that most of the food insecure
(58%) was living below the poverty line.
The results of this study also showed that approximately 54% of
the households were financially supported by their grandparents.
This shows that the majority of households relied on pension grants as a source of income. These findings were contrary to the
findings that showed 31.25% of rural households relied on pension
as a source of income [29]. When applying the Statistics SA (2007)
recommendations of 431.00 ZAR per person per month, more than
77.3% of households were impoverished, especially taking into
consideration that more than 60% of households had 6 to 10 people
per household, this translates to 2586.00 ZAR to 4310.00 ZAR per
household per month [30].
Approximately 50.6 % of the households earned less than 1000.00
ZAR per month; this is high compared to 21% of urban households
who earned less than 1000.00 ZAR per month. This shows that the
geographic location has a close relationship with poverty, since the
wages of the employed people in rural areas tend to be too low to
support them and their families compared to urban households
[27]. The GSDM had a 77.3% rate of child poverty and only 25.5%
of children lived with employed parents, compared to a higher rate
(83%) of child poverty in Limpopo Province and only 28% of children
living with an employed parent/s [30].
Most households (75.6%) spent less than 500.00 ZAR per month
on purchasing food. The results are almost similar to findings from
Statistics SA, which showed that poorer households spent an average
of 200.00 ZAR per month on food, whilst the affluent spent 1350.00
ZAR on food, irrespective of the household size [31]. Thus, indicating
that the majority of households had low household income.
Household expenditure on food can be used as a proxy for household
income [32].
The current study showed that stunting was of high significance
for children below 60 months (39.6%). This high stunting prevalence
is likely to have serious consequences on child development, contrary
to a study by NFCHS [33], which showed an overall national, stunting
prevalence of 18% for children under 60 months. According to Dewey
and Begum there is growing evidence of the association between slow
growth in height early in life and impaired health [34], educational
and economic performance later in life. Trials in Guatemala indicated
that stunting can have long term effects on cognitive development,
school achievement, and economical productivity in adulthood and
maternal reproductive outcomes.
The current study indicated that approximately 84% of all the
children had normal weight-for-age. This implies that most children had normal weight. The study results concur with the findings by
Oldewage-Theron and Egal of a study conducted in the rural areas
of South Africa with a similar setting as that of the current study
[35]. However, approximately 11.1% and 3.9% of the children
were underweight and severely underweight respectively [35].
Furthermore, Kimani-Murage conducted a study among children
aged 1 to 14 years and revealed that the prevalence of underweight
in rural South African children was higher [36]. The difference in the
prevalence between the above-mentioned studies could have been
caused by the variation in the age group, and therefore a difference in
growth patterns would be expected.
The prevalence of wasting was low at 2.2% in children below
60 months. WHO concurs with our findings since it indicates that
provided there is no severe food shortage [37], the prevalence of
wasting is typically below 5%, even in poor countries. An equally
important fact is that approximately 57% of children in this study
group had normal weight-for-height, indicating that they were neither
under- nor over weight. The low prevalence of wasting was also found
in rural areas as reported by the SADHS 2016 and Schoeman et al.
[38]. They also reported a low (2.5%) prevalence of wasting and low
(1.3%) severe wasting [26]. However, Kimani-Murage showed a
medium prevalence of wasting at 7% for ages one to four years and 6%
for five to nine years old [34]. Remarkably, there was a 0% prevalence
of wasting in the 10 to 14 years of age category in the Kimani-Murage
study. Bhattacharya et al. indicated that nutritional outcomes among
school age children are not closely related to family resources [39].
Implying that the nutritional status of school going children might
be normal although the family is food insecure. This could be due to
children being able to supplement their food consumption at school,
friends, or at a neighbor’s home. In the case of South Africa, through
the school feeding programme.
The study findings reveal that 2.2% of children were overweight
whilst 8.9% were obese. Evidence now demonstrates that overweight
and obesity in childhood and adolescence have adverse consequences
on premature mortality and physical morbidity in adulthood [40].
The result of this study concurs with the study conducted by Kimani-
Murage [36], which showed low prevalence of overweight (7%) and
obesity (1%) respectively. In contrast, a study by Oldewage-Theron
and Egal showed a 17% prevalence of overweight and 4% obesity [34].
The head circumference for-age, computed only for children below three years of age, indicated that the majority of children had
normal brain growth/volume. Head circumference for age is also
used as a predictor of mortality, indicating that they were at the lowest
risk of mortality. Large head circumference has been associated with
conditions such as hydrocephalus and Autism Spectrum disorder,
while a small head circumference indicate microcephaly or poor brain
development which was not observed in this study population [41].
A study conducted by Bartholomeusz et al. indicated that there was
a close relationship between head circumference and brain volume
[42]. Moreover, head circumference for age is an excellent predictor
of brain volume in 1.7 to 6 years old.
The current study results are applicable to GSDM, which is
predominantly rural and underdeveloped and therefore cannot
be generalised to other areas. Measurements of socio-economic
parameters cannot rule out the possibility that the control for
socio-economic parameters was not complete (e.g. measurement of
household assets in order to determine wealth of each household).
The study only assessed the quality and not the quantity of foods
consumed. This is known to have an effect when measuring the socioeconomic
parameters such as food poverty and the nutritional status.
Conclusion
The determinants of stunting among children were
unemployment, poor purchasing power, and low household income.
Access to nutrient rich foods, health care, and nutritional health
knowledge could reduce the high prevalence of stunting among
children. In addition, empowering mothers with vocational skills
might reduce unemployment and increase the household income.
Acknowledgement
The project was funded by the South African National Research Foundation.
References
Citation
Phooko-Rabodiba DA, Tambe BA, Nesamvuni CN, Mbhenyane XG. Socioeconomic Determinants Influencing Nutritional Status of
Children in Sekhukhune District of Limpopo Province in South Africa. J Nutri Health. 2019;5(1): 7.