
Research Article
Socio-Economic Condition, Dietary Pattern and Nutritional Status of Internally Displaced Pre-School Children in Bandarban District of Bangladesh
Md Haque M1*and Islam K2
- 1Research Fellow, Bangladesh University of Professionals, Bangladesh
- 2Institute of Nutrition and Food Science, University of Dhaka, Bangladesh
*Address for Correspondence: Md Haque, Research Fellow, Bangladesh University of Professionals, Bangladesh, E-mail: monoargs@yahoo.com
Citation: Haque M, Islam K. Socio-Economic Condition, Dietary Pattern and Nutritional Status of Internally Displaced Pre-School Children in Bandarban District of Bangladesh. J Nutri Health. 2018;4(2): 6.
Copyright © 2018 Haque M, et al. This is an open access article distributed under the Creative Commons Attribution License, which permits unrestricted use, distribution, and reproduction in any medium, provided the original work is properly cited.
Journal of Nutrition and Health | ISSN: 2469-4185 | Volume: 4, Issue: 2
Submission: October 23, 2018 | Accepted: November 28, 2018 | Published: November 30, 2018
Abstract
Nutrition is a foundation to ensure good health. The geographic and demographic factors affect food and nutrition. This study focuses socio-economic condition, dietary pattern and nutritional profile of internally displaced preschool children at a single point in a specified time in sadarupazila of Bandarban district. This area was conveniently selected to collect sample. Sample was collected conveniently visiting door to door. The dietary energy intake was determined by three days 24 hours recall method. Statistical Package for Social Sciences 22.0 version was used for data analysis. Nutritional status was determined by ENA for SMART - Software. Mean age of the children was 4.10±0.84 years. Most of the parents completed primary education. Day laborand household activities were main occupation of their parents. Average monthly family income was 17515.50±10128.11BDT. Normal and underweight children were 67% and 33%. Distribution of normal and stunted children were 55% and 45%. Fifteen percent childrenwere wasted. Average calorie intake was 986.86±228.46kcal per day. Protein, carbohydrate and fat intake were 27.97±10.31 gm, 167.67±48.36 gm and 20.59±7.42 gm respectively. Positive correlation was found between nutritional status (WAZ, WHZ) of children and monthly family income. Statistically significant correlation was found between nutritional status (WHZ) of children and monthly family income (p=0.019<0.05). Statistically no significant correlation was found between nutritional status (WAZ) and daily protein intake of the children (p=0.109>0.05).Result shows positive correlation between nutritional status (WAZ) of the children and per day fat consumption. Findings of this study will be helpful for policy maker and planner to develop new plan and strategy to combat under nutrition.
Keywords
Socio-economic condition; Dietary pattern; Nutritional status; Pre-school children; Internally displaced people
Background
Children are future of a nation. Nutrition is a pre-requisite of sound health. States that child malnutrition is a wide spread and burning public health problem in the globe and it is more devastating in South-East Asia [1]. Vipin also stated that it has international consequences as because good nutrition is an important andmust needed determinant for well-being. Pre-school children are vulnerable and tend to break due to slightest stimulus and demand special care. Malnutrition in this age group will affect performance in school. Child mortality is an indicator of health and child under nutrition contributes a lot [2]. About 70% stunted under five children live in Asia [3]. Indicated that infants and preschool children are vulnerable indeed and suffer highest rates of mortality and morbidity in India [4]. Malnutrition is highly prevalent in Bangladesh. According to Bangladesh Demographic and Health Survey (BDHS,2014), 36% under five children are stunted, 33% are underweight and 14% are wasted. Evidence shows that rural children are more likely to be stunted than urban children [5]. Chittagong Hill Tract is a unique, charming and tourist friendly environment characterized by hilly and remote terrain [6]. Bandarban is a district in South-Eastern Bangladesh, and a part of the Chittagong Division [7]. It is one of the three districts that make up the Chittagong Hill Tracts [8], Bandarban (4,479 km2) is not only the remotest district of the country, but also is the least populated (population 4,04,093)(Population census, 2011). Bengalis are settling their gradually. Generally landless poor people are migrating from nearby districts.
Materials and Methods
Considering time period and resource availability, cross-sectional analytical study design was most feasible for this study. Apart from socio-economic condition, anthropometric measurement and food intake pattern of study population, information on various factors that affect the nutritional outcome was also obtained in a cross-cut way. Study duration was three years. This study was conducted at Bandarban sadar upazila. This area is purposively selected for data collection and to get adequate sample of study population. This study was carried out among pre-school children through household survey in Bandarban district. All pre-school children in both sexes with mother or caregiver were included. Those who refused to participate in interview and physically disable were excluded. We know Bandarban sadar has 5 unions and 9 wards. Settlers usually live in ward. Among 9 wards, 43 settler pre-school children werecollected from each ward (9*43=387).Actually 387 children were taken voluntarily and conveniently. Each union/ward was considered as one cluster and from each cluster sample was collected through household survey and asking people which house has 3 to 5 years children until desired number has gathered. Simple random was not possible because there was no sampling frame. Face to face interview of mother/caregiver was carried out by using pre-tested structured questionnaire. Before initiation of interview verbal and/or written consent was obtained from respondents as well as Councilor of the ward. Detail procedure of the study and significance of the study were explained followed by rapport building. The dietary energy intake of the study subjects was determined by three days 24 hour recall method questionnaire. Two consecutive days and weekend were considered. The nutrient value of Bangladeshi food was calculated by using food composition data published by Institute of Nutrition & Food Science (INFS).The standing height was measured with a stadiometer with minimal cloths. Three measurements were taken three times and if the difference among reading is less than 1 cm,the mean measurement was taken and recorded to the nearest 0.1 cm. If the reading will fall between two values, the lower reading was recorded. The body weight was measured using a platform beam scale. Weight was recorded to the nearest 0.1 kg. After collection, data were checked and rechecked thoroughly for consistency and completeness. Individual questionnaire was checked and cleaned to avoid any possible mistakes. Data were initially checked on the day of collection to exclude any error or inconsistency or incompleteness. Data were categorized and coded during entry into the SPSS software. After every two weeks interval data were submitted to supervisor for check. It was started by the participant identification number and other properties of the variables. Then specific value was entered into each variable for each independent source of data. Data were cleaned by detection and correction of data set. Data were analyzed by computer technology SPSS version 22.0. ENA for SMART- Software. Nutritional assessment was used to find out WAZ (Weight for age Z-score), HAZ (Height for age Z-score) and WHZ (Weight for height Z-score). WHO child growth standard 2005 was used as reference for Z-score value. Obtained information was presented in the form of tables and graphs. Both descriptive statistics and inferential statistics were done. Before parametric test, normality test like histogram with normal curve, skewness and kurtosis were done to see whether data were normally distributed or not.
Results
Socio-economic profile
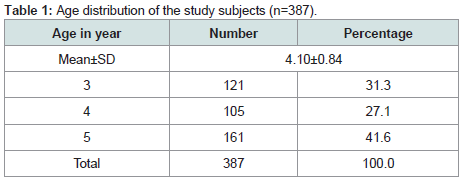
Average age of the study subjects was 4.10±0.84 years. Big portion of children (41.6%) represented 5 years age followed by 31.3% from 3 years and 27.1% from 4 years Table 1.
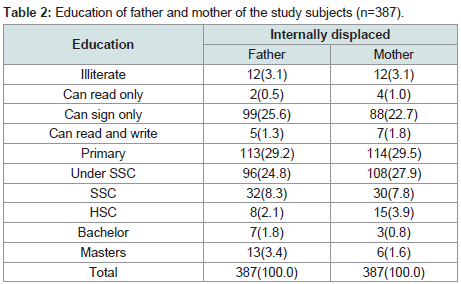
Most of the father and mother (29.2% and 29.5%) completed primary education followed by can sign only (25.6% and 22.7%), under SSC (24.8% and 27.9%) and SSC (8.3% and 7.8%) Table 2.
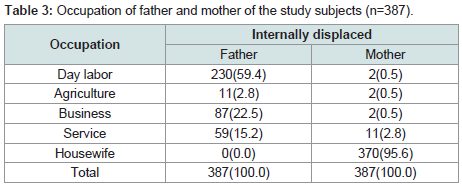
More than half (59.4%) children’s fathers were day labor. Most of the children’s mother (95.6%) were housewife Table 3.
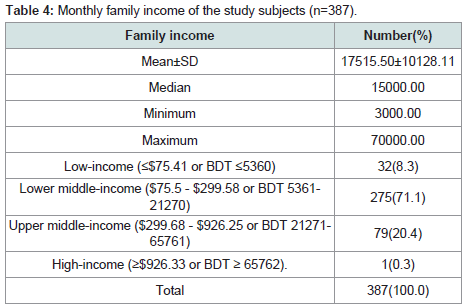
Average monthly family income was17515.50±10128.11 BDT whereas median income was well high among settler (15000 BDT) than ethnic (4000 BDT). About 8.3% family had low income followed by 33.6% lower middle-income family and 20.4% upper middleincome family Table 4.
Nutritional status
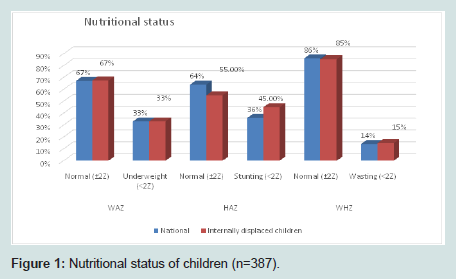
Prevalence of underweight was 33% which was similar to national figure. In case of stunting prevalence was 45% which was much higher than national data (36%). Wasting was quite similar with national figure i.e. 14% and 15% Figure 1.
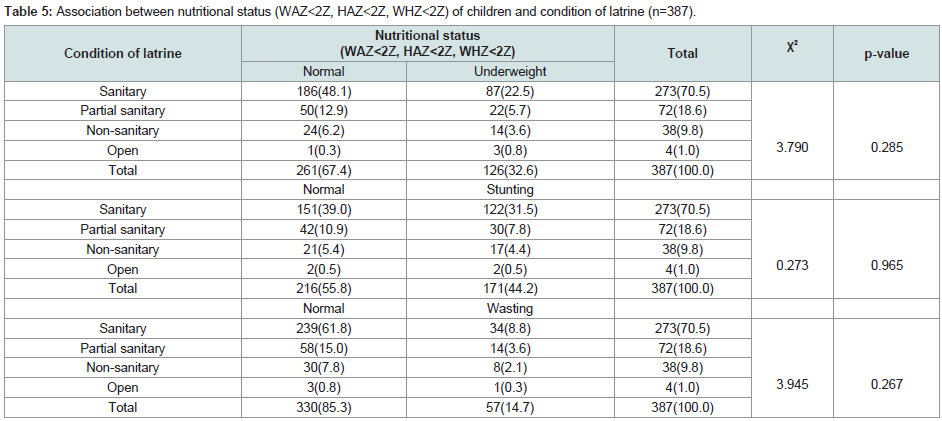
The table showed no statistically significant association was found between condition of latrine and children nutritional status (WAZ, HAZ, WHZ) (p=0.790>0.05), p=0.273>0.05, p=3.945>0.05) Table 5.
The table showed association between nutritional status of children and source of drinking water. No statistically significant association was found between source of drinking water and children nutritional status (WAZ, HAZ, WHZ) (p=1.702>0.05), p=4.571>0.05, p=1.796>0.05) Table 6.
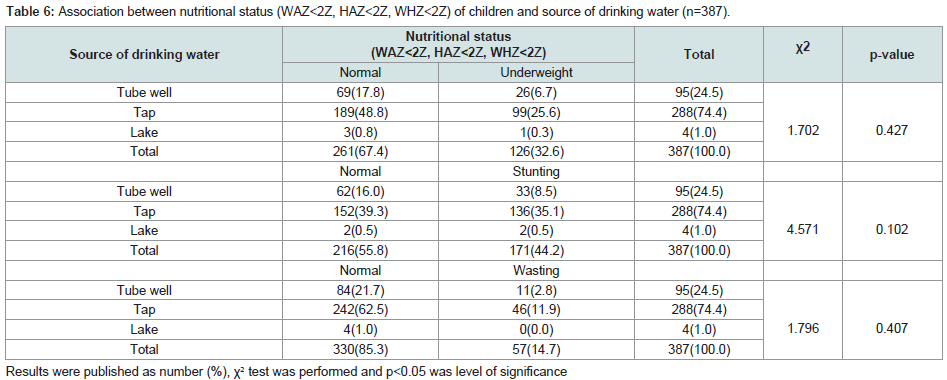
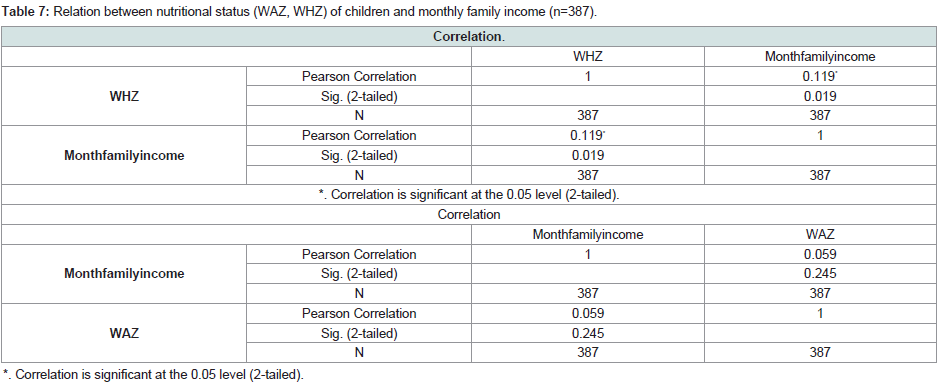
Table shows positive correlation between nutritional status (WAZ,WHZ) of children and monthly family income. Statistically significant correlation was found between nutritional status (WHZ) of children and monthly family income (p=0.019<0.05).So we can say that monthly family income influences settlers children nutritional status (WHZ) Table 7.
Nutrient intake
Average energy intake was 986.86 kcal per day per child. Protein, carbohydrate and fat intake were 27.97 gm, 167.67 gm and 20.59 gm respectively Table 8.
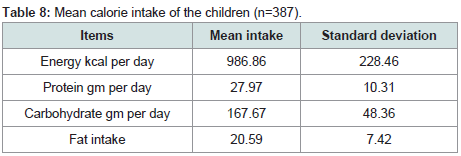
Table shows positive correlation between nutritional status (WAZ) of the settler children and per day protein consumption. Statistically no significant correlation was found between nutritional status (WAZ) and daily protein intake of the settler children (p=0.109>0.05) Table 9.
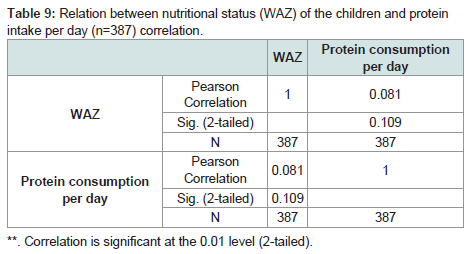
Table shows positive correlation between nutritional status (WAZ) of the settler children and per day fat consumption. Statistically no significant correlation was found between nutritional status (WAZ) and daily fat intake of the settler children (p=0.692>0.05) Table 10.
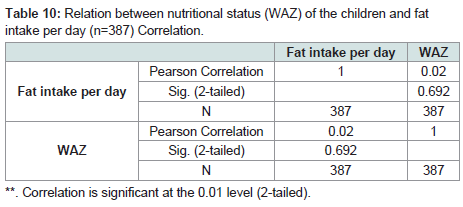
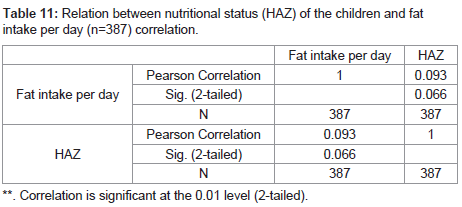
Table shows positive correlation between nutritional status (HAZ) of the settler children and per day fat consumption. Statistically no significant correlation was found between nutritional status (HAZ) and daily fat intake of the settler children (p=0.066>0.05) Table 11.
Discussion
Non-communicable diseases are increasing all over the world. No part of the globe is immune; more vivid and devastating scenario is seen in South-East Asia. Malnutrition is the root cause behind any type of non-communicable diseases. Faulty food habit as well as sedentary life style and technology dependency make this scenario more vivid. So improvement of diet and nutritional status are necessary from the very beginning of life. If we want to decrease burden of noncommunicable diseases we can initiate or introduce healthy diets or nutrition dense food and active physical work according to lifestyle [9]. To ensure quality diet for individual or population group we must emphasize agriculture and food sector. Food security at household level has closed link with child nutrition [10,11]. The purpose of the present study was to pick up socio-economic condition, dietary pattern and nutritional status of internally displaced pre-school children in a cross cut way in sadarupazila of Bandarban district of Bangladesh. Due to displacement, nutritional status may be different though they reside in same geographical location. According to WHO nutritional status was determined by measuring height, weight and Z- scores. Here cut off point for Z score was taken as -2SD and those find below this level were considered as stunted, underweight and wasted as well. Bangladesh Demographic and Health Survey showed that normal and underweight children were 67% and 33%. The present study found same figure. Here displaced children are carrying same feature as rest of the part of the country. Recent report suggests that underweight children in Chittagong Hill Tract is 43% (The Daily ProthomAlo, 2017) though this survey was done among 0 to 23 months children but this figure is much higher than national data [12]. This report also mentioned that children nutritional scenario is worst in Bandarban district among three districts of CHT. Nationally normal and stunted children were 64% and 36% 13 whereas 55.0% and 45.0% children were stunted in the current study [13]. In case of wasting, 14%and 15.0% were wasted in nationally and resent study respectively. Considering all parameters nutritional status of displaced children was alarming. Stunting and wasting are the real threat for their health condition. Nationally stunting scenario is not improving and more or less remains static. Environmental factors may contribute high rates of stunting. Actually, stunting is a chronic condition resulting from under nutrition. Stunting scenario is not improving along with speed of underweight and wasting. Large scale or depth study both quantitative as well as qualitative nature can be conducted to find out root causes, underlying causes and immediate causes of stunting. Children living in the coastal and wetland (haor) regions in Bangladesh are 1.5 times more likely to be stunted - one of the findings from a study conducted by LANSA, led by BRAC (https://newshour.online/2018/07/26). The study explores agricultural innovations to fight malnutrition in Bangladesh. The study identified haors and the coastal belt in Bangladesh, which are geographically distinct from other parts (waterlogged and salinity affected areas, respectively), as pockets of under nutrition. Analysis showed that overall prevalence of stunting ranged from 46.6% in the haor basin to 30.9% in other parts of Bangladesh, whereas the prevalence of underweight ranged from 44.5% in the haor basin to 34.1% in other areas (https://newshour.online/2018/07/26). This is a serious cause of concern for the country. Research revealed there is a strong interrelation between crop diversity, diet diversity and nutritional outcomes. It was found that the number of people with malnutrition will decrease if we increase production of diet-diverse and nutrition-rich food items (Research revealed there is a strong interrelation between crop diversity, diet diversity and nutritional outcomes. It was found that the number of people with malnutrition will decrease if we increase production of diet-diverse and nutritionrich food items (https://newshour.online/2018/07/26). Just couple of months back honorable health minister of Go B stated in National Nutrition Week 2018 that prevalence of underweight, stunting and wasting of under five children were 32.4%, 36.1% and 14.33%. This is a big ask for policy planners [14]. Karim and Khan (2004) found that under nutrition was high in their study and about half of the children (49%) of were underweight followed by 43% stunted and 20% wasted. Similar type of study done by Ahmed, Jahan and Arefin in 1995-96 13 and found higher number of under nutrition among children i.e. 64.2% underweight, 60.4% stunted and 17% wasted which was much higher than national surveys [15]. Another study was conducted in all over Bangladesh and showed that 9.3% severe underweight and 31.4% moderate underweight of Khulna division, 12.9% severe underweight and 32.8% moderate underweight of Chittagong division, 11.1% severe underweight and 35.2% moderate underweight of Dhaka division, 12.8% severe underweight and 35.1% moderate underweight of Rajshahi division, 16.0% Severe underweight and 33.6% moderate underweight of Barisal division and 17.5% Severe underweight and 38.0% moderate underweight of Sylhet division (Rahman, et al. 2008). Document indicates that 3 years, 4 years and 5 years children recommended to consume 1410 calorie (boy), 1140 calorie (girl); 1560 calorie (boy), 1310 calorie girl); 1690 calorie (boy), 1540 calorie (girl) respectively. But children of this study consumed well below than the recommended allowance. Due to inadequate dietary intake than the recommended level may be responsible for wide prevalence of undernourished children. Not only dietary but also environmental factors are contributing in growth pattern variation between children of both developed and developing countries [16-18]. Supplementary feeding programmers and food security can solve this problem. Socioeconomic profile is considered as strong determinant of nutritional status. Poverty is the root cause of all types of under nutrition. Poverty and under nutrition are interlinked. This study found that most of the parents passed primary level education. Father of the children was day labor and mothers were housewife [19].
Conclusion
This study concludes that prevalence of under nutrition among internally displaced pre-school children in sadarupazila, Bandarban of Bangladesh was not so good rather still quite high and a burning public health issue which demands urgent attention and intervention
References
- Chandran KP (2009) Nutritional Status of Preschool Children: A Socio-Economic Study of Rural Areas of Kasaragod District in Kerala. Abstract of PhD thesis. Kannur University.
- Nordqvist C (2016) Malnutrition: Causes, Symptoms and Treatments. Medical News Today.
- Allen LH, Gillespie SR (2001) A review of the efficiency and effectiveness of nutrition interventions. United Nations Administrative Committee on Coordination/Sub-Committee on nutrition (ACC/SCN). Asian Development Bank (ADB), Geneva 5: 24-25.
- Gupta VM, Shukla KK (1992) Epidemiological correlates of protein energy malnutrition in preschool children. Indian J Prev Soc Med 23: 26-32.
- Malawi Demographic and health survey (2010) National Statistical Office (NSO) Malawi & ORC Macro.
- Heitzman J, Worden R (1989) Bangladesh: A Country Study. Washington: GPO for the Library of Congress.
- Atikur R (2012) “Bandarban District”. In: Islam, Sirajul, Jamal, Ahmed A. Banglapedia: National Encyclopedia of Bangladesh (2nd edn). Asiatic Society of Bangladesh.
- Quader SC (2012) Chittagong Hill Tracts. In Islam, Sirajul; Jamal, Ahmed, A. Banglapedia: National Encyclopedia of Bangladesh (2nd Edn). Asiatic Society of Bangladesh.
- Haque MM, Hassan MA, Islam K, Bhuiyan MR, Shahi MSJR, et al. (2014) Diet Intake Pattern and Nutritional Status of Rural Population in Bangladesh. CMOSHMCJ 13: 51-54.
- Saha KK, Frongillo EA, Alam DS, Arifeen SE, Persson LA, et al. (2009) Household food security is associated with growth of infants and young children in rural Bangladesh. Public Health Nutr 12: 1556-1562.
- Hackett M, Quinonez HM, Alvarez MC (2009) Household food security associated with stunting and underweight among preschool children in Antioquia, Colombia. Pan Am J Public Health 26: 506-510.
- Renzaho AM, Burns C (2006) Post-migration food habits of sub-Saharan African migrants in Victoria: A cross-sectional study. Nutrition Dietetics 63: 91-102.
- (2014) Bangladesh Demographic and Health Survey.
- (2018) Malnutrition higher in coastal and haor areas, households have 16% less income.
- Ahmed SS, Jahan K, Arefin S (2005) Nutritional Status of Under Six Children in Bangladesh: Evidence Based from Nutrition Survey of Bangladesh, 1995- 96. Jalalabad Med J 2: 17-19.
- Chandrasekhar U, Kowsalya S, Sinha S (1997) Nutritional status of selected Oraon tribes of Bihar. Ind J Nutri Dietet 34: 264-269.
- Serenius F (1988) Attained growth of privileged Saudi children during the first three years of life. A Acta Paediatr Scand Suppl 1346: 80-92
- Dugdale AE, Muller M, Alsop-Shields L (1994) Patterns of weight growth in Aboriginal children on Queensland communities. J Pediatr Child Health 30: 55-58.
- http://www.medicalnewstodayarticles/179316.