
Journal of Hematology & Thrombosis
Download PDF
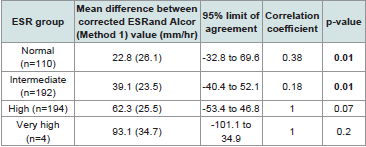 Table 1:Comparison of Corrected Manual ESR and Alcor (Method 1) ESR: Mean
Difference, 95% Limits of Agreement, and Correlation Coefficient
Table 1:Comparison of Corrected Manual ESR and Alcor (Method 1) ESR: Mean
Difference, 95% Limits of Agreement, and Correlation Coefficient
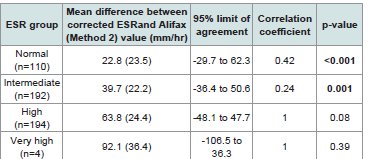 Table 2:Comparison of Corrected Manual ESR and Alifax (Method 2) ESR:
Mean Difference, 95% Limits of Agreement, and Correlation Coefficient
Table 2:Comparison of Corrected Manual ESR and Alifax (Method 2) ESR:
Mean Difference, 95% Limits of Agreement, and Correlation Coefficient
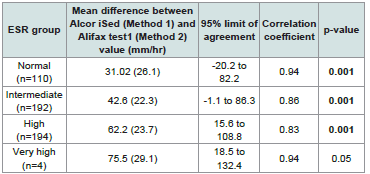 Table 3:Comparison of AlcoriSed (Method 1) and Alifax test1 (Method 2) ESR:
Mean Difference, 95% Limits of Agreement, and Correlation Coefficient
Table 3:Comparison of AlcoriSed (Method 1) and Alifax test1 (Method 2) ESR:
Mean Difference, 95% Limits of Agreement, and Correlation Coefficient
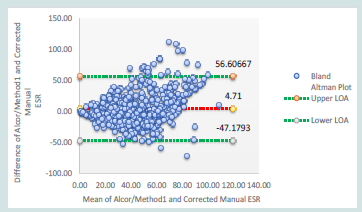 Figure 1:Bland-Altman Analysis of Alcor (Method 1) ESR vs. Corrected
ESR: Mean Difference = 4.71, 95% Limits of Agreement (-47.1 to 56.6).
Figure 1:Bland-Altman Analysis of Alcor (Method 1) ESR vs. Corrected
ESR: Mean Difference = 4.71, 95% Limits of Agreement (-47.1 to 56.6).
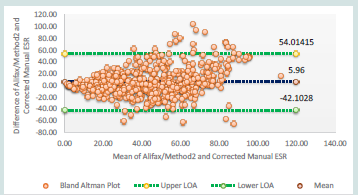 Figure 2:Bland-Altman Analysis of Alifax (Method 2) ESR vs. Corrected
ESR: Mean Difference = 5.96, 95% Limits of Agreement (-42.1 to 54.01).
Figure 2:Bland-Altman Analysis of Alifax (Method 2) ESR vs. Corrected
ESR: Mean Difference = 5.96, 95% Limits of Agreement (-42.1 to 54.01).
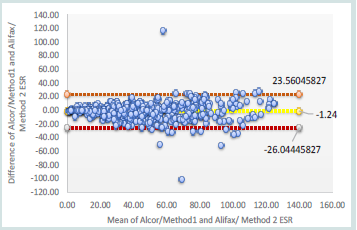 Figure 3:Bland-Altman Analysis of Alcor (Method 1) vs Alifax (Method 2)
ESR: Mean Difference = -1.24, 95% Limits of Agreement (-26.04 to 23.56).
Figure 3:Bland-Altman Analysis of Alcor (Method 1) vs Alifax (Method 2)
ESR: Mean Difference = -1.24, 95% Limits of Agreement (-26.04 to 23.56).
Research Article
Understanding Variation in the Value of Esr in Anaemic Patients Using Different Automated Analysers And Its Comparison With Gold Standard Westergren Method
Hidangmayum A, Gupta A*, Lal SK, Bhardwaj S, Singh KK and Jaine NS
National Reference Laboratory, Dr Lal Path labs, Rohini, New Delhi, India
*Address for Correspondence:Gupta A, National Reference Laboratory, Dr Lal Path labs, Rohini,
New Delhi, India. E-mail Id: ajay.gupta@lalpathlabs.com
Submission:20 May, 2025
Accepted: 06 June, 2025
Published:10 June, 2025
Copyright: ©2025 Hidangmayum A, et al. This is an open access article
distributed under the Creative Commons Attribution License, which
permits unrestricted use, distribution, and reproduction in any medium,
provided the original work is properly cited.
Keywords:Automated ESR Analysers; Manual Westergren ESR; Fabry’s
Formula; Hematocrit; Anaemia
Abstract
This study was conducted on 500 samples in the Department of
Haematology, Dr Lal path labs, National Reference Laboratory, Rohini,
Delhi, to analyse the variation in the value of ESR in anaemic patients using
different automated analysers and its comparison with gold standard,
Westergren method. Samples with Hb < 11gm% and hct < 35% were
included in the study, these samples were initially analysed in automated
ESR analysers- AlcoriSed as (method 1) and then in Alifax test1 analyser as
(method 2) and subsequently by the manual Westergren method. Fabry’s
formula was used to correct the Westergren ESR.
The observed ESR was graded as normal (n=110), Intermediate (n=192), High (n=194) and very high (n=4). The mean difference between corrected ESR and Alcor iSed(Method 1) for normal, intermediate, high and very high was 22.8, 39.1,62.3 and 93.1 mm/hr respectively. Bland Altman analysis of Alcor iSed and the Westergren method show wide limits of agreement (LOA) range from -47.2 mm/hr to +56.6 mm/hr, between the two methods, particularly at higher ESR values. The comparison between Alifax test 1 and the Westergren method observed a mean difference with LOA of 22.8 (-29.7 to 62.3),39.7 (-36.4 to 50.6), 63.8 (-48.1 to 47.7) and 92.1 (-106.5 to 36.3)mm/hr respectively for normal intermediate high and very high ESR. Bland Altman analysis of the same observed a mean difference (bias) of 5.96 mm/hr with LOA ranging from -42.1 mm/hr to +54.0 mm/hr, indicating a considerable spread in differences. The mean difference (bias) between the two automated analysers of -1.24 mm/hr suggests a slight difference in estimation of ESR values by the Alcor iSed compared to the Alifax test1.
In referral laboratories with copious sample loads, the automated ESR analysers can safely replace the Westergren method for normal to intermediate ESR values in anaemic patients. The result deteriorates as ESR values increase (>100mm/hr) leading to greater variability and reduced correlation in the high and very high ESR.
In anaemic patients with high ESR (>100mm/hr), confirmation and verification by the standard Westergren method may be required.
Introduction
Erythrocyte Sedimentation Rate (ESR) was first reported in 1894
by Dr Edmund Biernacki, independently thereafter by Hirszfeld,
Fåhraeus, and Sir Westergeren who popularized the parameter[1].
It evaluates the length of red blood cells falling in millimetres in a
vertical column after one hour of standing and measures all three
stages of sedimentation [2]. Though debated, it is one of the frequently
used laboratory parameters for inflammatory conditions like giant
cell arteritis, rheumatic arthritis, polymyalgia and other connective
tissue disorders, infection, trauma and malignant pathologies [3].
Furthermore, ESR is considered one of the prognostic markers for
disease relapse in post-chemotherapy Hodgkin Lymphoma [4].
Since its discovery, ESR was measured using the manual Westergren
method, expressed as mm/1st hour, gradually being replaced by
automated analysers with the advent of technology.
The Working Group by ICSH classifies the techniques of ESR
estimation into three groups - Manual Westergren method, Modified
Westergren method and alternate ESR method [5]. The Westergren
method of ESR estimation is recommended as a gold standard method
by the International Council for Standardization in Hematology
(ICSH) [6,7]. With the revolution in technology, most laboratories
have replaced the traditional Westergren method with automation
given higher throughput, safety, negligible biohazard risk and a short
processing duration. According to the ICSH global survey in 2019
by the ICSH, 28% of laboratories still use the Westergren method,
while 72% of laboratories use modified Westergren or alternate
methods [8]. The modified Westergren method delivers the measure
of sedimentation within a brief duration of 20 to 30 minutes. On the
other hand, alternate methods exploit the rouleaux formation using
techniques such as photometric rheology [9] capillary photometrickinetic
technology 10 or centrifugation [11]. Results from these
approaches can differ significantly from observations obtained with
the Westergren method and from each other. ICSH recommends
that all new technologies, instruments, or methodologies
be evaluated against the Westergren reference method before being introduced
into clinical use [5]. Also, it was recommended that the “systems
which give the results same as the Westergren method with diluted
blood at 60 minutes or normalized to 60 minutes are the only ones of
clinical value” [7].
Alcor iSed is an automated analyser based on alternate
Westergren- Advanced Rheology Technology that measures the
“earliest and most critical phase”- Rouleau formation. This technology
directly measures the aggregation of RBCs and determines the length
at which the red cells will sediment in the Westergren tube. Alcor
iSed draws 100μL volume and can produce a result in as little as 20
seconds with an analytical range of 2-130mm/hr [12], On the other
hand, Alifax test 1 is a closed system alternate ESR analyser based
on the photometric method. The blood samples are mixed slowly
for 120 seconds and then 150 μL of blood samples transferred to the
capillaries, and are measured photometrically at 950 nm wavelength.
Its analytical range is 2-120mm/hr. Since ESR performed by the
manual standard Westergren method is also affected by haematocrit.
Fabry’s formula (Westergren ESR X 15/55-HCT) can be used to
correct ESR values obtained by the manual method [13].
The normal range of ESR ranges in adults from 2 to 20 mm/hour
[5]. In clinical scenarios, ESR depends mainly on the haematocrit
levels and plasma protein concentrate besides many other interfering
factors. Many studies have been conducted to understand the role
of plasma proteins as an index of inflammation. Also, a few studies
have been conducted to compare two methods of ESR estimation
using alternate analysers and the manual Westergren method in
two different sites/institutes. In this study, we analyse the difference
between the automated ESR analysers- Alcor iSed, Alifax test 1 with
the manualWestergren method, corrected by Fabry’s formula for the
entire range of ESR amongst anaemic patients in a single stand-alone
referral laboratory in Delhi.
Materials and Method
Sample collection:
This study was conducted at Dr Lal path labs, National Reference
Laboratory, Rohini Delhi. Sample size was calculated under 95%
confidence limit using the formula, n=4s2/d2 where s=mean and
d= margin of error. Based on earlier result of similar study14 with
mean= 21.3, margin of error as 2, a sample size of 454 was obtained.
However, to get an optimal result, a sample of 500 was taken for the
study. 500 random samples with haemoglobin less than 11gm%
and HCT<35% and an adequate volume sent to the Department
of Haematology for routine tests were collected after the routine tests
had been performed. Samples were initially analysed in automated
ESR analysers- AlcoriSed as method 1 and then in Alifax test1
analysers as method 2 and subsequently by the manual Westergren
method using Westergren pipette. For manual estimation of ESR,
the EDTA samples were diluted as per the guidelines by the ICSH
in the ratio of 4:1 of blood and 3.8 % trisodium citrate dihydrate,
mixed and then filled into the Westergren tubes. Samples were placed
vertically in the tube holder at room temperature in an area free from
vibration. Erythrocyte sedimentation was visually read and recorded
as an absolute number after 1 hour of being laid. The manual
Westergren values were corrected using Fabry’s formula for low
hematocrit (Westergren ESR X 15/55-HCT). The results were further
categorized into four groups in this study as value up to 20 mm/hour
as normal and increased ESR (20 mm/hour and above) were further
sub categorised into intermediate (ESR: 20 to less than 50mm/hour);
high (ESR: 50 to less than 100 mm/hr) and very high (ESR greater
than or equal 100 mm/hr). Any degenerated samples and inadequate
samples were excluded from the study.
Statistical Analysis:
Data were described in terms of range, mean ± standard deviation
(SD), frequencies (number of cases), and relative frequencies
(percentages) as appropriate. All the entries were entered in a
Microsoft Excel sheet. Simultaneous comparison of Alcor iSed with
the corrected manual ESR and Alifax test1 was done using Bland-
Altman plots. 95% limits of agreement were calculated as d ± 1.96
SD, where d = mean difference between the two measurements and
SD = standard deviation of differences. Pearson correlation was used
to find the correlation among various parameters. A probability value
(p-value) less than 0.05 was considered statistically significant. SPSS
software version 21.0 was used for statiscal analysis.
Results
This study conducted on 500 samples with anaemia with Hb
< 11% and that of hct < 35% reveals a mean (SD) age of the study
participants of 53.3 (±18.1) with a minimum of one year and a
maximum of 91 years. A higher proportion of female participants
(67.6%), compared to male participants (32.4%) was observed.
The haematological parameters exhibited considerable variation
across the sample. The mean haemoglobin (Hb) level is 9.4g/dL with
a standard deviation (SD) of 1.3, ranging from 3.5 to 10.9 g/dL. Mean
haematocrit (Hct) levels were 29.3% (SD = 4.2), spanning from 12.9%
to 35%. The mean corpuscular volume (MCV) has a mean of 81.6 fL
(SD = 12.6),ranging between 48.7 and 134.9 fl, highlighting diverse
erythrocyte sizes within the population.
In the normal ESR group, comparison of the two automated
analysers (Alcor iSed and Alifax test 1) had the same mean difference
of 22.9mm/hr with the corrected ESR under 95% confidence limit
[Table 1,2] . Amidst the two automated analysers. a statistically
significant correlation with a mean difference of 31.02 mm/hr was
observed. In the intermediate ESR group, a mean difference of
31.9 mm/hr between Alcor iSed and the corrected ESR; 39.7 mm/
hr between Alifax test1 and the corrected ESR was observed. A
considerable variability suggested by the wide limit of agreement
(LOA) in both the automated analysers- Alcor iSed ranging from -40.4
to 52.1 mm/hr along with a correlation coefficient of 0.18 (p = 0.01),
and alifax test1 from -36.4 to 50.6 mm/hr and a lower correlation of
0.24 (p = 0.001) implied a weaker agreement was agreement between
automated analysers and the manual method. However, amongst the
two analysers, the mean difference was 42.6 mm/hr with limits of -1.1
to 86.3, a correlation coefficient of 0.86, and a significant p-value of
0.001.
The comparison between Alcor iSed and the manual method
in the high ESR group(n=194) exhibited a mean difference of 62.3
mm/hr, with a wide LOA (-53.4 to 46.8 mm/hr) and a correlation
coefficient of 1, statistically not significant (p = 0.07). Between Alifax
test1 and the manual Westergren method, the high ESR group
showed an even greater mean difference of 63.8 mm/hr, but the LOA
(-48.1 to 47.7 mm/hr) suggested a wide variation, and the correlation
drops to 1, statistically insignificant, p-value (0.08). Between the two
automated analysers, a statistically significant p=0.001, with a mean
difference was 62.2 mm/hr, and 95% limit of agreement from 15.6 to
108.8, a correlation coefficient of 0.83 was observed [Table 3] .
Whereas the very high ESR group (n=4) demonstrated the largest
mean difference of 93.1 mm/hr, with an LOA ranging from -101.1 to
34.9 mm/hr, a correlation coefficient of 1, and statistically insignificant
(p = 0.2) between Alcor iSed and the westergren method. Similarly, a
mean difference of 92.1 mm/hr, with an extremely wide LOA (-106.5
to 36.3 mm/hr), between Alifax test1 and the manual westergren
method indicating poor agreement, a correlation coefficient of 1
with a non-significant p-value (0.39). Between the two automated
analysers,the mean difference was 75.5 mm/hr, with limits ranging
from 18.5 to 132.4, a correlation coefficient of 0.94, and a p-value
of 0.05. Four entries went beyond the analytical range of Alcor iSed
as compared to five entries in Alifax test1. These findings suggest
that the agreement between automated analysers and corrected ESR
is relatively better at lower ESR levels, it deteriorates as ESR values
increase, leading to greater variability and reduced correlation in the
high and very high ESR ranges.
The Bland-Altman plot assessment between Alcor iSed and the
westergren method observed a mean difference (bias) of 4.71 mm/hr
suggesting an overestimation by this automated method slightly than
the manual method as compared to the mean difference (bias) of 5.96
mm/hr between the Alcor iSed and the manual Westergren method.
A poor correlation exists when ESR increases beyond 100mm/hr in
anaemia between the automated analysers and the manual method. A
few outliers fall beyond the LOA, further highlighting inconsistencies.
[Figure 1].
The Bland-Altman plot of Alifax test 1 and the manual
Westergen method observed a LOA ranging from -42.1 mm/hr to
+54.0 mm/hr, with a considerable spread in differences, suggesting
reduced agreement between the methods as ESR levels rise. Some
outliers exceed the LOA, emphasizing further inconsistencies.
Although the overall bias is small, the broad LOA indicates limited
interchangeability between the two methods, particularly in higher
ESR ranges where variability is more pronounced [Figure 2]. The
mean difference (bias) between the two automated analysers of -1.24
mm/hr suggests a minimal difference in estimation of ESR values by
the Alcori Sed compared to the Alifax test1. The comparison of the
two automated analysers by Bland Altman is plotted in [Figure 3].
Discussion
The distribution of age groups among the study participants
revealed that the majority fall within the 61-70 years category (19.2%)
a significant representation of older and middle-aged adults. Younger
individuals and the paediatric population are less represented, with
only 7.2% in the 21-30 years category and 3.4% under 20 years. This
trend may be possibly due to the use of CRP instead of ESR as a
marker of inflammation in the paediatric population [15].
The female participants (67.6%), accounted for two third of
the study population, indicating a significant gender disparity,
with females making up more than two-thirds of the total sample,
similar to a study by Cennamo et al [16].This is probably due to the
inclusion criteria of samples of the study as anaemia is known to be
more prevalent among females. As per the latest release by WHO on
Feb 2025 and the Global health metrics, “An estimated 106 million
women and 103 million children affected by anaemia in Africa and
244 million women and 83 million children affected in South-East
Asia. With women contributing more than male [17].
This study also observed the difference between corrected ESR
and ESR analysed by automated analysers increased as the ESR value
increases. A greater variability between the corrected Westergren
ESR and the two automated analysers value was observed as the value
of ESR increased. This is in concordance with a study by Narang et
al [10]. Sonmez et al [14]. Hence, Fabry’s formula was applied to
correct the overestimation. Fabry’s formula corrected the ESR value
in the low and intermediate range, however, a persistent significant
difference was observed for high and very high ESR ranges.
For all the range of ESR, the agreement between the two
automated analysers- Alcor iSed, Alifax test1 in comparison with
the gold standard westergren method was relatively better at lower
ESR levels, deteriorated as ESR values increased, leading to greater
variability and reduced correlation in the high and very high ESR
ranges. This weakens agreement of the two automated analysers with
the manual Westergren highlighted a greater variability and poorer
correlation, making the two methods less interchangeable in high
ESR group. These findings are concordant with Sonmez et al [14] that
found a poor correlation between the automated analyser and manual
methods at high ESR values (p > 0.10). Dhruva et al [18] also observed
that samples with high ESR values vary considerably around the mean
difference compared with samples that had normal
ESR readings.
Subramaniam et al [19] observed a wide LOA (between –57.3 to
30.5 for high values) and a narrow LOA (–18.9 to 3.5 for normal ESR)
while comparing automated instrument MONITOR 100 from Electa
Laboratory Italy and the manual method. Likewise, Alfadhli et al
[20] showed low agreement between the automated and Westergren
methods at the higher ESR values as compared with normal
ranges.
They also reported that for samples with ESR readings > 25 mm/hr (n = 81), the mean of difference (–21.4) and the 95% limits of agreement (–45.2 and 2.26) were markedly different from the corresponding values (–3.9, –13.5 and 5.7, respectively) for samples with ESR values < 25 mm/h (n = 69).
They also reported that for samples with ESR readings > 25 mm/hr (n = 81), the mean of difference (–21.4) and the 95% limits of agreement (–45.2 and 2.26) were markedly different from the corresponding values (–3.9, –13.5 and 5.7, respectively) for samples with ESR values < 25 mm/h (n = 69).
Anaemia and low haematocrit do impact the ESR values of
different automated analysers for all the ranges of ESR. Bland and
Altman analysis of the two automated analysers with the manual
Westergren method showed a poor correlation of the ESR in anaemic patients at high ESR (>100mm/hr). There is a better agreement in the low and intermediate ESR ranges, with differences clustering around the mean, the scatter increases significantly at higher ESR values, suggesting poor correlation in this range. A few outliers fall beyond the LOA, further highlighting inconsistencies.
Westergren method showed a poor correlation of the ESR in anaemic patients at high ESR (>100mm/hr). There is a better agreement in the low and intermediate ESR ranges, with differences clustering around the mean, the scatter increases significantly at higher ESR values, suggesting poor correlation in this range. A few outliers fall beyond the LOA, further highlighting inconsistencies.
Conclusion
In large referral laboratories with copious sample loads, the
automated ESR analysers can safely replace the Westergren method
for normal to intermediate ESR values in patients with low hematocrit.
However, in anaemic patients with higher ESR(>100mm/hr), the result may require confirmation and verification by the standard Westergren method with correction using Fabry’s formula. A simple step of double checking automated ESR readings with the manual westergren method, corrected by Fabry’s formula would be worthwhile, and ensure a superior, trustworthy quality report.
However, in anaemic patients with higher ESR(>100mm/hr), the result may require confirmation and verification by the standard Westergren method with correction using Fabry’s formula. A simple step of double checking automated ESR readings with the manual westergren method, corrected by Fabry’s formula would be worthwhile, and ensure a superior, trustworthy quality report.
Limitation of the study:
The samples were procured after the routine tests had been
performed. Most cases of severe anaemia were excluded from the
study due to inadequacy of sample volume and to avoid prolonged
storage of sample that may impact the result of the study.
References
Citation
Hidangmayum A, Gupta A, Lal SK, Bhardwaj S, Singh KK, et al. Understanding Variation in the Value of Esr in Anaemic Patients Using Different Automated Analysers And Its Comparison With Gold Standard Westergren Method. J Hematol Thromb 2025;7(1): 5.