
Research Article
*Address for Correspondence: Veronica Southard, Department of Physical Therapy, School of Health Professions NYIT Building 500, Room 501, Old Westbury, New York 11568, USA, Tel: 516 686 7671; Fax: 516 628 2154; E-mail: vsouthar@nyit.edu
Citation: Southard V, De Francisco-Donoghue J. The 6MWT: Validity of a Pedometer and Instruction on 15m and 30m Courses in Adults with Parkinson‘s Disease. J Geriatrics Palliative Care 2014;2(2): 4.
The 6MWT: Validity of a Pedometer and Instruction on 15m and 30m Courses in Adults with Parkinson‘s Disease
Veronica Southard1* and Joanne DeFrancisco Donoghue2
- 1Department of Physical Therapy, School of Health Professions, New York Institute of Technology, USA
- 2Department of Physical Therapy, School of Osteopathic Medicine, New York Institute of Technology, USA
*Address for Correspondence: Veronica Southard, Department of Physical Therapy, School of Health Professions NYIT Building 500, Room 501, Old Westbury, New York 11568, USA, Tel: 516 686 7671; Fax: 516 628 2154; E-mail: vsouthar@nyit.edu
Citation: Southard V, De Francisco-Donoghue J. The 6MWT: Validity of a Pedometer and Instruction on 15m and 30m Courses in Adults with Parkinson‘s Disease. J Geriatrics Palliative Care 2014;2(2): 4.
Copyright © 2014 Southard et al. This is an open access article distributed under the Creative Commons Attribution License, which permits unrestricted use,distribution, and reproduction in any medium, provided the original work is properly cited.
Journal of Geriatrics and Palliative Care | ISSN: 2373-1133 | Volume: 2, Issue: 2
Submission: 03 April 2014| Accepted: 02 June 2014 | Published: 09 June 2014
Reviewed & Approved by: Dr. Danforn Lim, conjoint clinical academician at the South Western Sydney Clinical School, University of New South Wales, Australia.
Abstract
Purpose: Assess the validity of the use of a 15m course for the 6MWT in subjects with Parkinson Disease (PD) compared to non-PD controls ; also assess the use of dissimilar instructions during the 6 Minute Walk Test (6MWT) on a 15m and 30 meter course. Secondary outcomes included; the utility of pedometer use and predicted distance versus actual distances accomplished for each course for PD subjects.Methods: Volunteer subjects (N=35, 16 PD; 19 non-PD; mean age 70.2 years) participated. Data was collected on each course for using the instruction, “walk as far as you can” and “walk as fast as you can” for 6 minutes. A pedometer was worn. Predicted distance for the PD group was calculated.
Results: A 2 by 8 repeated measure detected differences within subjects’ p=.017 and between groups p=.003. The 15m fast course was found to be valid for the PD group. The PD group distance and the predicted distance formula were not different on any course. The instruction was a significant factor for control group 30m, p=.014; 15m, p=.005 and for the PD group 30m p=.026. Using the pedometer, there were some significant differences on the 30 fast course when measured by group p=.009.
Conclusion: Overall the PD group performed best on the 30m far course. Fast instruction is recommended for healthy older adults (either size course) and for PD subjects on the 15m course for the best possible effort. The pedometer is an accurate and valid on a 30 far and 15 meter course with PD. The predicted distance is a good indicator of functional distance for these mild to moderate PD subjects on either size course and with either set of instructions.
Keywords
PD; Pedometer; 6MWT; Instruction; RPEIntroduction
The six minute walk test [6MWT] is an effective measure of functional capacity in healthy adults and in adults with mild to moderate Parkinson Disease [PD]. The administration of the 6MWT according to the American Thoracic Society [ATS] instructs a subject to “walk as far as you can” [1]. Other studies have given the instructions “walk as fast as you can” [2,3]. Rikli and Jones studied the 6MWT using the verbal command, “walk as fast as possible for 6 minutes”, in healthy adults and found it to be a moderately valid measure of physical endurance and reliable. They concluded that this test reflects an older adults’ overall functional ability [3]. Southard et al studied both types of instruction with healthy aging and older adults and found good agreement with no differences based on instruction on a 30 m course [4]. The Yamax DIGI-WALKER SW-651 pedometer has been found to be valid measure of walking distance during the 6MWT with healthy adults [5,6]. Our primary outcome measure of this project was to determine whether a 15 m course size would be valid in a PD population for the 6 minute walk test. Secondary outcome measures include; 1.Dissimilar instructions given during the 6 Minute walk tests affect the distance 2. Comparison of the derived predicted distance based on a PD reference equation with the PD subjects’ actual distances achieved. 3. The validity of the use of a pedometer in PD.Methods
This study was approved by the Institutional Review Board at New York Institute of Technology [NYIT]. A sample of convenience was used; healthy subjects were recruited from the local NYIT community. The PD subjects were members of a Wellness program at NYIT Academic Health Center. Flyers were hung in the Physical Therapy suite where the Wellness program meets. All Wellness members with PD and healthy controls were invited to participate. Twenty one PD subjects and twenty four controls consented. Inclusion criteria were that subjects of either gender be between 48-85 years old; Hoehn and Yahr rating scale stages 1-3 (experimental group), no pain greater than 3/10 grossly, able to ambulate independently with or without device for six minutes and cognition sufficient to understand instructions. Exclusion criteria included subjects that had a fluctuating response to levodopa, suffered from disabling dyskinesias, were cognitively impaired; indicated by a score of 24 or less on the Mini-Mental State Examination, any other significant neurologic, cardiovascular, or musculoskeletal condition or pain that could affect ambulation.Thirty-five subjects completed the study, composed of 25 males and 10 females. There were 19 subjects in the control group and 16 subjects in the PD group. PD group had a mean MDS-Motor Unified Parkinson Disease Rating Scale (UPDRS) of 29/80 (range 10-54). Five subjects did not complete the study in the PD group for varied reasons including; knee pain after the trial; being displaced after superstorm Sandy, and one subject changed their decision. Controls were lost in follow up after the practice trial. Each subject wore a Digi- Walker SW-651 pedometer placed midway between the umbilicus and iliac crest, affixed to the subject’s pant line and taped in place to assure secure placement. Vital signs including blood pressure, heart rate, and respiratory rate as well as the RPE Borg 6-20 scale were taken prior to and after each trial. The PD subjects were tested while on medication. The courses consisted of a 30 meter taped line and a 15 meter taped line with markings every 3 meters. An orange cone was placed at the end of each line. Each participant walked the course around the cones for 6 minutes. The linear distances derived in this study were measures from the starting position, to the stopping point in meters, based on markings on the floor. Linear distance determination using the pedometer was that distance in meters at completion of the 6MWT that registered on the pedometer, and was recorded at the place the subject stopped at after the trial. Stride length was adjusted on each pedometer for the subjects based on their height following the instructions from the manufacturer [7]. The PD predicted value was calculated using the following formula: 6MWDpred= 543.06 + [-10.83xTUG] + [2.04X OLS] + [-44.44 x gender] Gender= 0 for females and 1 for males [8]. At the time of consent, subjects completed the practice trial which was administered strictly following ATS guidelines, to reduce the chance of learning effects, and all pretesting. The predicted distance was calculated. All participants were permitted to do all four trials in one session or split the trials into two sessions. All participants were required to sit quietly between bouts for at least 5 minutes. Vital signs were repeated to assure the subject had returned to baseline.
During each trial the subjects walked the testing course distance for 6 minutes based on the instructions given. One subject was tested at a time. Therefore, in addition to the practice course, each subject was assigned to complete a randomly determined course (determined by a computer randomization program), for total of 4 sessions of the 6MWT.
During the testing, all subjects were allowed to stop in place if needed, but were not allowed to sit. Subjects were told randomly to either “walk as fast as you can” or “walk as far as you can” in 6 minutes until each course under each type of instruction was completed one time. Researchers tallied laps and guarded subjects as necessary. At the end of the 6 minutes, each subject was told to stop where they were. Pedometers were read in place to record the final distance. The correct linear distance was measured from the subject’s starting position. Each subject’s Rate of Perceived Exertion (RPE) was recorded and vital signs were taken. This was done twice for each course (15m, 30m) under each set of instruction.
Results
All statistics were completed using SPSS for windows version 20. A power analysis revealed that to obtain a medium effect size 34 subjects were necessary to have a power of 80% at an alpha of .05 for t tests. Subject characteristics were completed (Table 1). Table 2 illustrates the mean values for each group’s performance on the 15m and 30m fast and far courses. Table 3 represents the distance recorded from the pedometer values versus the linear values for subjects with PD.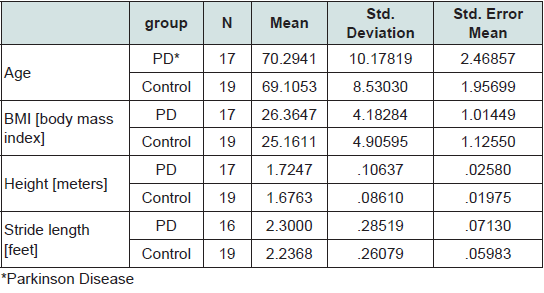
Table 1: Group Characteristics.
As can be seen in Table 1 there were no differences found using paired independent sample t-test between the groups based on age (p=.420), gender (p=.097)and BMI (p=.969). The 2x8 repeated measures showed significant within subjects effects based on trials (p=.017) and effects between group and trials demonstrating significance (p= .003).
Combined group paired sample t tests demonstrated that there were significant differences found based on instruction this was illustrated in the 15 meter pair (t= -3.908, p= .0001). Also when the pedometer was compared to the 30m fast distance there was a difference (p=.044). The paired samples t tests isolating the PD group demonstrated significant differences in the far instruction trial between the 30m course and the 15m course, (t=2.455; p=.027) as can been seen in Table 3. There was no significant difference between the predicted PD distance and actual linear distance seen in the 30m far (t=-2.051, p=.058) or 30m (t= -1.100, p = .289) fast course; this was also true for the 15m far (.073, p= .943) or 15m fast (t=.948, p=.357). The mean predicted distance was, 439.21m and actual 472.37m 30m far course; 462.5m 30m fast course.
Discussion
Our study demonstrated that in a PD population, with mild to moderate PD (H&Y 1-3) performing a 6 minute walk test on the 15m course using the fast instruction was valid. Statistical compilations found no differences in the distances completed during a comparison of 15m course using the fast instruction with the 30m fast course. Secondly, the instruction type affected performance in the PD group; thirdly, the prediction formula was accurate in predicting the PD subjects’ performance on the 6 MWT on both courses. Furthermore, a pedometer was a valid and reliable tool for distance measurement during the 6MWT with the PD population on 15m and 30m course.There were differences within and between the groups. These effects might have been caused by the inter-trial variability that was evidenced with the PD group. Also, the PD group performed each trial with less linear and pedometer distance accomplished compared to the controls. Overall the mean gait speed for the PD group during the 30m far trial was 1.30m/s (value obtained from the results of the 6MWT). The controls’ mean gait speed was 1.42m/s for the same trial. Canning et al, also found that PD subjects were not able to walk as fast as healthy controls during the 6MWT, and also that the PD subjects could increase their gait speed during the 6MWT but were unable to sustain that increase. Lastly, Canning found that healthy controls and PD subjects had a similar response to changes in gait speed during the 6MWT where the first and last minute of the test were faster than the middle four minutes [9].
Fast/Far Instruction and Length of Course
In addition, when the 30m trial included the walk as “fast” as you can instruction, the PD group distance mean decreased 10m (Table 3); whereas the controls increased by 53m. This is in agreement with Enright’s study [1]. We noted that the controls had a 43m increase on the 15 meter course when completing fast instruction methods. Table 2 illustrates the mean values for each group’s performance on the 15m and 30m course under both fast and far instruction. In summary, the control group had greater 6MWD than the subjects with PD on all trials on both the 15m and 30m courses. Both groups had a reduction in linear distance on the 15m course when compared with the similar 30 m course. This finding however did not reach statistical significance. Since there was no statistical difference between the groups on each course, one can posit that the 15m measurements are concurrently valid when compared with the 30m course for both groups.
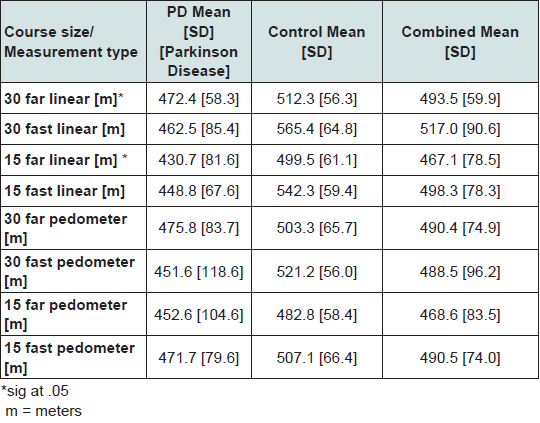
Table 2: Group and combined means of variables assessed.
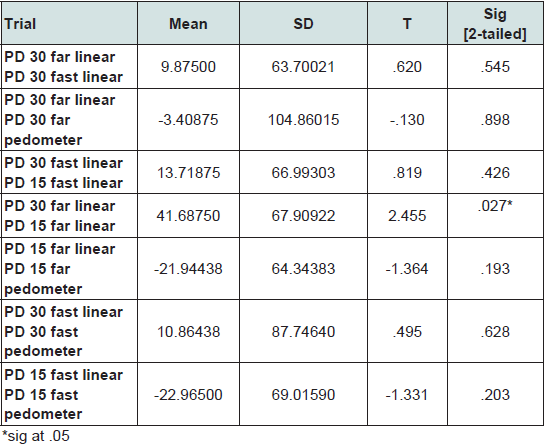
Table 3: Paired t test for PD group.
Validity of Trials and Pedometer Use
The pedometer recordings were accurate when compared to the linear measures on each 15 meter and 30 meter far course. The significant difference on the 30m fast course may be explained by the subjects overdoing it initially in the test and being unable to keep pace and having their gait speed drop off so the pedometer was less sensitive to the reduced vertical displacement. In all other cases studied, these findings indicate that the pedometer is a valid distance measure for these groups on both courses if the fast instructions are not used on the 30 m course. Southard and Gallagher’s, [4] findings with healthy aging adults on a 30m course using pedometers found no differences based on instruction. Moreover, this group of mild to moderately involved PD subjects had a gait speed that was over 1.0m/s which is what Dijkstra [14] recommended for pedometer use with this population. Therefore a pedometer is a feasible tool to accurately measure distance during the 6MWT on both 30 and 15m tracks.
Actual versus Predicted Distance Our PD subjects confirmed the calculated formula. The predicted distance was compared to the outcomes on the 30 meter courses since that is what was used to develop it. The PD subjects mean score was slightly greater than 33m above the derived value using Falvo’s [8]. Furthermore, upon continued assessment no statistical difference between the calculated formulas on either size course.
Limitations include a small convenience sample from the NYIT AHCC, more males than females, and PD subjects were participating in a wellness program which may have affected the performance of the PD subjects. Also our PD group was limited to those with a Hoehn and Yahr scale 1 to 3. Although our sample size was able to detect moderate affects, larger samples would allow better generalizations and perhaps conclusions on this study based on what stage the PD person is in. Future studies should move in this direction. Also future studies could assess the PD individual’s activity levels using the pedometer on courses that are premeasured. This group had mild to moderate PD and therefore these results cannot be generalized to those with more significant involvement. Also these subjects were assessed on medication and therefore these results cannot be used for those “off “medications.
Conclusion
In summary, regarding the validity of a 15m track for the PD group, concerns that the linear distance achieved on a 15m would be less than the traditional 30m course secondary to increased number of turns using “fast” instruction were not evidenced. Using the instruction to walk as “far” as you can instruction is not recommended on the 15 meter course for the PD population. The results of our study indicate that subjects with mild to moderate PD (H&Y 2-3) perform best on a 30m course using the far instruction. The pedometer was found to be a valid and reliable measure when compared to the linear distance in the 6MWT on a 15m and 30m course in those with PD when compared to linear measures and healthy controls. There was no difference between either size course and distances calculated using a prediction equation. This was the first study to use the 6MWT to assess the performance of PD subjects vs. healthy aging adults over two different sized courses, with different instructions, and a pedometer.Acknowledgements
Acknowledgments of technical assistance with data collection and scheduling to Danique Williams; Lauren Sabia; Matthew Brown; Tracey Paschal; Shivani Shah.References
- Enright PL, McBurnie MA, Bittner V, Tracy RP, McNamara R, et al. (2003) The 6-min walk test: a quick measure of functional status in elderly adults. Chest 123: 387-398.
- Troosters T, Gosselink R, Decramer M (1999) Six minute walking distance in healthy elderly subjects. Eur Respir J 14: 270-274.
- Rikli RE, Jones CJ (1998) The reliability and validity of a 6-minute walk test as a measure of physical endurance in older adults. J Aging Phys Activity 6: 363-375.
- Southard V, Gallagher R (2013) The 6MWT: will different methods of instruction and measurement affect performance of healthy aging and older adults? J Geriatr Phys Ther 36: 68-73.
- Schneider PL, Crouter S, Bassett DR (2004) Pedometer measures of free-living physical activity: comparison of 13 models. Med Sci Sports Exerc 36: 331-335.
- Digimax: www.new-lifestyles.com.
- Enright PL, Sherrill DL (1998) Reference equations for the six-minute walk in healthy adults. Am J Respir Crit Care Med 158: 1384-1387.
- Falvo MJ, Earhart GM (2009) Six-minute walk distance in persons with Parkinson disease: a hierarchical regression model. Arch Phys Med Rehabil 90: 1004-1008.
- Canning CG, Ada L, Johnson JJ, McWhirter S (2006) Walking capacity in mild to moderate Parkinson's disease. Arch Phys Med Rehabil 87: 371-375.
- Harada ND, Chiu V, Stewart AL (1999) Mobility-related function in older adults: assessment with a 6-minute walk test. Arch Phys Med Rehabil 80: 837-841.
- Eaton T, Garrett JE, Young P, Fergusson W, Kolbe J, et al. (2002) Ambulatory oxygen improves quality of life of COPD patients: a randomised controlled study. Eur Respir J 20: 306-312.
- Steffen TM, Hacker TA, Mollinger L (2002) Age- and gender-related test performance in community-dwelling elderly people: Six-Minute Walk Test, Berg Balance Scale, Timed Up & Go Test, and gait speeds. Phys Ther 82: 128-137.
- Steffen T, Seney M (2008) Test-retest reliability and minimal detectable change on balance and ambulation tests, the 36-item short-form health survey, and the unified Parkinson disease rating scale in people with parkinsonism. Phys Ther 88: 733-746.
- Dijkstra B, Zijlstra W, Scherder E, Kamsma Y (2008) Detection of walking periods and number of steps in older adults and patients with Parkinson's disease: Accuracy of a pedometer and an accelerometry-based method. Age Ageing 37: 436-441.