
Journal of Food Processing & Beverages
Download PDF
The hedonic evaluation revealed a statistically significant preference for wine 654, which obtained a mean appreciation score of 3.63 ± 0.94, outperforming both wine 587 (3.06 ± 0.97) and wine 886 (3.10 ± 1.04) (P < 0.05). This superior rating was corroborated by the Acceptability Index (AI): only wine 654 (AI = 0.72) surpassed the consumer acceptance benchmark of 0.7, whereas the other two samples did not (AI = 0.61 and 0.62). We analyzed the contribution of eight key sensory descriptors [Figure 2]. These attributes spanned mouthfeel (volume, warmth, dryness), taste (bitterness, acidity, sweetness), aroma, and colour, allowing for a comprehensive breakdown of the drivers of overall liking.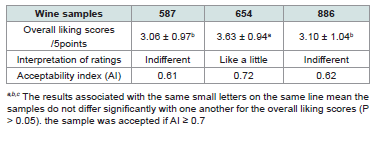 Table 1: Overall assessment ratings and acceptability indices for the different
wines
Table 1: Overall assessment ratings and acceptability indices for the different
wines
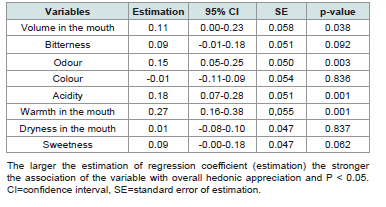 Table 2: Linear regression of hedonic descriptors on overall hedonic appreciation
of wines
Table 2: Linear regression of hedonic descriptors on overall hedonic appreciation
of wines
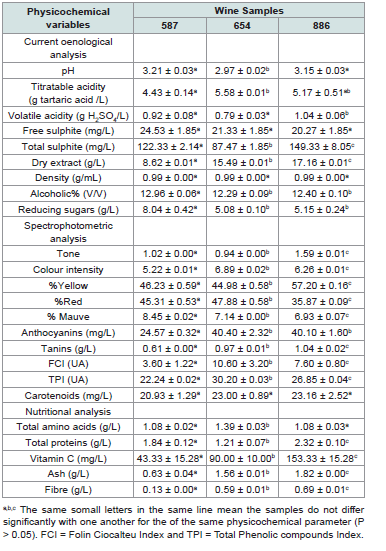 Table 3: Results of the analyses of the physicochemical parameters of current,
spectrophotometric and nutritional of the three wines.
Table 3: Results of the analyses of the physicochemical parameters of current,
spectrophotometric and nutritional of the three wines.
Dry extract is determined by weighing the residue obtained after evaporation of the wine. It encompasses all non-volatile wine compounds, notably fixed acids, acid salts, sugars, glycerol, coloring matter, tannins, pectins, polysaccharides, proteins, and minerals [7]. Its quantification serves as a relevant indicator of wine authenticity.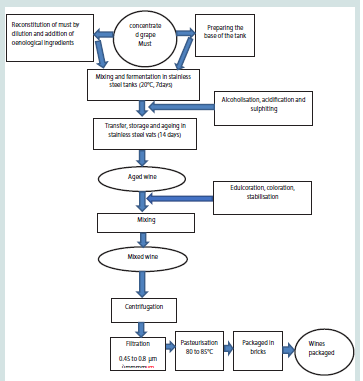 Figure 1:Technology diagram
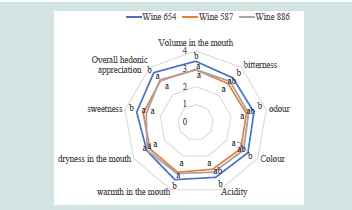 Figure 2: Influence of hedonic descriptors on the overall appreciation of the
different wines.
Figure 2: Influence of hedonic descriptors on the overall appreciation of the
different wines.
a, b, c:The same small letters associated with a given hedonic descriptor indicate that the samples do not differ significantly from each other for that descriptor (P > 0.05).
Fibre analysis showed that the total fibre content was significantly different in the samples (P < 0.05), with low, medium and high content respectively in wine samples 587 (0.13 ± 0.00 g/L), wine 654 (0.59 ± 0.01 g/L) and wine 886 (0.69 ± 0.01 g/L). These differences could be explained by the oenological techniques used in the production of each product (use or non-use of industrial yeast lysates) [57]. In red wine, the fibres are mainly composed of mannoproteins, polysaccharides and dietary fibres. These compounds have been shown to reduce the perception of astringency and bitterness in wine through their interaction with the wine’s tannins and to improve the stability of red wines [58]. They also add body to wine [58]. However, the dose must be moderate in order to avoid altering the colour [59]. The moderate fibre content of wine sample 654 would have contributed to the appreciation of its volume in the mouth and, consequently, to its better overall appreciation.
The principal component analysis shows that the three wines occupy distinct positions on the plot. The most appreciated sample, wine 654, is positively associated with vectors for total acidity, total phenolic compounds, colour intensity, amino acids, anthocyanins, and the red coloured pigments. In contrast, the less-preferred wine 587 is primarily associated with alcohol content, reducing sugars, and the purple-coloured pigments. The third sample, wine 886, is distinguished by its strong association with vitamin C, higher colour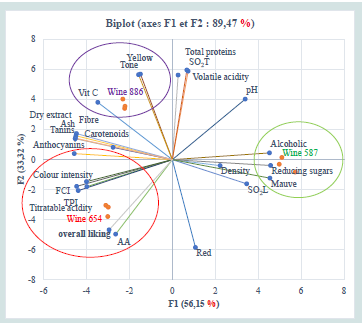 Figure 3: Principal component analysis of the three wines (wine 654; wine
886; wine 587) knowing the level of overall liking of each sample.
TPI = Total phenolic compounds index, FCI = Folin ciocalteu index, AA =
Amino acids, Vit C = Vitamin C, SO2L= Free sulphur dioxide, SO2T = Total
sulphur dioxide.
Figure 3: Principal component analysis of the three wines (wine 654; wine
886; wine 587) knowing the level of overall liking of each sample.
TPI = Total phenolic compounds index, FCI = Folin ciocalteu index, AA =
Amino acids, Vit C = Vitamin C, SO2L= Free sulphur dioxide, SO2T = Total
sulphur dioxide.
Research Article
Sensory and Physicochemical Characterization of Three Oenological Products from Cameroon
Teguem TA1, Kotue TC1*, Saha FBU2, Mbassi MG1 and Kansci G1
1Laboratory for Food Science and Metabolism, Department of
Biochemistry, Faculty of Science, University of Yaounde 1, PO.Box :
812 Yaounde, Cameroon
2Department of Biochemistry, Faculty of Science, University of Bamenda, P O Box: 39 Bambili, Cameroon
2Department of Biochemistry, Faculty of Science, University of Bamenda, P O Box: 39 Bambili, Cameroon
*Address for Correspondence:Charles Kotue Taptue, Department of Biochemistry, University
of Yaounde 1, PO.Box : 812 Yaounde, Cameroon E-mail Id: ctkotue-bio@yahoo.fr
Submission: 02 November 2025
Accepted: 19 December 2025
Published: 30 December 2025
Copyright: © 2025 Teguem TA, et al. This is an open access article
distributed under the Creative Commons Attribution License, which
permits unrestricted use, distribution, and reproduction in any medium,
provided the original work is properly cited.
Keywords:Dry Red Wines; Sensory Quality; Physicochemical
Composition; Hedonic Descriptors; Overall Appreciation
Abstract
In Cameroon’s expanding eneological sector, local producers are
responding to the rise of a middle-class consumer base with specific
sensory expectations. Despite comparable pricing (~1300 FCFA/L) and
similar packaging, commercial dry red wines show marked variability in
consumer acceptance. This study sought to characterize and identify
the physicochemical factors influencing consumer preferences
among three popular locally produced red wines. Hedonic sensory
and physicochemical evaluations were conducted. ANOVA, linear
regression, and principal component analysis (PCA) were strategically
applied to examine and interpret the results. Hedonic analysis revealed
that wine 654 was significantly (p<0.05) more appreciated (mean
score: 3.63 ± 0.94) than wines 886 and 587. Linear regression indicated
that in-mouth volume, odor, acidity, and in-mouth warmth were the
main sensory attributes driving overall liking. The most appreciated
wine, wine 654, exhibited a distinct chemical profile: lower pH (2.97 ±
0.02), higher total acidity (5.58 ± 0.01 g/L), lower alcohol content (12.29
± 0.09%), and greater color intensity (6.89 ± 0.02). It was also richer
in total phenolics (TPI: 30.20 ± 0.03 AU), anthocyanins (40.40 ± 2.32
mg/L), and amino acids (AA: 1.21 ± 0.07 g/L), and showed moderate
tannin (0.97 ± 0.01 g/L) and vitamin C levels (90.00 ± 10.00 mg/L).
Except for dry extract in two samples, all parameters complied with
OIV standards. Principal Component Analysis identified acidity, sugar,
alcohol, AA, total proteins, total SO2, and total phenolic compounds
as the main physicochemical markers of sensory quality, thus providing
avenues for optimizing wine quality to align with the specific palate of
Cameroonian consumers. To further advance this work, future research
will focus on detailed profiling of phenolic compounds, organic acids,
and volatile aromatic compounds contributing to the overall sensory
experience.
Introduction
Grapes, the fruit of the vine (Vitis vinifera), represent a strategic
raw material for winemaking, a fermented product among the most
widely consumed worldwide. Wine quality is intrinsically linked to
grape quality, which itself is influenced by a wide range of factors,
including the geographical location of the vineyard, climate, soil
characteristics, viticultural practices, and the grape varieties used
[1]. This quality is reflected in both sensory and physico-chemical
properties, the expression of which is closely dependent on the initial
composition of the grape.
Recent studies have highlighted the impact of the production method on sensory dimensions and, consequently, on the overall perception of wine quality [2]. In this context, the development of wine products with distinctive organoleptic profiles represents a major strategic lever for the growth of the wine industry, in response to the diverse expectations of consumers [3]. Accordingly, oenological research focuses on characterizing wine production, composition, and tasting modalities in order to optimize winemaking processes and ensure consistent quality [3].
Recent studies have highlighted the impact of the production method on sensory dimensions and, consequently, on the overall perception of wine quality [2]. In this context, the development of wine products with distinctive organoleptic profiles represents a major strategic lever for the growth of the wine industry, in response to the diverse expectations of consumers [3]. Accordingly, oenological research focuses on characterizing wine production, composition, and tasting modalities in order to optimize winemaking processes and ensure consistent quality [3].
The sensory quality of wine relies both on its aromatic expression
and the perceived gustatory balance, the latter resulting from the
interaction between sour, sweet, and bitter tastes, modulated by
tannic structure. Major organic acids such as tartaric, malic, citric,
and lactic acids play a central role in the perception of acidity [4],
while the bitterness of red wines is partly attributed to plant-derived
phenolic compounds, as well as to ellagitannins extracted from oak
wood during barrel aging [5].
As a complex and evolving product, wine must meet physicochemical standards defined by the International Organisation of Vine and Wine [6], which serve to characterize the quality of red wines based on criteria such as: pH (2.8 to 3.8), total acidity (≥ 3.5 g/L of tartaric acid or 3 to 6g/L sulphuric acid), volatile acidity (≤ 0.98 g/L), alcoholic strength by volume (8.5 to 15% vol), sugar content in the must (150 to 250 g/L), residual sugars (0 to 10 g/L for dry wines; 20 to 40 g/L for sweet wines), free SO₂ content (≤ 40 mg/L at consumption), total SO₂ (≤ 150 mg/L for wines with <5 g/L sugar), dry extract (≥17 g/L), colour (color intensity), and phenolic compound content [7,8].
Globally, European countries remain the leading wine producers, with Italy, France, and Spain at the top, producing 47.2, 43.9, and 37.5 million hectolitres per year, respectively. In Africa, South Africa stands as the primary producer, with an annual output of 10.4 million hectolitres [9].
In Cameroon, according to data collected at the General Directorate of Imports, wine operators in Cameroon have ordered large quantities of secure stickers to stamp wines in recent years. The data shows an increasing trend in orders for stickers over the years, with 47752220, 58739874, 31766968, 39634204 stickers ordered for the years 2022, 2021, 2019 and 2018 respectively, highlighting the growing importance of wine in local food culture and consumption habits.
Wine holds a special place in Cameroonian social practices,
particularly during ceremonies and celebrations. The systematic
introduction of wine lists in restaurants also reflects the valued nature
of its consumption. Furthermore, red wine presents documented
functional benefits. Indeed, moderate consumption may contribute to
the nutritional prevention of various diseases, due to the presence of
phenolic compounds with antioxidant properties [10]. These bioactive
molecules are associated with anti-carcinogenic, anti-atherogenic,
anti-inflammatory, immunomodulatory, and antimicrobial effects,
among others [11]. Moreover, its high-water content makes wine a
beverage that also contributes to hydration.
Numerous recent studies have focused on the physico-chemical and sensory characterization of wines or their raw materials, with a view to technological optimization through targeted choices related to grape varieties, enological inputs, or winemaking processes [12-14].
In Cameroon, the wine sector is experiencing sustained growth, driven primarily by demand from the middle class. Many local production units are attempting to meet this demand by offering affordable and competitive wines while maintaining an acceptable level of quality. However, understanding consumer sensory preferences remains a complex challenge. On the local market, three brands of dry red wines sold in similar packaging and within the same price range (approximately 1300 FCFA per liter) are particularly popular. Despite this apparent homogeneity, certain brands are more appreciated than others, yet no study to date has identified the factors responsible for these sensory differences.
The present study aimed to identify the physico-chemical and sensory determinants responsible for the differences in perception among three popular local brands of dry red wines, in order to propose technological levers for improving the quality of wines produced in Cameroon, in line with consumer preference.
Materials and Methods
Chemicals and reagents:
Sodium hydroxide (NaOH), iodine (I₂), formaldehyde
(CH₂O), sulfuric acid (H₂SO₄), purchased from An ITW company
(Darmstadt, Germany), Folin-Ciocalteu reagent ([ PMo₁₂O₄₀]³⁻ and
[PW₁₂O₄₀]³⁻), hydrogen peroxide (H₂O₂), tartaric acid (C₄H₆O₆),
calcium carbonate (CaCO₃), sodium metabisulfite (Na₂S₂O₅),
hydrochloric acid (HCl), 3,5-dinitrosalicylic acid (DNS), zinc
sulfate (ZnSO₄), potassium ferrocyanide (K₄[Fe(CN)₆]), ninhydrin
(2,2-dihydroxyindane-1,3-dione), sodium acetate (CH₃COONa),
2,6-dichlorophenolindophenol (2,6-DCPIP), ascorbic acid (C₆H₈O₆),
glycine (C₂H₅NO₂), ammonium sulfate ((NH4)2SO4), pure glucose
(C₆H₁₂O₆), acetic acid 90% (CH₃COOH), pure starch ((C6H10O5)
n), formalin (CH₂O), acetylacetone (C₅H₈O₂), ethanol (C₂H₅OH),
1-butanol 80% (C₄H₁₀O) were purchased from Sigma-Aldrich
(Darmstadt, Germany).Sampling:
The study was carried out using three popular commercial
samples of dry red wines in the same price range (1300 FCFA/per
1-litre unit) and with the same packaging. The three popular brands
of wine were produced in August 2022 from concentrated Vitis
vinifera L. grape must of the Garnacha Tintorera Valencia variety,
as shown in the technological diagram below [Figure 1]. Three units
(bricks) of 1L each of the same production batch of each sample
were taken from three cellars in the city of Yaoundé on 27/08/22.
All samples were transported to the Food Science and Metabolism
Laboratory of the University of Yaoundé 1 on 28/08/22. Composite
samples of each brand were then prepared by homogeneously mixing
the same volumes of wine for sensory and physicochemical analysis.
The bottles containing the samples were coded (wine 587; wine 886
and wine 654= reference) and stored in a refrigerator at 10-12ºC
throughout the test period with oxygen vacuum corks to preserve the
wine in good condition. The glasses were coded with the same 3-digit
numbers. Sensory analyses were carried out fromHedonic sensory analysis of the three wines:
This analysis combines the general appreciation of each wine,
the acceptability index of each wine and the influence of the hedonic
descriptors on the overall appreciation of the wines. It was carried out
using the AFNOR method.General conditions and ethical statement: The panellists were recruited voluntarily and they were asked to sign an informed
consent form in which they were informed about the presence of
sulfite and ethanol in the sample wines to avoid any related issues.
The maximum quantity of wine per glass per sample was 30 mL
per glass per sample [15] and the wines contained approximately
13% v/v ethanol (3.9 g of ethanol per 30 mL sample). The study was
conducted following the Declaration of Helsinki [16]. There was no
cost to participate; refusal to participate did not imply any penalties
or loss of benefits, and participants were permitted to withdraw at any
time without giving any reason. Based on this statement and since
the participants were instructed to spit the wine after the analysis
and the sample were commercial products available on the market,
approval from an ethics committee was not required [15]. In all three
assessments of sample water and unsalted crackers were provided
for palate cleansing. The panel was formed of 108 naïve assessors
(91% male, 9% female; mean age 38.5 ± 11.9 years). All assessors
were educated adults working in the trade sector, with a good level
of comprehension. As the panel was composed of naïve assessors,
formal training sessions were not required. The panel leader ensured
that each descriptor was well understood by the assessors by using
familiar vocabulary to explain them. To avoid misunderstandings
and to reflect consumers’ perception of the products, explanations
of each descriptor evaluated, using simple and understandable
vocabulary, were given to consumers. The monitor ensured that
consumers would understand the explanation before proceeding with
the evaluation questionnaires [15]. For example, the dryness of the
mouth on contact with the wine was used to explain the descriptor
“astringency” to the tasters, the wine as heavy as boiling or as light/
fluid in the mouth as water was used to explain the descriptor “volume
in the mouth”, the warmth in the mouth was used for the descriptor
“richness in alcohol”.
Overall assessment: A panel of 108 naive judges with experience
of consuming wine was recruited from the Nkolen-Eton and Elig
Edjoua markets in Yaounde. The age of the panelists ranged from
21 to 64 years. The following scale legend was used for the overall
assessment and evaluation of the hedonic descriptors: (1=Don’t like
at all, 2= Don’t like too much, 3= Indifferent, 4= Like a little, 5=
Like too much). Each panelist gave an overall assessment based on
5 points. The acceptability index was then evaluated by dividing the
average overall rating by 5.
Evaluation of the hedonic descriptors on the hedonic appreciation of the different wines: Hedonic descriptors such as
volume in the mouth, dryness in the mouth, warmth in the mouth,
odour, colour, bitterness, sweetness and acidity were evaluated and
scored on a 5-point ordinal scale. The tasting conditions were carried
out according to the method described by Duley et al. [12] and
Casamayor et al. [17].
Samples of 30 mL of each wine were presented simultaneously
to the tasters in three transparent glasses, each coded with a threedigit
random number. All wines were served at room temperature
(approximately 25°C) and evaluated individually. The tasters were
given the following instructions: successively bring the small quantity
of wine contained in the glass into the mouth and suck in a trickle of
air; then stir the wine in the mouth and wait for about twelve seconds,
swallow or spit it out; rinse the mouth with water before moving on
to the next sample. At the end, record the hedonic descriptors for
each product tasted successively, on the 5-point ordinal scale on
the tasting sheet, according to the level of hedonic appreciation.
Then give your your overall appreciation of each wine by marking
the hedonic evaluation on a 5-point scale. For each judge, questions
relating to age, sex and whether or not they drank dry red wine were
asked. The results were expressed by calculating the average points for
each descriptor out of five.
Physicochemical characteristics of wines
Current oenological parameters: The analytical methods proposed by the International Organisation of Vine and Wine
[18] were used to determine the following wine physicochemical
parameters: pH, titratable acidity, volatile acidity, free and total
sulphite content (SO2L and SO2T), dry extract, density and alcoholic
content. Volatile acidity and titratable acidity were expressed as
g sulphuric acid per litre and tartaric acid, respectively, at 20 °C.
Alcoholic content was expressed as the percentage of ethanol (v/v)
at 20 °C. free and total sulphite content was expressed in mg/L.
Reducing sugars were determined by measuring the absorbances
at wavelengths 530 nm, using the DNS (3,5-dinitrosalicylic acid)
colorimetric method described by Fischer and Stein [19].
Spectrophotometric parameters: The colorimetric analysis of wine samples was conducted by evaluating three characteristic
wavelengths: absorbance at 420 nm (yellow), 520 nm (red), and 620
nm (mauve). Based on these measurements, three characteristic
indices were calculated: color intensity (CI), hue (T), and the relative
contribution (%) of each colour component.
Chromatic parameters of wines: The Colour intensity (CI) was determined by absorbance measurements using 1 mm path length
cells, the values being converted to an optical path of 1 cm:
CI = (A420 nm+A520 nm+A620 nm) (1)
The chromatic tone (T) value was calculated using the ratio of the absorbance at 420 to that at 520: T = A420 nm/A520 nm. The % Yellow, % Red and % Blue colorimetric indices were calculated by measuring the absorbances at wavelengths 420, 520 and 620 nm, respectively, using a RIGOL UV-vis spectrophotometer with a 0.5 cm quartz cuvette and using the following formula:
The chromatic tone (T) value was calculated using the ratio of the absorbance at 420 to that at 520: T = A420 nm/A520 nm. The % Yellow, % Red and % Blue colorimetric indices were calculated by measuring the absorbances at wavelengths 420, 520 and 620 nm, respectively, using a RIGOL UV-vis spectrophotometer with a 0.5 cm quartz cuvette and using the following formula:
% AX = (AX/CI) ×100 (2)
where AX is the absorbance of each coloration [20].
where AX is the absorbance of each coloration [20].
Total Anthocyanins content: Total anthocyanins were determined using the method described by Ribéreau-Gayon and
Stonestreet [21] To this end, a solution was prepared containing 0.5
mL of wine sample, 0.5 mL of 0.1% ethanol, and 10 mL of 2% HCl.
Five millilitres of this solution were transferred into two test tubes:
one was supplemented with 2 mL of distilled water (control tube), and
the other with 2 mL of 15% (w/v) sodium bisulfite solution (bisulfite
tube), in which anthocyanin discoloration was observed. Absorbance
was measured after 20 minutes at 520 nm:
Total Anthocyanins (mg/L) = 875× (A520 nm control–A520 nm
bisulfite) (3)
where 875 is the conversion factor
where 875 is the conversion factor
Total tannins content:
Total tannins were determined using the method described by
Ribéreau-Gayon and Stonestreet. [22]. To this end, 2 mL of wine
sample diluted 50-fold were placed in a hydrolysis tube along with 1
mL of distilled water and 3 mL of concentrated hydrochloric acid (12
N or 37%). The tube was sealed with a Teflon-lined cap and heated in
a water bath at 100 °C for 30 minutes. Simultaneously, a control tube
containing the same solution was kept on ice. After cooling of the
hydrolyzed tube, 0.5 mL of ethanol was added to each tube, and the
absorbance was measured at 550 nm:Total tannins (g/L) = 19.33× (A550 nm hydrolyzed – A550 nm
control) (4)
where 19.33 is the conversion factor
where 19.33 is the conversion factor
Total phenolic compounds: Total phenolic compounds (TPC) were evaluated using two methods described by García [23]: Into a 100 mL volumetric flask were successively introduced: 1 mL of wine
diluted 10-fold, 50 mL of distilled water, 5 mL of Folin–Ciocalteu
reagent, and 20 mL of 20% (w/v) anhydrous sodium carbonate
(Na₂CO₃) solution. The mixture was brought to volume with distilled
water, homogenized, and left to stand for 30 minutes. Absorbance
was measured at 760 nm:
Folin–Ciocalteu index (FCI) (UA) = A760 nmxdilution factorx20
(5)
where 20 is the conversion factor. Total Phenolic compounds index (TPI): The wine, diluted 100 times with distilled water, Absorbance was measured 30 min after adequate dilution of samples, using 1 cm path length cells
TPI = A280nmx100 (6)
The total phenol content was expressed as absorbance units (AU). where 100 is the dilution factor.
The carotenoids content: Total carotenoids were assessed using the method described by Maira et al. [24]. One milliliter of wine was introduced into one test tube and 1 mL of distilled water into
another, followed by the addition of 5 mL of 70% (v/v) ethanol to
each tube. The tubes were incubated in the dark for 15 minutes with
shaking. Subsequently, the samples were centrifuged at 5000 rpm,
and absorbance was measured at 665 nm, 649 nm, and 440 nm,
respectively to the quantification of chlorophyll A, chlorophyll B, and
carotenoids.
Nutritional parameters: The determination of total amino acid content was carried out using the ninhydrin method described by
Kendall et al. [25] by measuring absorbances at 550nm. The total
amino acid content was expressed in g/L. Crude protein (nitrogen
x 6.25) was determined using a modified Kjeldahl procedure,
which uses concentrated sulphuric acid and hydrogen peroxide
to decompose the sample with the addition of metal catalysts [19].
Vitamin C content in the sample was determined using the method
described by Iddah et al. [26], which uses sample, concentrated acetic
acid and 2,6-dichlorophenol indophenol (2,6 DCPIP) solution for
titration. The crude ash content and fibre were determined after
calcination by the method described by A.O.A.C. [27]. They were
expressed in g/L. All other analyses were performed using a RIGOL
UV-vis spectrophotometer (Ultra-3400, China) with a 1-cm quartz
cuvette
Statistical analysis:
The physico-chemical experiments were run in triplicate. The
data of the sensorial and physico-chemical analysis were reported
as mean ± standard deviation and treated using a one-way analysis
of variance (ANOVA, Tukey test, P < 0.05) to identify significant
differences between the wines. These statistical tests were performed
using SPSS software, version 21.0 (IBM, Endicott, New York, USA).
Linear regression with the overall hedonic appreciation (5-point
scale) was used to highlight the hedonic determinants involved in
wine appreciation. Principal Component Analysis (PCA) was used to
study the correlations between the Physicochemical variables and the
wines and overall liking, knowing the level of overall appreciation of
the wines and to highlight the physicochemical determinants. These
were performed using XLSTAT 2014 software (Addinsoft, Paris,
France). The differences were considered significant at P < 0.05.Results and Discussion
Sensory hedonic analysis of samples:
A hedonic sensory analysis was conducted with 108 naive
consumers selected to represent the target market. The participant
cohort had a mean age of 38.5 ± 11.9 years and comprised 91% males
and 9% females. This significant gender imbalance is a key feature of
the study, as it deliberately mirrors the observed consumer base for
affordable, locally produced red wines in the Cameroonian context.
[Table 1] summarizes the overall liking scores and acceptability
indices derived from this panel.The hedonic evaluation revealed a statistically significant preference for wine 654, which obtained a mean appreciation score of 3.63 ± 0.94, outperforming both wine 587 (3.06 ± 0.97) and wine 886 (3.10 ± 1.04) (P < 0.05). This superior rating was corroborated by the Acceptability Index (AI): only wine 654 (AI = 0.72) surpassed the consumer acceptance benchmark of 0.7, whereas the other two samples did not (AI = 0.61 and 0.62). We analyzed the contribution of eight key sensory descriptors [Figure 2]. These attributes spanned mouthfeel (volume, warmth, dryness), taste (bitterness, acidity, sweetness), aroma, and colour, allowing for a comprehensive breakdown of the drivers of overall liking.
A detailed analysis of the sensory descriptors [Figure 2]
deconstructs the consumer preference for wine 654. This preferred
sample consistently outperformed the others, showing significantly
higher ratings (P < 0.05) across nearly all positive attributes when
compared to wine 587. The distinction was narrower against wine
886, with mouthfeel and sweetness emerging as the key significant
differentiators (P < 0.05). Crucially, the two less-preferred wines, 587
and 886, were sensorially indistinguishable; no significant differences
(P > 0.05) were found for any descriptor, mirroring their similar
overall hedonic scores. While this analysis identifies the attributes
that were rated differently, linear regression was employed to
determine which descriptors were most predictive of overall liking.
[Table 2] presents the model outputs, quantifying the contribution of
each sensory attribute to the final consumer rating.
To quantify the factors influencing overall liking, a linear regression analysis was performed [Table 2] . The model revealed that in-mouth volume, odor, acidity, and in-mouth warmth were the sensory attributes that significantly and positively influence the overall liking of the wine (P < 0.05). Indeed, in-mouth volume often associated with perceptions of roundness, suppleness, and structure contributes to a sense of fullness during tasting. This sensation is generally appreciated by consumers, as it imparts a richer and more pleasant texture to the wine. Similarly, odor plays a crucial role in shaping hedonic expectations: intense and pleasant aromas (such as red fruits, floral, or spicy notes) enhance overall liking, as confirmed
To quantify the factors influencing overall liking, a linear regression analysis was performed [Table 2] . The model revealed that in-mouth volume, odor, acidity, and in-mouth warmth were the sensory attributes that significantly and positively influence the overall liking of the wine (P < 0.05). Indeed, in-mouth volume often associated with perceptions of roundness, suppleness, and structure contributes to a sense of fullness during tasting. This sensation is generally appreciated by consumers, as it imparts a richer and more pleasant texture to the wine. Similarly, odor plays a crucial role in shaping hedonic expectations: intense and pleasant aromas (such as red fruits, floral, or spicy notes) enhance overall liking, as confirmed
by several previous studies on the relationship between aroma
intensity and acceptability. Indeed, according to the evaluators, wine
654 is considered sound due to its pleasant aroma, meaning it is free
from off-odors or unusual unclean notes, as described by Yusen et al.
[28]. Furthermore, when properly balanced, acidity brings freshness
and promotes a sense of liveliness, thus contributing to the wine’s
organoleptic balance. Lastly, in-mouth warmth typically associated
with alcohol content can be positively perceived when moderate, as
it enhances the perception of body and roundness. These findings
confirm that consumer preferences are closely linked to multisensory
attributes that combine olfactory, gustatory, and tactile components.
However, in contrast to the findings of Tamara et al. [29], other
descriptors such as sweetness, color, and mouthfeel dryness did not
exhibit a significant impact on hedonic appreciation in the present
study. This lack of significant effect may be attributed to the panel’s
lower sensitivity to these specific characteristics or to their limited
variation across the tested samples. These findings are consistent
with those reported by Maria et al. [30], who observed no significant
differences (P > 0.05) in sweetness preference among wines containing
2 g/L, 4 g/L, and up to 16 g/L of residual sugar except in individuals
with high extraversion traits, for whom a preference shift was noted at
8 g/L. Despite the absence of significant differences in the perception
of mouthfeel dryness and sweetness between samples, as evaluated
by the panellists (P > 0.05), a wine with a “good” or “balanced”
taste is one in which acidity, fruity aromas, sugar, and tannins are
in harmony, with a pleasant and lingering aftertaste. The overall
acceptability of wine sample 654 may be attributed to these sensory
attributes [8]. In fruit wines, naturally occurring phenolic compounds
may be responsible for the favorable aroma and taste of the wine
products. According to Sun et al. [31], phenolic compounds in wine
interact with salivary proteins in the mouth and are responsible for
wine astringency and bitterness. These observations highlight the
importance, for oenologists, of mastering the sensory dimensions
that directly influence consumer satisfaction. Improving mouthfeel
structure, aromatic expression, and acid–alcohol balance should be
prioritized when developing wines aimed at Cameroonian dry red
wine consumers from the middle-income market segment.
The physicochemical properties of the three wine samples were
analyzed to identify the chemical basis for the observed sensory
differences. The results are detailed in Table III and summarized
below by category.
Physicochemical analysis of samples:
The physicochemical and nutritional characteristics of the three
wine samples were analyzed, and the results are presented in [Table 3] .Current oenological analysis
pH, titratable acidity and volatile acidity content: The analysis of the physicochemical and sensory characteristics of the three red
wine samples revealed notable differences, particularly in terms of
their acidic profile, chromatic properties, and sensory acceptability.
Sample 654, which was significantly better appreciated by consumers,
was distinguished by a lower pH (2.97 ± 0.02) and a higher total
acidity (5.58 ± 0.01 g/L), giving the wine an increased perception
of freshness and greater microbiological stability. These values fell
within the ranges reported by Ma et al. and Dhroso et al., Delanoë
et al. [8,14,7], who observed pH values between 2.8 and 3.8, and total
acidity ranging from 3.9 to 6 g tartaric acid /L. Chemically, low pH
promotes the predominance of the flavylium form of anthocyanins,
the stable red pigment responsible for the intense color of young
wines. As demonstrated by several authors [32], anthocyanins are
mostly present in their colorless hemiketal form at pH 3–4, but as
the pH decreases, they convert into the flavylium cation (A+), thereby
intensifying the red hue of the wine. This phenomenon would explain
the better visual appreciation of sample 654, as well as the positive
descriptive terms used by panelists to describe its color. Furthermore,
this sample presented the lowest volatile acidity (0.79 ± 0.03 g
H₂SO₄/L), below the threshold value of 0.98 g/L, beyond which wine
develops a pungent odor typical of acetic acid. This moderate volatile
acidity is an indicator of well-controlled fermentation, limiting the
organoleptic deviations often caused by uncontrolled microbial
development. The results thus confirmed the observations of Delanoë
et al. [7] regarding the acceptable tolerance range for volatile acidity
in red wines. On a biochemical level, the organic acid composition
likely influenced the overall perception of the wine. Tartaric acid, the
dominant acid in wine, although not metabolized, can be partially
lost through precipitation or ionic neutralization with cations such
as K+, Ca²+ or Na+, as mentioned by Rajković et al.
[33]. The acid
stability of the wine depends on this, thereby impacting its gustatory
structure. Samples 587 and 886, which were less appreciated,
displayed higher pH values (3.21 and 3.15) and lower total acidity,
which may have reduced the perceived freshness and weakened
the aromatic expression. This inverse relationship between pH and
sensory intensity is corroborated by data from Scutarașu et al. [34],
who demonstrated the importance of fermentation control on the
final organic acid composition. Uncontrolled fermentations result in
higher acid concentrations, but also in greater aromatic variability,
which is sometimes negatively perceived.
Thus, the sensory superiority of sample 654 appears to result from the synergy between low pH, high total acidity, and moderate volatile acidity, combined with chemical reactions favorable to color stability and taste balance. These observations highlight the importance of precise management of acid–base parameters and fermentation conditions to optimize the quality of local red wines. Improving vinification processes in Cameroon could therefore rely on the rigorous control of these factors, while considering the complex chemical interactions that shape the sensory acceptability of the final products.
Thus, the sensory superiority of sample 654 appears to result from the synergy between low pH, high total acidity, and moderate volatile acidity, combined with chemical reactions favorable to color stability and taste balance. These observations highlight the importance of precise management of acid–base parameters and fermentation conditions to optimize the quality of local red wines. Improving vinification processes in Cameroon could therefore rely on the rigorous control of these factors, while considering the complex chemical interactions that shape the sensory acceptability of the final products.
Free sulphite et total sulphite content:
sulphur dioxide (SO2) is an authorised antiseptic and antioxidant
in wine production. A lack of sulphur dioxide can cause the wine to
appear stale when tasted [7]. Wines containing sugars that combine
with SO2 require large quantities of total SO2 in order to have a little
free SO2 to protect the wine against oxidation [35]. During wine
ageing, free SO2 values of 25 mg/L for red wine and 30 mg/L for white
wine and a maximum of 40 mg/L for consumption are recommended.
The concentrations of free sulfur dioxide did not show statistically
significant differences among the wine samples analyzed. However,
sample 654 was characterized by a significantly lower total SO₂ content
(P < 0.05), which could indicate a more natural winemaking process
or a more moderate use of sulfites. The measured concentrations of
free SO₂ were 24.53 ± 1.85 mg/L (wine 587), 21.33 ± 1.85 mg/L (wine
654), and 20.27 ± 1.85 mg/L (wine 886), while the total SO₂ levels
were 122.33 ± 2.14 mg/L, 87.47 ± 1.85 mg/L, and 149.33 ± 8.05 mg/L,
respectively, for the same samples. These values complied with the
French regulatory limits for red wines intended for consumption, set
at 40 mg/L for free SO₂ and ≤180 mg/L for total SO₂ [35]. Moreover,
they were consistent with those reported by Dhroso et al. [14] for red
wines produced in various regions of Albania, where free SO₂ ranged
from 12.8 to 28.6 mg/L and total SO₂ from 125 to 140 mg/L.Dry extract, alcoholic, density, brix level and sugar content:
The structural components associated with mouthfeel also showed
significant variations. Sample 587 was the richest in alcohol (12.96 ±
0.06 % v/v) and sugar (8.04 ± 0.42 g/L; P < 0.05). In contrast, wine
886 had the highest dry extract content (17.16 ± 0.01 g/L). Sample
654, which was the most appreciated, exhibited a moderate alcohol
level (12.29 ± 0.09 % v/v), lower sugar content (5.08± 0.10 g/L), and a
moderate dry extract level (15.49 g/L).Dry extract is determined by weighing the residue obtained after evaporation of the wine. It encompasses all non-volatile wine compounds, notably fixed acids, acid salts, sugars, glycerol, coloring matter, tannins, pectins, polysaccharides, proteins, and minerals [7]. Its quantification serves as a relevant indicator of wine authenticity.
In the present study, dry extract contents differed significantly among
samples (P < 0.05; Table III), with sample 587 showing the lowest
value. The dry extract values of samples 587 and 886 were below
the thresholds defined by European regulations, which recommend
a range between 17 and 30 g/L for red wines. This non-compliance
may be partially explained by their low density, measured at less than
0.99 ± 0.00 g/mL, likely due to a significant alcoholic enrichment
during the winemaking process. These values were also lower than
those reported by Dhroso et al. [14] for red wines produced in various
regions of Albania, which ranged from 15.8 to 20 g/L. Accordingly,
winemakers could improve product quality by limiting the degree of
alcohol enrichment in their winemaking techniques.
The alcohol in a wine is the result of the total or partial transformation of the sugar contained in the grape or the must and/ or of the alcoholisation in certain winemaking practices such as those that could generally be practised in Cameroon. The alcoholic strength of wine can vary according to the method of production and the country of origin. Alcohol content varies depending on the winemaking process and the geographic origin of the wine. In the present case, sample 587 had the highest alcohol concentration, while sample 654 had a more moderate level (12.29 ± 0.09). The latter was perceived as sweeter by naïve tasters, likely contributing to its overall gustatory balance. At low concentrations, ethanol provides a sweet sensation, whereas at higher levels, it generates a burning perception. Sample 587 was likely less appreciated due to a sensory imbalance related to its high alcohol content, combined with low acidity and low tannin concentration [Table 3]. Notably, a high alcohol level is not necessary to balance a wine that is poor in acidity and tannins [17]. The values obtained in this study were similar to those reported for red wines produced in different regions of Albania, ranging from 12% to 14% [14].
The alcohol in a wine is the result of the total or partial transformation of the sugar contained in the grape or the must and/ or of the alcoholisation in certain winemaking practices such as those that could generally be practised in Cameroon. The alcoholic strength of wine can vary according to the method of production and the country of origin. Alcohol content varies depending on the winemaking process and the geographic origin of the wine. In the present case, sample 587 had the highest alcohol concentration, while sample 654 had a more moderate level (12.29 ± 0.09). The latter was perceived as sweeter by naïve tasters, likely contributing to its overall gustatory balance. At low concentrations, ethanol provides a sweet sensation, whereas at higher levels, it generates a burning perception. Sample 587 was likely less appreciated due to a sensory imbalance related to its high alcohol content, combined with low acidity and low tannin concentration [Table 3]. Notably, a high alcohol level is not necessary to balance a wine that is poor in acidity and tannins [17]. The values obtained in this study were similar to those reported for red wines produced in different regions of Albania, ranging from 12% to 14% [14].
The density values recorded in this study were higher than those
reported for Kalecik Karası wines produced using cold maceration and
thermovinification techniques by Tahmaz et al. [36] , which ranged
between 0.9878 and 0.9883 g/cm³ (at 20°C). This was explained by
the fact that those wines had lower residual sugar contents (1.1 to 1.3
g/L) and higher alcohol contents (14.80 to 16.38 % v/v). The density
of a wine could influence the perception of the wine’s volume on the
palate.
The analysis of reducing sugars revealed a significant difference (P < 0.05) between sample 587 (8.04 ± 0.42 mg/L) and samples 654 (5.08 ± 0.10 mg/L) and 886 (5.15 ± 0.24 mg/L). The reducing sugar content of sample 587 was higher and significantly different (P < 0.05) from those of the other two samples, which were not significantly different from each other. This high concentration may indicate incomplete fermentation during the winemaking process. This residual sweetness in sample 587 could also have contributed to an unbalanced sensory perception. As pointed out by [17], excessive sugar is not necessarily beneficial for the sensory balance of a wine that is already high in alcohol. Thus, the interaction between alcohol content and residual sugars may affect the perceived taste quality, which could partly explain the lower appreciation of this sample during the sensory evaluation.
The analysis of reducing sugars revealed a significant difference (P < 0.05) between sample 587 (8.04 ± 0.42 mg/L) and samples 654 (5.08 ± 0.10 mg/L) and 886 (5.15 ± 0.24 mg/L). The reducing sugar content of sample 587 was higher and significantly different (P < 0.05) from those of the other two samples, which were not significantly different from each other. This high concentration may indicate incomplete fermentation during the winemaking process. This residual sweetness in sample 587 could also have contributed to an unbalanced sensory perception. As pointed out by [17], excessive sugar is not necessarily beneficial for the sensory balance of a wine that is already high in alcohol. Thus, the interaction between alcohol content and residual sugars may affect the perceived taste quality, which could partly explain the lower appreciation of this sample during the sensory evaluation.
Spectrophotometric analysis:
Determination of chromatic characteristics: These parameters
showed significant differences among the three wines analysed (P <
0.05; Table III). The color intensities reported by Jordi et al. [2] in
eight samples of young red Garnacha wines produced in Spain and
France ranged from 5.09 to 9.7, while hue values ranged from 0.68
to 0.86. Additionally, Miao et al. [13] reported values ranging from 1
to 9.29 for colour intensity and from 0.6 to 1.5 for hue, respectively.
The discrimination observed in the judges’ selection of the best colour
appears to be related to differences in anthocyanin concentrations as
well as to the specific proportions of coloured pigments (yellow, red,
mauve) in each sample. Sample 654, which was characterised by a
higher anthocyanin content, was preferred for its colour.Total anthocyanin contents:
The analysis of anthocyanins confirmed that sample 587 exhibited
the lowest anthocyanin concentration, with a significant difference (P
< 0.05) compared to the two other samples. The highest concentration
was observed in sample 654 (40.40 ± 2.32 mg/L), while the lowest
was recorded in sample 587 (24.57 ± 0.32 mg/L) (Table 3). These
concentrations remain well below those reported in the literature,
particularly between 903 ± 81 and 1016 ± 50 mg/L according to Remy
[37], and the value of 2.46 ± 0.09 mg cyanidin-3-glucoside/g reported
by Güngör And Türker [10]. This deficit may be attributed to the high
dilution of concentrated musts during their reconstitution in the local
winemaking process. The low anthocyanin content observed in the
samples could also be explained by the fermentation method applied
in the production of these wines: the absence of lactic acid bacteria in
the fermentation process on the one hand, and on the other hand, the
lack of whole grape addition to the imported concentrated must for
fermentation, followed by the absence of pre-fermentative freezing.
Indeed, as demonstrated by Aakriti et al. [38], pre-fermentative
freezing of grapes increases the extraction of total anthocyanins in the
must, particularly the content of peonidin-3-glucoside and malvidin-
3-glucoside, the latter of which is positively correlated with malolactic
fermentation. Thus, the addition of grapes to the must and the use
of lactic acid bacteria in the fermentation process in Cameroon
could represent variables for optimizing the quality of popular wines
intended for the Cameroonian population. As anthocyanins are the
primary pigments responsible for the coloration of grapes and wines,
their low concentration may explain the reduced visual intensity and
the lower preference expressed by the panel for sample 587.Total tannin content:
Tannin analysis showed that wine sample 587 had the lowest
tannin concentration (0.61 ± 0.00 g/L). Its concentration was
significantly different (P < 0.05) from those of samples 654 (0.97
± 0.01 g/L) and 886 (1.04 ± 0.02 g/L) [Table 3] . This difference in
tannin concentration between the samples could be explained by
the addition or absence of commercial oenological tannins during
correction (blending) in the winemaking process of each sample and/
or by the use of different qualities (various origins) and quantities of
concentrated grape must during the reconstitution by dilution of the
raw material for fermentation. The tannin concentration in sample
886 was lower than the values ranging from 3421 ± 164 to 4233 ± 102
mg/L reported in wines analyzed using the same method as in this
study [37]. Tannins contribute both positive and negative qualities
to wine, such as structure and body, but also astringency, bitterness,
and harshness when present in excess. These two types of perceptions
must be balanced to obtain a high-quality wine. This balance will
mainly depend on the quantity and quality of tannins solubilized in
the wine. This could explain the preferential choice expressed by naïve
judges regarding the dry mouthfeel (astringency) of sample 654, to
the detriment of samples 587 and 886. Indeed, tannins interact with
salivary proteins rich in proline (PRPs), leading to the perception of
dryness, roughness, and mouth puckering [39]. Moreover, the tannin
profile of wine 654 would likely be rich in procyanidins, which may
have interacted with proteins (1.21 ± 0.07 g/L), contributing to its
velvety body (as described by the “mouth-coating” terminology
used by many judges during tastings). In fact, the rigidity, size,
and stereochemistry of tannins strongly influence their affinity for
proteins: highly polymerized procyanidins and C4–C8 linkages favor
stronger interactions with proteins [40]. Similarly, Mekoue et al.
[41] demonstrated the existence of interactions between tannins and
yeast-derived products.Total phenolic compounds:
The Folin–Ciocalteu Index (FCI) and the Total Phenolic Index
(TPI) were used to quantify the overall phenolic compound content.
These two parameters showed significant variations among the three
wines, with higher values in sample 654 also the most appreciated by
consumers [Table 1] and [Figure 1] and lower values in sample 587
[Table 3]. This disparity could explain the lower overall acceptability
of the latter, as illustrated in (Figure 2) and (Table 1). Indeed, enriching
wine with phenolic compounds, particularly resveratrol (200 mg/L),
contributes to the expression of volatile aromatic compounds, while
catechins (200 mg/L) promote the expression of aromas and improve
the sensory characteristics and antioxidant capacity of wine [42].
Thus, enriching wines with these compounds could be an exploratory
alternative for improving the quality of wines produced in Cameroon.a, b, c:The same small letters associated with a given hedonic descriptor indicate that the samples do not differ significantly from each other for that descriptor (P > 0.05).
The measured values were lower than those reported by Jordi et al.
[2], which ranged from 40.65 to 46.25 absorbance units (AU) in
eight brands of dry red wines from the Garnacha grape variety. For
comparison, Yıldırım et al. [43] reported total phenolic compound
contents of 406.9 mg gallic acid equivalents per liter (mg GAE/L)
in white wines and 1787 mg GAE/L in red wines. The phenolic
content of grapes and wines varies depending on the region and may
also fluctuate from year to year. It is also well established that these
compounds are strongly influenced by terroir characteristics [44].
The low levels of anthocyanins and phenolic compounds observed in
the Cameroonian samples may thus result from substantial dilution
during the reconstitution of concentrated musts or be attributed to
the very origin of the raw materials used [1].
Total carotenoid content:
The carotenoid levels in the three wine samples were not
significantly different. The high carotenoid content of wine sample
654 would have contributed to the appreciation of its odour.
Carotenoids are precursors of odour molecules with very low
perception thresholds, including ß-ionone [45].Nutritional analysis:
Total amino acid and protein content: The total amino acid
(AA) content of wine sample 654 was significantly different (P
< 0.05) and higher than those of wine samples 587 and 886. These
differences in amino acid (AA) content among the three samples
could be explained by various factors, such as the ripeness level of
the grapes, the grape variety itself, or certain parameters related
to the processing methods applied during the elaboration of each
sample [46], as well as the enzymatic activity of bacteria during the
production process of the different samples. The total free AA content
of the must is significantly proportional to the ripeness level of the
grapes and depends on the microclimate/terroir and the soil nutrition
or vineyard management practices [47,48]. Furthermore, Alexandre
et al. [48] demonstrated a progressive release of amino acids and
peptides (ranging between 20–40 mg N/L) during the stationary
phase of alcoholic fermentation, following the activity of protease
A from Saccharomyces cerevisiae after autolysis. Moreover, the use
of diammonium phosphate in winemaking processes in Cameroon
could explain the high concentrations of total amino acids observed
in this study due to their colorimetric interference with amino acids,
which constitutes an analytical bias. Indeed, the high AA content of
sample 654 may have contributed to its better appreciation by the naïve
panelists. These results are consistent with the findings of Auriane et
al.; Samantha et al. [46,49], who demonstrated the influence of amino
acids on the sensory perception of wines; glutamic acid and proline
interact with volatile and phenolic compounds, enhancing fruity
aromatic intensity, perceived sweetness, and viscosity, while reducing
astringency and bitterness. This further highlights the importance of
selecting the origin of the must for effective quality management of
wines produced in Cameroon.Of course, the total protein contents of the three wine samples
analysed were significantly different (P < 0.05) [Table 3]. There
were higher than 12.4 ± 1.3mg/L and 36.5 ± 6.1mg/L, respectively,
for the protein fractions “chitinase and thaumatin-like”, obtained
by HPLC assay in a wine coded “Base wine CH08” by Bourse et al.
[50]. This can be explained by the different composition of a wine’s
protein pool, mannoproteins of yeast, from the residues of protein
glues used during the winemaking process and/or the extensive use
of diammonium sulphate in the winemaking process practised in
Cameroon, which causes a bias in the analysis of total proteins using
the Kjeldahl method used in this study (P < 0.05) (Table 3). Similarly,
mannoproteins were also shown to influence tannin aggregation
by delaying tannin polymerization [51] and viscosity of wines [52]
which influence the drying mouthfeel and body perception in wines.
Ascorbic acid content:
is naturally present in grapes [53] but is rapidly consumed after
the pressing stage. It is particularly added to wines that are less rich
in ascorbic acid, depending on the wine production process. Ascorbic
acid levels in wines generally vary from 50 to 150 mg/L [54], and
it is mainly used for its antioxidant capacity. The European Union
authorises it as an antioxidant additive at a maximum concentration
of 250 mg/L. The ascorbic acid levels obtained for the three wines were
significantly different. This difference in content could be explained
by the variation in temperature applied during the pasteurization of
each sample and/or by the use of different concentrations of ascorbic
acid during the technological correction (blending) operation of each
wine sample. Ascorbic acid was more concentrated in wine sample
886 and less concentrated in the least appreciated wine sample 587.
This low content could explain the lower aroma rating of sample
587, as ascorbic acid contributes to the expression of fruity aromas
in young wines without inducing undesirable reductive aromas. This
is because the addition of ascorbic acid in combination with sulphite
promotes the elimination of dissolved oxygen in wine and prevents
the oxidation of the wine’s aromatic compounds [55].Ash and fibre content:
Ash content represents the residual mineral matter in wine after
combustion of organic constituents (water, sugars, acids, etc.). It
consists of minerals (Ca, K, Mg, Fe, etc.). Ash is used in oenology
as a quantitative indicator of minerality in wine. The results of this
study showed that the content was significantly different in the three
samples, with the highest average content in the most appreciated
sample 654 and the lowest in the least appreciated sample. This
difference could be explained either by the production technique used
for each product, in particular the use or non-use of bentonite, or by
the geographical origin of the raw material used for the production of
each product [56].Fibre analysis showed that the total fibre content was significantly different in the samples (P < 0.05), with low, medium and high content respectively in wine samples 587 (0.13 ± 0.00 g/L), wine 654 (0.59 ± 0.01 g/L) and wine 886 (0.69 ± 0.01 g/L). These differences could be explained by the oenological techniques used in the production of each product (use or non-use of industrial yeast lysates) [57]. In red wine, the fibres are mainly composed of mannoproteins, polysaccharides and dietary fibres. These compounds have been shown to reduce the perception of astringency and bitterness in wine through their interaction with the wine’s tannins and to improve the stability of red wines [58]. They also add body to wine [58]. However, the dose must be moderate in order to avoid altering the colour [59]. The moderate fibre content of wine sample 654 would have contributed to the appreciation of its volume in the mouth and, consequently, to its better overall appreciation.
Relationships between the physicochemical parameters and the three wines and overall liking:
To visualize the relationships between the wines’ physicochemical
profiles and their consumer acceptance, a Principal Component
Analysis (PCA) was performed (Figure 3).The principal component analysis shows that the three wines occupy distinct positions on the plot. The most appreciated sample, wine 654, is positively associated with vectors for total acidity, total phenolic compounds, colour intensity, amino acids, anthocyanins, and the red coloured pigments. In contrast, the less-preferred wine 587 is primarily associated with alcohol content, reducing sugars, and the purple-coloured pigments. The third sample, wine 886, is distinguished by its strong association with vitamin C, higher colour
tone, and the yellow-coloured pigments. The analyse revealed that
wine sample 587 would be less appreciated because of its high content
of mauve coloured chillies, alcohol and reducing sugars, which would
be the cause of its sensory imbalance and its less appreciated colour.
This analysis partially corroborates that of [17], who explained that
“you don’t need a lot of alcohol to balance a wine with low acidity and
low tannin”. We could also add that there is no need for too much sugar
to balance a wine with low acidity and too much alcohol, according
to the results of this study. On the other hand, the high levels of total
amino acids, total phenolic compounds, total anthocyanins and the
colour index in wine sample 654 would have contributed favourably
to its overall assessment.
In summary, the PCA revealed that total acidity, pH, total
phenolic content, amino acids, colour intensity, reducing sugars,
alcohol, total proteins, volatile acidity, and total SO₂ constitute the
principal physicochemical determinants influencing sensory quality.
Owing to their strong relationship with overall consumer liking, these
parameters may serve as key levers for optimizing wine quality.
Conclusion
This study successfully identified the key sensory and
physicochemical drivers of consumer acceptance for popular, locally
produced red wines in Cameroon. The findings unequivocally show
that one wine (sample 654) was significantly preferred, achieving an
acceptability index of 0.72. The preference for this wine was primarily
driven by its mouthfeel, specifically the perception of in-mouth volume
and warmth. Our analysis revealed that this superior sensory profile
was rooted in a distinct chemical signature. The accepted wine was
characterised by a balanced interplay of moderate alcohol (12.29 %),
lower residual sugar (5.08 g/L), and a crisp acidic backbone (pH 2.97,
TA 5.58 g/L). Furthermore, its robust phenolic structure evidenced
by high colour intensity, anthocyanin content (40.40 mg/L), and total
phenolic index (30.20 AU) distinguished it from the less-preferred
samples. These results represent a foundational step in the scientific
characterisation of Cameroon-produced wines. To build upon this
work and provide local wineries with more precise production
guidelines, future research should focus on a more granular analysis,
including detailed phenolic compounds and organic acid profiling,
as well as characterisation of the volatile aromatic compounds that
contribute to the overall sensory experience. This will allow for the
development of targeted oenological practices tailored to the specific
palate of the Cameroonian consumer.
Acknowledgments
The authors thank Mr. NGANDEU WEKOUE Christian, the
general director of the African Society for the Manufacturing of
Wines and Spirits (SAFVIS) for having given his agreement for the
analysis of the current oenological parameters of the samples within
his Laboratory and Mr. ENRIQUE SUAREZ, oenologue, responsible
for this laboratory for facilitation and integration into the laboratory.
They also thank Tchuenbou-Magaia Fideline Laure of the Faculty of Science and Engineering, University of Wolverhampton, UK for mineral analysis
They also thank Tchuenbou-Magaia Fideline Laure of the Faculty of Science and Engineering, University of Wolverhampton, UK for mineral analysis
Funding:
This research did not receive any specific grant from funding
agencies in the public, commercial, or not-for-profit sectors.Declarations:
The author declares no competing interests.Authors’ contributions:
KOTUE TAPTUE Charles and KANSCI Germain conceptualized
and supervised the study and were responsible for project
administration, reviewed and edited the manuscript. MBASSI
MANGA Gilbert and SAHA FEUDJO Brice were responsible for
the methodology and formal analysis. TEGUEM TCHOULEGHEU
Apollinaire was responsible for investigation, writing the original
draft and Data curation. TEGUEM TCHOULEGHEU Apollinaire
and SAHA FEUDJO Brice were responsible for software. All the
authors validated the study and MBASSI MANGA Gilbert visualized
the study. All the authors have read and agreed to the published
version of the manuscript.