
Research Article
Spectrophotometric Determination of Caffeine in Selected Pakistani Beverages
Zahid Shar*, Hadia Shoaib, Naila Anwar, Muneeba Zubair, Aisha Hussain and Khizra Khan
- Dr. M.A Kazi Institute of Chemistry University of Sindh, Jamshoro, Pakistan
*Address for Correspondence: Zahid Shar, Dr. M.A Kazi Institute of Chemistry University of Sindh, Jamshoro, Pakistan, Tel: +923337011526; E-mail: zahidshar_2009@yahoo.com
Citation: Shar Z, Chippa H, Hussain N, Arain M, Khan A, et al. Spectrophotometric Determination of Caffeine in Selected Pakistani Beverages. J Food Processing & Beverages. 2017;5(1): 4.
Copyright: © 2017 Shar Z, et al. This is an open access article distributed under the Creative Commons Attribution License, which permits unrestricted use, distribution, and reproduction in any medium, provided the original work is properly cited.
Journal of Food Processing & Beverages | ISSN: 2332-4104 | Volume: 5, Issue: 1
Submission: 25 April, 2017| Accepted: 05 September, 2017 | Published: 25 September, 2017
Abstract
Amount of caffeine in beverages gained much attention due to its various toxicological effects. However, limited data is available especially for store brands beverages. In order to assess the caffeine content, thirty different samples of soft drinks, energy drinks and tea samples were collected from Hyderabad, Pakistan. Quantification of caffeine was done by using in-house validated UV-Visible spectrophotometer. Accuracy and precision of the methods was checked by standard addition method. Tea sample (Tapal danedar) contains the highest amount of caffeine (111 μg/mL) with an average value of 89 μg/mL. Energy drinks (Mad Croc Cola) contain next higher amount of caffeine (90 μg/mL) with an average value of 47 μg/mL. The pH of all analyzed samples was found to be in the acidic range (2.88- 5.01) which is hazardous for adolescent teeth. This data will provide useful information for Pakistani regulatory authorities to set standards for additives in different types of beverages.
Keywords
Caffeine; UV-Visible Spectrophotometry; Pakistani beverages; Energy drinks
Introduction
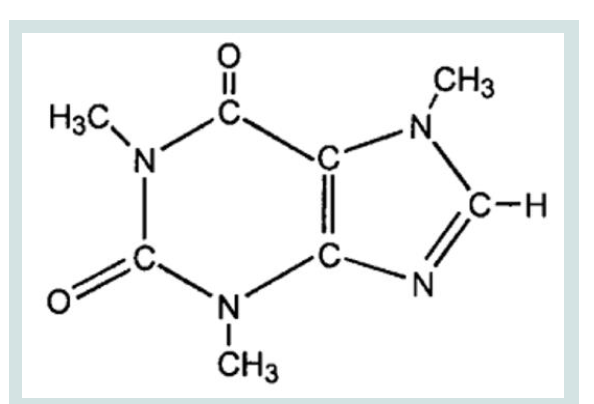
Caffeinated soft drink consumption has increased enormously in recent times, and approximately 80% of the world’s population consumes caffeinated product every day [1]. Increased popularity in caffeinated products increase the demand of energy drinks (ED) with higher amount of caffeine [2]. The attractiveness and recognition of these beverages are due to the fact that caffeine, helps in staying awake and improve mental alertness after fatigue [3,4]. Caffeine is a naturally occurring alkaloid belong to methylxanthine class and found in many different plants leaves and fruits [5-7]. IUPAC name of caffeine is 1,3,7 Trimethylpurine-2,6-dione and its structure is shown in [Figure 1].
Caffeine has drawn more attention in the past decades, due to its physiological effects beyond that of its stimulatory effect [8,9]. Caffeine directly effects central nervous, cardiovascular, gastrointestinal, respiratory, and renal systems [10-14]. Caffeine is only psychoactive substance which is widely consumed by humans [15-17]. In cases of overdosing of caffeine or in combination with alcohol, narcotics and some other drugs, produce a toxic effect, sometimes with lethal outcome [7,18-20].
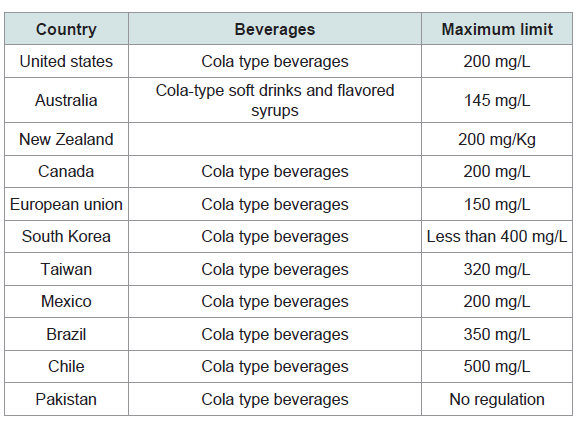
The absence of regulatory oversight has resulted in aggressive marketing of energy drinks with higher amount of caffeine, targeted primarily toward young males, for psychoactive, performance enhancing and stimulant purposes [1]. There are increasing reports of caffeine intoxication from energy drinks, and it seems likely that problem with caffeine dependence increasing day by day [21]. In children and adolescents who are not habitual caffeine users, vulnerability to caffeine intoxication may be markedly increased due to an absence of pharmacological tolerance [22]. Several studies suggest that energy drinks may serve as a gateway to other forms of drug dependence [23,24]. Due to its toxicological effects, caffeine regulation in soft drinks is gaining importance (aqsa, 2015) and many countries have already set the maximum limits in different kinds of beverages [24-34] (Table 1).
The energy drinks like ‘Red Bull’ and ‘Sting’ by PepsiCo are emerging industry in Pakistan [35]. Energy drinks are consumed by all age group but the most vulnerable to its use and ill effects are adolescents and young adults. This could be potentially a disastrous public health issue in a country like Pakistan where adolescents and young adults make the majority of the population. There is increasing interest regarding the potential health effects of energy drink (ED) consumption [35]. The aim of the present study was to investigate the caffeine content in different kinds of beverages and their pH levels available in Pakistan.
Materials and Methods
Chemicals and instrumentation
All reagents used in this study were of analytical or HPLC grade and all solutions were prepared by using disttled water. Caffeine standard was purchased from Sigma-Aldrich (Sigma-Aldrich Chemie GmbH Munich, Germany). A Perkin Elmer (Germany) double-beam UV/VIS spectrophotometer with 1-cm matched quartz cells was used for all absorbance measurements. A pH-meter, Thermo Orion (Thermo scientific fisher, USA), with combined electrodes was employed for measuring pH values. Analytical balance (Kern and sohn, GmbH, Germany) was used for weighing purpose throughout the study. Bath sonicator(Fisher scientific, UK) was used for sonication purposes.
Wavelength selection
Wavelength at which caffeine absorb maximum was determined by scanning the range of 120-400 nm. Wavelength at which Caffeine absorb maximum was found to be 271 nm, which was selected for further analysis, which is same as reported by other authors [36,37].
Preparation of standards
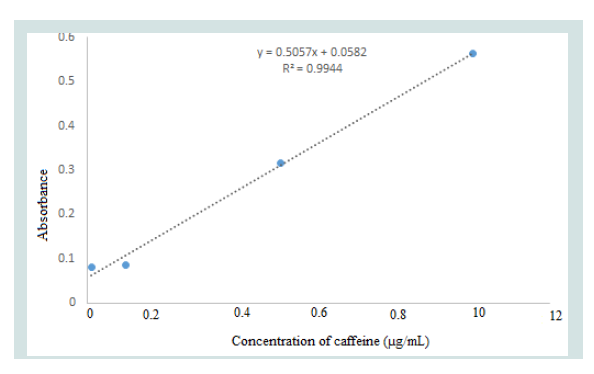
Caffeine stock standard solution of 500 μg/mL was prepared by dissolving 0.05 gram of caffeine standard obtained from Sigma- Aldrich (Sigma-Aldrich, Chemie GmbH Munich, Germany)in 80 mL distilled water and sonicated for 10 min. Then solution was transferred to 100 mL volumetric flask and the volume was completed to mark by distilled water. The stock solution was stored in dark place at +4°C. Working standard solutions of 0.01, 0.1, 0.5, 1, 10 μg/mL were prepared by suitable dilution of stock solution. Calibration curve was obtained by plotting absorbance versus standard concentration of caffeine (Figure 2).
Sampling and sample preparation
Thirty different kinds of carbonated drinks including regular and diet cola, energy drinks and tea samples were purchased from local supermarkets of Hyderabad, Pakistan. Once bottles were opened, the drinks were degassed by sonication, homogenized and filtered. Then each sample was filtered through a 0.45 μm syringe filter with a 5 mL syringe. Filtered drink sample of one millilitre was diluted with hundred millilitre of distilled water.
Two grams of tea samples were weighed and put into 250 mL beakers. Hundred millilitre of boiling distilled water was added and let to stand for five minutes with stirring; the solution was cooled and filtered into conical flasks. One millilitre of filtrate were pipetted into clean 100 mL of volumetric flasks and made to the mark with the distilled water. The samples were filtered through 0.45 μm syringe filter. Caffeine content in each sample was determined by using UV-Visible spectrophotometer.
Spiking
Known amount of standard (10 μg/mL) was added to different matrix (carbonated drink, energy drink and tea) in order to check the accuracy and precision of the method.
Detection and quantification limits
Limit of detection and limit of quantification were calculated by using calibration curve method based on standard deviation of the response and the slope value as follows

Results and Discussion
Method validation
Method performance characteristics such as linearity, accuracy and precision, limit of quantification (LOQ), limit of detection (LOD), and specificity were evaluated according to European Union guidelines [38]. The method was found to be linear in the range of 0.01-10 μg/mL in both spiked feed extract as well as in pure solvent, which shows that this method is valid in determining the low levels of the caffeine in beverages. Calibration equation with R2 values for caffeine is given in (Figure 2).
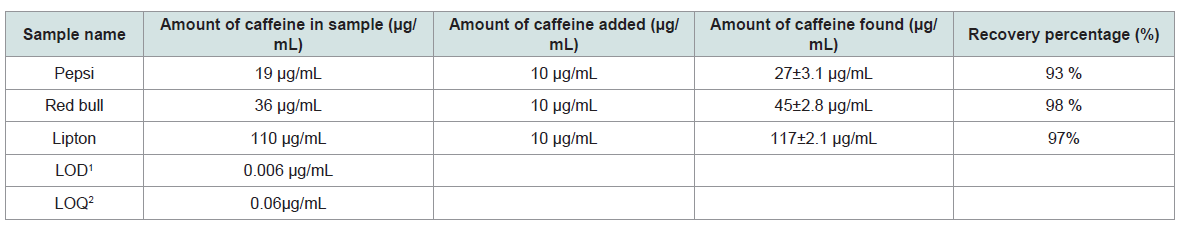
Recoveries and precision (repeatability, expressed as relative standard deviation (RSD%) were determined by analyzing spiked samples in triplicate at the spiking levels of 10 μg/mL Recoveries in the range of 93-98% with RSDs ( 1.5%) were obtained.
Limit of quantification (LOQ) and limit of detection (LOD) were calculated from calibration curve method by using equation 1 and 2. LOD and LOQ values were found 0.006 μg/mL, 0.06 μg/mL respectively (Table 2). The specificity of the method was tested by the analysis of blank samples, No any peak were observed in beverages, indicating that there were no matrix compounds that might give a false positive signal in the samples.
Determination of caffeine
The validated method was used to determine the concentration of caffeine in real beverages samples (carbonated soft drinks, energy drinks and different kinds of tea). The highest caffeine concentration(111 μg/mL) was found in tea sample brand name Tapal Danedar (Table 3).
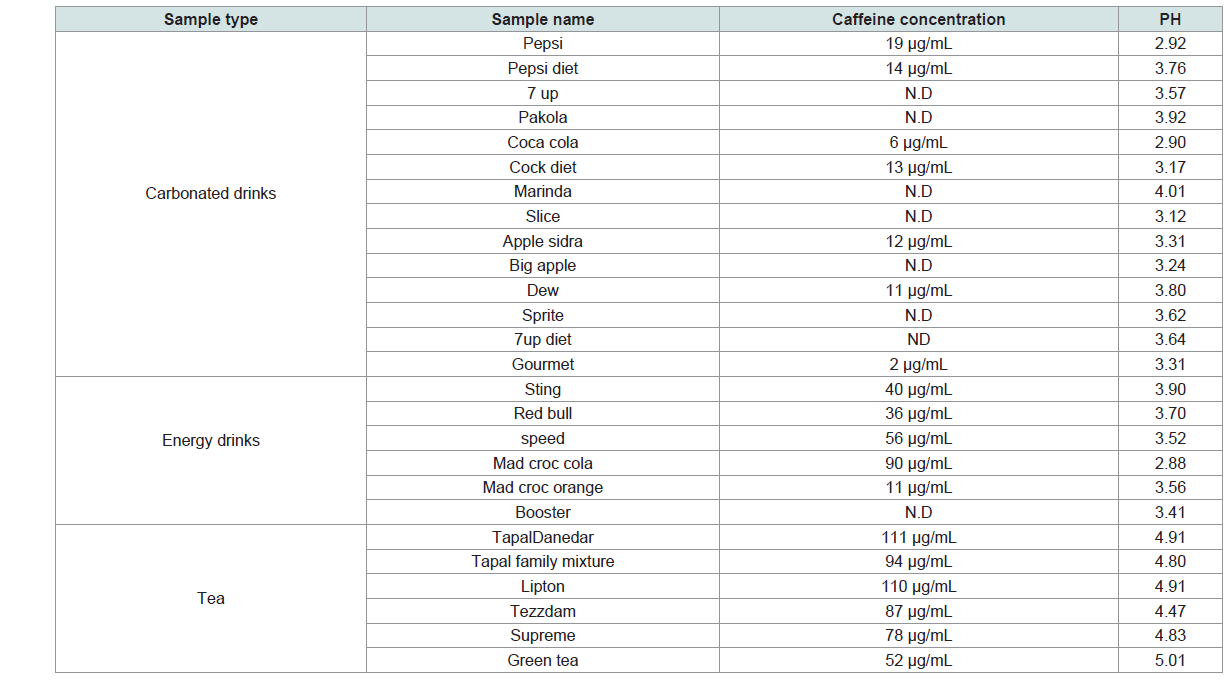
Caffeine content in tea depends upon the environmental conditions during the growth of the tea plant and type of species [12]. Lowest concentration of caffeine was found in green tea sample 52 μg/mL as show in Table 3. The concentration of caffeine in tea samples obtained in present study was much lower than the values reported from the Sudanese tea samples [36]. This lower value might be of different plant species [12].
The next higher concentration of caffeine 90 μg/mL was found in energy drink sample brand name mad croc cola. It was observed that the caffeine concentrations in energy drinks is higher than the carbonated soft drinks, since their mean concentrations level were of 47 μg/mL and 11 μg/mL respectively. Our results of caffeine content in different beverages samples are similar to another study conducted on carbonated drinks [39].
The pH of carbonated soft drinks and tea samples ranged from 2.88 to 5.01. Carbonated soft drinks have a relatively low pH which makes soft drinks not suitable for people with stomach ulcers. Low pH has effects on the enamel which can affect teeth development in infants [40]. In vitro studies have shown that soft drinks with low pH can cause dental erosion in permanent and deciduous teeth [41]. Decrease in pH has also been associated with increase in dental erosion [42]. Low pH is as a result of addition of acidulants such as phosphoric acid and citric acid .The acid is used in soft drink product as a key factor in the taste profile of a drink as it balances the sweetness and helps to inhibit microbial growth [43,44].
Conclusion
UV-Visible method for quantification of caffeine in beverages was found to be simple, precise, sensitive and accurate. In spite of the number of drink samples analyzed is small, the data presented in this study gave a preliminarily information about caffeine levels in tea, carbonated and energy drinks frequently consumed in Pakistan. However, the energy drinks contained appreciable levels of caffeine, hence should be avoided by children at an early age to avoid caffeine dependence. The pH of the drinks was low. This is attributed to the addition of acidulants which makes carbonated drinks and energy drinks harmful to infants and people suffering from ulcers. Despite the fact that caffeine is a permitted food additive, excessive use should be minimized.
References
- Ogawa N, Ueki H (2007) Clinical importance of caffeine dependence and abuse. Psychiatry Clin Neurosci 61: 263-268.
- Reissig CJ, Strain EC, Griffiths RR (2009) Caffeinated energy drinks--a growing problem. Drug Alcohol Depend 99: 1-10.
- Powers SK, Dodd S (1985) Caffeine and endurance performance. Sports Med 2: 165-174.
- Smit HJ, Rogers PJ (2002) Effects of ‘energy’drinks on mood and mental performance: critical methodology. Food Qual Prefer 13: 317-326.
- Matissek R (1997) Evaluation of xanthine derivatives in chocolate-nutritional and chemical aspects. Zeitschrift für Lebensmitteluntersuchung und-Forschung A 205: 175-184.
- Nour V, Trandafir I, Ionică ME (2010) Chromatographic determination of caffeine contents in soft and energy drinks available on the Romanian market. Sci Study Res Chem Chem Eng Biotechnol Food Ind 11: 351-358.
- Wanyika HN, Gatebe EG, Gitu LM, Ngumba EK, Maritim CW (2010) Determination of caffeine content of tea and instant coffee brands found in the Kenyan market. African J Food Sci 4: 353-358.
- Kalmar JM, Cafarelli E (1999) Effects of caffeine on neuromuscular function. J Appl Physiol (1985) 87: 801-808.
- Quinlan PT, Lane J, Moore KL, Aspen J, Rycroft JA, et al. (2000) The acutephysiological and mood effects of tea and coffee: the role of caffeine level. Pharmacol Biochem Behav 66: 19-28.
- Costill D, Dalsky GP, Fink WJ (1978) Effects of caffeine ingestion on metabolism and exercise performance. Med Sci Sports 10: 155-158.
- Graham DM (1978) Caffeine--its identity, dietary sources, intake and biological effects. Nutr Rev 36: 97-102.
- Heckman MA, Weil J, Gonzalez de Mejia E (2010) Caffeine (1, 3, 7trimethylxanthine) in foods: a comprehensive review on consumption, functionality, safety, and regulatory matters. J Food Sci 75: R77-R87.
- Nehlig A, Daval JL, Debry G (1992) Caffeine and the central nervous system: mechanisms of action, biochemical, metabolic and psychostimulant effects. Brain Res Brain Res Rev 17: 139-170.
- Smith A (2002) Effects of caffeine on human behavior. Food Chem Toxicol 40: 1243-1255.
- Lucas M, Mirzaei F, Pan A, Okereke OI, Willett WC, et al. (2011) Coffee, caffeine, and risk of depression among women. Arch Intern Med 171: 1571-1578.
- Sawynok J (2011) Caffeine and pain. Pain 152: 726-729.
- Scholey AB, Kennedy DO (2004) Cognitive and physiological effects of an “energy drink”: an evaluation of the whole drink and of glucose, caffeine and herbal flavouring fractions. Psychopharmacology (Berl) 176: 320-330.
- Mamina EA, Pershin VF (2002) Structure of chemical compounds, methods of analysis and process control HPLC determination of caffeine in biological fluids in the presence of other purine derivatives. Pharma Chem J 36: 213-215.
- Tavallali H, Sheikhaei M (2009) Simultaneous kinetic determination of paracetamol and caffeine by H-point standard addition method. African J Pure Appl Chem 3: 011-019.
- Yuhas B (2002) Determination of Caffeine Content in Beverages with HPLC.
- Ascherio A, Zhang SM, Hernan MA, Kawachi I, Colditz GA, et al. (2001) Prospective study of caffeine consumption and risk of Parkinson’s disease in men and women. Ann Neurol 50: 56-63.
- Usman A, Jawaid A (2012) Hypertension in a young boy: an energy drink effect. BMC Res Notes 5: 591.
- Daly JW, Fredholm BB (1998) Caffeine--an atypical drug of dependence. Drug Alcohol Depend 51: 199-206.
- Strain EC, Mumford GK, Silverman K, Griffiths RR (1994) Caffeine dependence syndrome: evidence from case histories and experimental evaluations. JAMA 272: 1043-1048.
- ANZFA (2000) Report from the expert working group on Safety aspects of dietary caffeine.
- Canada H (2009) It’s your health-caffeine.
- CFDA (2008) Canada Food and Drugs Act, Part B, Division 16, Table VIII, Item C.1. Channel Check. Bev Spect 6: 14-17.
- CMH (1997) Chile’s Ministry of Health. Approval regualtion of sanitation in food. DTO977.
- E.U (2002) Commission directive 2002/67/EC of 18 July 2002 on the labeling of foodstuffs containing quinine, and of foodstuffs containing caffeine.
- FDA (2003) Food and drug administration. U.S. code of federal regulations.
- KFDA (2006) Korea Food and Drug Administration. Korea Nutrition Society.
- RSCM (2006) Regulations of Sanitary Control of Mexico. Secretary of Health Mexico.
- SVNA (2005) Sanitary Vigilance Natl Agency 2005. Brazil Ministry of Health. Directed Management Resolution-RDCN° 273.
- TLGFS (2008) Taiwan’s Law Governing Food Sanitation. Scope of use and quantity limit of food additive caffeine. Class 11 Food Flavoring Nr 052.
- Brandsynario (2015) Beverage consumption in pakistan.
- Ali MM, Eisa M, Taha MI, Zakaria BA, Elbashir AA (2012) Determination of caffeine in some sudanese beverages by high performance liquid chromatography. Pakistan J Nutr 11: 336-342.
- Mufakkar M, Khan MH, Ahmad S, Ali F, Mahmood T (2014) Estimation of caffeine in different brands of soft drinks by ultraviolet spectroscopy. Int J Sci Res 4: 01-03.
- Commission E (2002) Commission Decision of 12 August 2002 implementing council directive 96/23/EC concerning the performance of analytical methods and the interpretation of results. Off J Eur Communities L 221.
- Khan K, Naeem M, Arshad MJ, Asif M (2006) Extraction and Chromatographic determination of caffeine contents in commercial beverages. J Appl Sci 6: 831-834.
- Wongkhantee S, Patanapiradej V, Maneenut C, Tantbirojn D (2006) Effect of acidic food and drinks on surface hardness of enamel, dentine, and toothcoloured filling materials. J Dent 34: 214-220.
- Attin T, Weiss K, Becker K, Buchalla W, Wiegand A (2005) Impact of modified acidic soft drinks on enamel erosion. Oral Dis 11: 7-12.
- Rytömaa I, Meurman JH, Koskinen J, Laakso T, Gharazi L, et al. (1988) In vitro erosion of bovine enamel caused by acidic drinks and other foodstuffs. Scand J Dent Res 96: 324-333.
- Liewen MB, Marth EH (1985) Growth and inhibition of microorganisms in the presence of sorbic acid: a review. J Food Prot 48: 364-375.
- Stead D (1993) The effect of hydroxycinnamic acids on the growth of winespoilage lactic acid bacteria. J Appl Bacteriol 75: 135-141.