
Research Article
*Corresponding author: Lili He, 100 Holdsworth Way Chenoweth, Department of Food Science, University of Massachusetts Amherst, Amherst, MA 01003, USA, Tel: 413-545-5847; Fax: 413-545-1262; E-mail: lilihe@foodsci.umass.edu
Citation: Zheng J, Fang X, Xiao H, He L. Rapid Quantification of Nobiletin and Tangeretin in Citrus Peel Extractions by Raman Spectroscopy. J Food Processing & Beverages. 2013;1(1): 4.
Copyright © 2013 Lili He. This is an open access article distributed under the Creative Commons Attribution License, which permits unrestricted use, distribution, and reproduction in any medium, provided the original work is properly cited.
Journal of Food Processing & Beverages | ISSN: 2332-4104 | Volume: 1, Issue: 1
Submission: 09 May 2013 | Accepted: 11 June 2013 | Published: 17 June 2013
Raman spectroscopy is one of the vibrational spectroscopies that measure the shift in the wavelength of the photons of a laser beam interacted with sample molecules. The shift in energy gives information about the vibration modes of the molecules [9]. It has been applied widely in molecular characterization and identification [10,12]. The chemical signatures of samples can be measured nondestructively and rapidly within few seconds. In this study, Raman spectroscopy was applied for quantification of nobiletin and tangeretin in orange peels, which was compared with a conventional HPLC method.
Chemical standards and samples to be tested:
Quantification by HPLC
Raman analysis
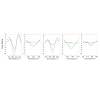
After carefully comparing between the second derivative Raman spectra of nobiletin and tangeretin, differences were found in the wavelength ranges of 1631~1659, 1270~1288, 1238~1267, 1170~1192, and 791~816cm-1 (Figure 4). The wavelength in the ranges of 1238~1267, 1170~1192, and 791~816cm-1 showed the same variation tendency that signals for tangeretin (red line) were much stronger than those of nobiletin (purple), meanwhile the wavelength in the ranges of 1631~1659 and 1270~1288 showed the opposite tendency. These peaks were very critical to discriminate tangeretin and nobiletin. Two samples exhibited peaks with intensity in between two standards, which indicates the presence of both molecules in the samples.
Rapid Quantification of Nobiletin and Tangeretin in Citrus Peel Extractions by Raman Spectroscopy
Jinkai Zheng1, Xiang Fang1.2, Hang Xiao1 and Lili He1*
- 1Department of Food Science, University of Massachusetts, Amherst, MA, USA
- 2College of Food Science, South China agricultural university, Guangzhou, Guangdong, China
*Corresponding author: Lili He, 100 Holdsworth Way Chenoweth, Department of Food Science, University of Massachusetts Amherst, Amherst, MA 01003, USA, Tel: 413-545-5847; Fax: 413-545-1262; E-mail: lilihe@foodsci.umass.edu
Citation: Zheng J, Fang X, Xiao H, He L. Rapid Quantification of Nobiletin and Tangeretin in Citrus Peel Extractions by Raman Spectroscopy. J Food Processing & Beverages. 2013;1(1): 4.
Copyright © 2013 Lili He. This is an open access article distributed under the Creative Commons Attribution License, which permits unrestricted use, distribution, and reproduction in any medium, provided the original work is properly cited.
Journal of Food Processing & Beverages | ISSN: 2332-4104 | Volume: 1, Issue: 1
Submission: 09 May 2013 | Accepted: 11 June 2013 | Published: 17 June 2013
Abstract
Nobiletin and tangeretin were the most abundant polymethoxyflavones in citrus fruits, especially in the peels. Quantification of these two flavones in citrus peels was traditionally conducted by using High-Performance Liquid Chromatography (HPLC) method. In this study, Raman spectroscopy was utilized to achieve rapid quantification of nobiletin and tangeretin in citrus peels after simple solvent extraction and chromatographic separation. Powdered sample were examined nondestructively without further sample preparation. The relative nobiletin contents in the sample after solvent extraction and the sample after chromatographic separation were estimated to be 35.1±0.8 % and 91.7±0.9 %,respectively, in a few seconds. The Raman result was comparable to the HPLC result (42.4±2.2 % and 91.1±0.5 %). This study demonstrated the great capacity of Raman spectroscopy to simply, rapidly and accurately quantify the molecular content in a mixture.Keywords
Nobiletin; Tangeretin; SERS; HPLC; Rapid quantificationIntroduction
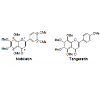
Polymethoxyflavones are a unique class of flavonoid compounds, and almost exclusively exist in the citrus genus, particularly in the peels of sweet oranges and mandarin oranges. They have been of particular interest due to their broad spectrum of biological activity, such as anti-inflammatory, antitumor, antioxidant, and antiviral properties [1,2]. Nobiletin and tangeretin are the most abundant polymethoxyflavones in citrus fruits [3], and they were fortified in citrus juice to enhance its quality [4].Nobiletin and tangeretin share very similar physicochemical properties, such as polarity, solubility, chemical stability due to their similar structures (Figure 1), which resulted in the difficulty of their individual isolation from Citrus fruits. Crude nobiletin and tangeretin in mixture can be extracted from citrus peels using different organic solvents [5]. They were used as starting materials for the synthesis of demethylated derivatives [6]. In order to obtain high purity of nobiletin or tangeretin, a normal phase silica column was used previously [7]. To determine the purity of nobiletin and tangeretin, High-Performance Liquid Chromatography (HPLC) was traditionally adopted as the most common and effective method for content analysis [8]. However, HPLC analysis usually requires tedious sample preparation and analysis steps which are tedious and time consuming. Therefore, a more rapid and convenient method is needed for purity evaluation of nobiletin and tangeretin.
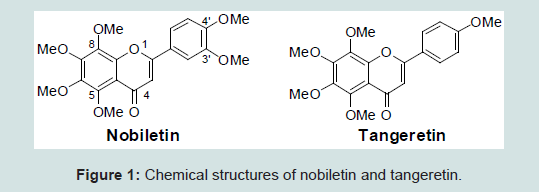
Figure 1: Chemical structures of nobiletin and tangeretin.
Materials and Methods
Standard nobiletin and tangeretin (Figure 1) were bought from Quality Phytochemicals, LLC (New Jersey, USA). Their purities were > 98% based on HPLC analysis, and their chemical structures were previous elucidated by MS and NMR spectra [13,14] (Figure 1).
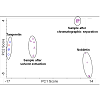
Crude nobiletin and tangeretin sample was extracted from citrus peels using different organic solvents. Air dried citrus peel (1000 g) was pulverized and extracted exhaustively with hexane (5.0 L), and then treated with 100 mL of 10% sodium hydroxide solution for 2.0 hours. The mixture was then extracted with 500 ml diethyl ether. The ether extract was washed with water and concentrated. Then the crude sample was separated into four fractions (Fractions 1 to 4) on a normal phase silica gel (300-400 mesh) column using a step gradient elution with CHCl3-petroleum ether (0-100%) and then with MeOH-CHCl3 (0-100%). Fraction 3 (eluted by MeOH-CHCl3, 2%) contained most of nobiletin monitored by thin-layer chromatography. The samples after diethyl ether extraction (sample after solvent extraction for short) and the enriched fraction 3 after chromatographic separation (sample after chromatographic separation for short) were freeze-dried and analyzed by HPLC and Raman.
HPLC Analysis of samples
The CoulArray® HPLC system (Chelmsford, MA, USA) consisted of a binary solvent delivery system (model 584), an auto-sampler (model 542), an Ascentis RP-Amide reversed-phase HPLC column (15 cm×4.6 mm id, 3 μm) (Sigma-Aldrich, MO, USA), and a UV detector (model 526) (Waters, Milford, MA, USA). Twenty mg of test samples were dissolved in DMSO and then diluted 500 times with 50% methanol for HPLC analysis. Flow rate was 1.0 mL/min. The UV detection wavelength was set at 330 nm. The mobile phases consisted of A (75% water, 20% acetonitrile, 5% tetrahydrofuran and 25 mM ammonium acetate) and B (50% water, 40% acetonitrile, 10% tetrahydrofuran and 50 mM ammonium acetate). The pH of both mobile phases was adjusted to 3.00 using trifluoroacetic acid. The temperature of auto sampler was set to 4°C. The injection volume was 10 μL. Instrument control and data processing were performed with CoulArray 3.06 software [15].
Raman analysis of samples
Five mg of sample powders were placed in 96-well plate for Raman analysis without pretreatment. A DXR Raman microscope (Thermo Scientific, Madison, WI) with a 780 nm excitation laser and a 20X objective was used, and the resulting laser spot diameter is about 2 mm with specific resolution of 5 cm-1. Spectra were collected with 1 s scanning time and 24 mW laser power in the region of 200-3400 cm-1.
The spectral data were analyzed by Principal Component Analysis (PCA) using the TQ analyst software v8.0 (Thermo Fisher Scientific Inc. WI, US). The PCA procedure reduces a multidimensional data set to its most dominant features, removes random variation, and retains the Principal Components (PCs) that capture the variation between sample treatments. The information provided by the PCA shows the variance within a class and between different classes. The PC score reveals the percentage of data variance. A higher percentage indicates more data variance within the PCA model. Generally speaking, if two data clusters (classes) don’t overlap, then it means they are significantly different. Before analyzing by PCA, spectra were pre-processed using second derivative transformation to separate overlapping bands and remove baseline shifts [16].
Results
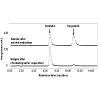
Twenty mg of test samples were dissolved in DMSO (about 50 mM), and then diluted 500 times with 50% methanol for HPLC analysis. To obtain the best separation, optimal elution condition was found to be a fixed gradient with 75% mobile phase B for 15 min. Baseline separation of nobiletin and tangeretin was obtained under this elution condition, and their retention times were 6.96 and 10.84 min, respectively. The standard curves were constructed by plotting concentrations (x axis, μM) vs. peak areas (y axis, μC). For nobiletin and tangeretin standards, linear calibration curves (correlation coefficient, r2 > 0.9990) can be obtained within the range of 5-100 μM (5, 10, 50, and 100 μM). Their regression equations were as follows: y = 0.0745x (r2 = 0.9991), y = 0.0707x (r2 = 0.9994), respectively. The HPLC profiles of test samples were shown in (Figure 2). Quantification was performed by comparing their peak areas with the standard stock solutions of series concentrations. The relative nobiletin contents in the samples after solvent extraction and the samples after chromatographic separation were 42.4 ± 2.2 % and 91.1 ± 0.5 %, respectively (Figure 2).
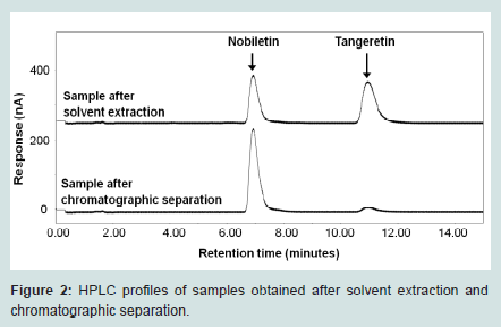
Figure 2: HPLC profiles of samples obtained after solvent extraction and chromatographic separation.
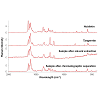
Five mg of powdered standards and test samples were directly used for the Raman analysis. Average secondary derivative Raman spectra (N = 5) are shown in (Figure 3). The Raman spectra of all samples shared major bands in the range of 1500~1700 and 1100-1400 cm-1 which are mainly assigned to C=O stretch, C2 =C3 Stretch, ring C-C and C-H bend and stretch [17,18] (Figure 4).
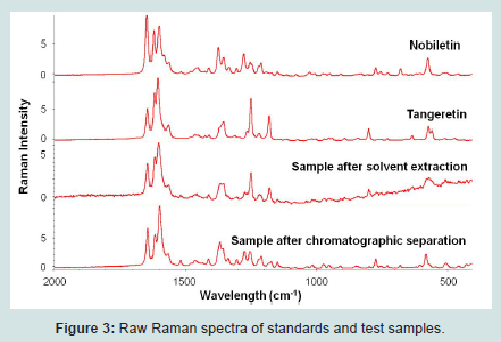
Figure 3: Raw Raman spectra of standards and test samples.
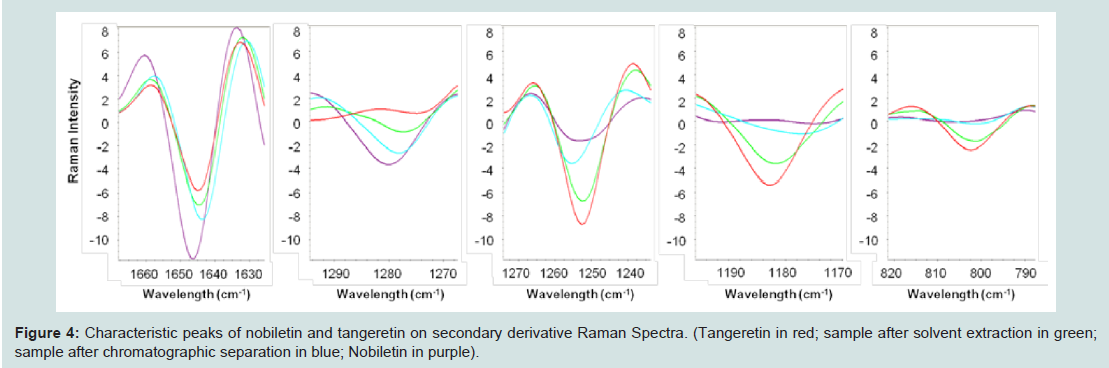
Figure 4: Characteristic peaks of nobiletin and tangeretin on secondary derivative Raman Spectra. (Tangeretin in red; sample after solvent extraction in green; sample after chromatographic separation in blue; Nobiletin in purple).
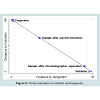
The relative differences in the peak intensity can be used for content analysis of nobiletin and tangeretin in the samples.In agreement with Raman spectra, significant separations (Figure 5) were found between the data points of tangeretin and nobiletin with the aid of PCA. The sample after solvent extraction and sample after chromatographic separation were also clear separated fromstandards in PCA plot, which suggests that there is a possibility of quantification for content analysis by Raman analysis. The plot of distances to standards was used to analyze their contents insamples (Figure 6). Data points of two standards and two samples were plotted with a straight line. Sample after solvent extraction and sample after chromatographic separation were right located in this line, suggesting these two samples were mainly composed by nobiletin and tangeretin. The content of nobiletin and tangeretin inthe two samples could be calculated by comparing the distance both to nobiletin and tangeretin standards. The relative content of nobiletin in sample after solvent extraction and sample after chromographic separation was estimated as 35.1 ± 0.8 % and 91.7 ± 0.9 %. The results were comparable to the HPLC result (42.4 ± 2.2 % and 91.1 ± 0.5 %). No statistical difference between Raman and HPLC results (p value > 0.1) by analysis of variance (Figures 5 and 6).
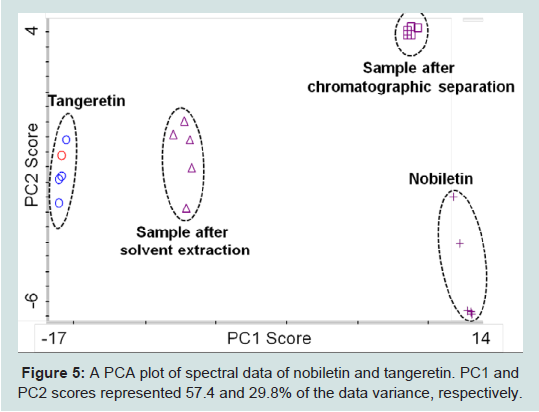
Figure 5: A PCA plot of spectral data of nobiletin and tangeretin. PC1 andPC2 scores represented 57.4 and 29.8% of the data variance, respectively.
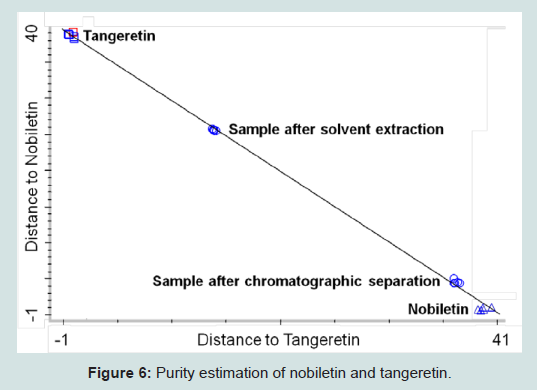
Figure 6: Purity estimation of nobiletin and tangeretin.
Conclusion
The content of orange peel extraction has been successfully analyzed by HPLC and Raman spectroscopy. Compared with HPLC method, Raman spectroscopic method shows the advantages in following aspects: the test samples for Raman could be in powder form and no further preparation is needed; samples can be measured non-invasively and within a few seconds, quantification of multicomponents relies on their intrinsic chemical signatures, therefore no optimization or standard curve is needed. In this study, Raman analysis has been proved to be a rapid and effective method for determining content of nobiletin and tangeretin in a mixture form. This method also can be extended to other content analysis of simple mixtures.References
- Manthey JA, Grohmann K, Guthrie N (2001) Biological properties of citrus flavonoids pertaining to cancer and inflammation. Curr Med Chem 8: 135-153.
- Middleton E Jr, Kandaswami C, Theoharides TC (2000) The effects of plant flavonoids on mammalian cells: implications for inflammation, heart disease,and cancer. Pharmacol Rev 52: 673-751.
- Li S, Lambros T, Wang Z, Goodnow R, Ho C (2007) Efficient and scalable method in isolation of polymethoxyflavones from orange peel extract by supercritical fluid chromatography. J Chromatogr B Analyt Technol Biomed Life Sci 846: 291-297.
- Miyagi K, Wada S, Fujise T, Koga N, Wada K, et al. (2009) Quality improvement of Shiikuwasha (Citrus depressa Hayata) juice by combining anion exchange treatment and insoluble pulp addition. Nippon Shokuhin Kagaku Kogaku Kaishi 56: 193-199.
- Raman G, Jayaprakasha GK, Cho M, Brodbelt, J, Patil B (2005) Rapid adsorptive separation of citrus polymethoxylated flavones in non-aqueous conditions. Sep Purif Technol 45: 147–152.
- Li S, Wang Z, Sang S, Huang MT, Ho CT (2006) Identification of nobiletin metabolites in mouse urine. Mol Nutr Food Res 50: 291-299.
- Wang D, Wang J, Huang X, Tu Y, Ni K (2007) Identification of polymethoxylated flavones from green tangerine peel (Pericarpium Citri Reticulatae Viride) by chromatographic and spectroscopic techniques. J Pharm Biomed Anal 44: 63-69.
- Bansal V (2010) High performance liquid chromatography: a short review. Journal of Global Pharma Technology 2: 22-26.
- Kudelski A (2008) Raman spectroscopy for chemical analysis: Raman spectroscopy as a promising tool for chemical analysis. GIT Laboratory Journal Europe 12: 18-20.
- Harvey SD, Vucelick ME, Lee RN, Wright BW (2002) Blind field test evaluation of Raman spectroscopy as a forensic tool. Forensic Sci Int 125: 12-21.
- Suzuki EM, Carrabba M (2001) In situ identification and analysis of automotive paint pigments using line segment excitation Raman spectroscopy: I.Inorganic topcoat pigments. J Forensic Sci 46: 1053-1069.
- Rodger C, Broughton D (1998) The in-situ analysis of lipsticks by surface enhanced resonance Raman scattering. Analyst 123: 1823-1826.
- Li S, Pan MH, Lai CS, Lo CY, Dushenkov S, et al. (2007) Isolation and syntheses of polymethoxyflavones and hydroxylated polymethoxyflavones as inhibitors of HL-60 cell lines. Bioorg Med Chem 15: 3381-3389.
- Nielsen SE, Breinholt V, Cornett C, Dragsted LO (2000) Biotransformation of the citrus flavone tangeretin in rats. Identification of metabolites with intact flavane nucleus. Food Chem Toxicol 38: 739-746.
- Dong P, Qiu P, Zhu Y, Li S, Ho CT, et al. (2010) Simultaneous determination of four 5-hydroxy polymethoxyflavones by reversed-phase high performance liquid chromatography with electrochemical detection. J Chromatogr A 1217: 642-647.
- He L, Deen B, Rodda T, Ronningen I, Blasius T, et al. (2011) Rapid detection of ricin in milk using immunomagnetic separation combined with surfaceenhanced Raman spectroscopy. J Food Sci 76: N49-N53.
- Teslova T, Corredor C, Livingstone R, Spataru T, Birke RL, et al. (2007) Raman and surface-enhanced Raman spectra of flavone and several hydroxy derivatives. J Raman Spectrosc 38: 802-818.
- Corredor C, Teslova T, Canamares MV, Chen Z, Zhang J, et al. (2009) Raman and surface-enhanced Raman spectra of chrysin, apigenin and luteolin. Vib Spectrosc 49: 190-195.