Forensic determination of the age of a bloodstain with little temporal error can provide important information in a judicial inquiry. Atomic force microscopy could provide estimations for bloodstain ages based on temporal changes in the elasticity of red blood cells (RBCs). This technology enables RBC nano-indentations with the tip of a cantilever resulting in force measurements and high resolution mapping of nanomechanical cell properties like the Young’s modulus of elasticity.
This study applied atomic force microscopy to investigate the elasticity of randomly selected RBCs from the peripheral zone of 4- to 8-day-old bloodstains (controlled laboratory conditions). Special attention was paid to the condition of the silicon probes when continuously used to indent RBCs.
The elasticity of 6 RBCs from a 5-day-old bloodstain appeared homogenous over the cell with a mean Young’s modulus of 1.6 ± 0.4 GPa. Data spreading was for only 6.5% caused by the choice of the RBC. Upon ageing of a bloodstain, 4 to 8 days, a significant age effect was observed in RBC elasticity (4 days: 0.8 ± 0.1 GPa; 5 days: 1.7 ± 0.9 GPa; 6 days: 2.3 ± 0.6 Gpa; 7days: 4.5 ± 0.6 GPa; 8 days: 6.0 ± 1.8 GPa; probe spring constants 25.16 - 67.48 N/m). The spreading between the data (4 bloodstains; 3 RBCs/stain) enabled a bloodstain age determination with a 24 h precision only for 6- to 7-day-old stains. In other cases a 48 h temporal accuracy was obtained. The condition of the silicon tip was regularly checked using scanning electron microscopy and an increasing bluntness noticed after 4 to 6 cell indentations. A correction factor for the increase in tip radius was therefore applied for data processing. Particularly for crime scene investigations a more robust tip is required thereby increasing both precision and accuracy of the elasticity data.
Rapid Communication
Determination of the age of traces of blood at a crime scene can provide important information in a judicial inquiry. Although hyperspectral imaging (HSI) is a promising technology for age determination of bloodstains [
1] it is currently still not possible to provide an accurate determination of the age of a bloodstain with this or any other technology [
2]. Deviations of the true age of bloodstains compared to the age determined with HSI already increase within a few days (for an actual age of 2 days the absolute error is 2.7 days) [
1]
Minimally invasive force spectroscopy, an atomic force microscopy (AFM) application, may also be useful to investigate the age of a bloodstain based on mechanical properties of the red blood cells (RBCs) in the stain. Force spectroscopy is a technique that is based on nano-indentations of a material, including biological cells, resulting in small-distance force measurements and mapping of nanomechanical material properties with high resolution [
3,4]. Briefly, a cantilever with a sharp probe at the end is moved vertically towards the surface and subsequently retracted. As the tip of the cantilever further approaches the surface small-distance, attractive forces become significant. These interactions result in a “snap-tocontact” of the tip with the sample followed by a deflection away caused by repulsive, molecular electrostatic interactions. From the resulting force distance (FD) curves a material’s Young’s modulus (YM), a mechanical property that indicates the force that is needed to compress or stretch an elastic material, can be calculated. For force calculations of biological samples the Hertz model is often used (see
Equation 1) [
5,6].
In this equation, F represents the applied force (N), the tip radius (m), E the Young’s Modulus (Pa), ν the Poisson ratio and δ the deformation at maximum load (m). When the AFM force-volume (FV) imaging mode is used FD-curves can be recorded at each image pixel rendering an elasticity map and thus insight in spatial changes in cellular elasticity [
6]. More detailed information on AFM and forensic applications can be found in the review of Smijs et al. [
7].
The usefulness of AFM for detection of post-mortem temporal alterations in surface adhesive forces of red blood cells (RBCs) within a bloodstain has indeed been studied [
8]. This group of Wu et al. reported that with various environmental conditions and surfaces the adhesive forces measured for RBCs in air-dried bloodstains increased 4-fold between 5 to 15 days. This study used a silicon cantilever and the spring constant as provided by the manufacturer (0.9 N/m) [
8].
Here we report YM calculations of human RBCs in 4- to 8-dayold bloodstains based on force measurements (JPK NanoWizard ULTRA speed AFM, Berlin, Germany) using silicon probes of various stiffness (~25 to 67 N/m). The experimental conditions are schematically represented in
Diagram 1. Additionally, the need for a robust tip of sufficient hardness that can cope with increasing RBC stiffness as a function of time is illustrated.
Diagram 1: Schematic representation of the human bloodstain conditions before and during AFM measurements including an AFM height image for the selection of a RBC for further force measurements.
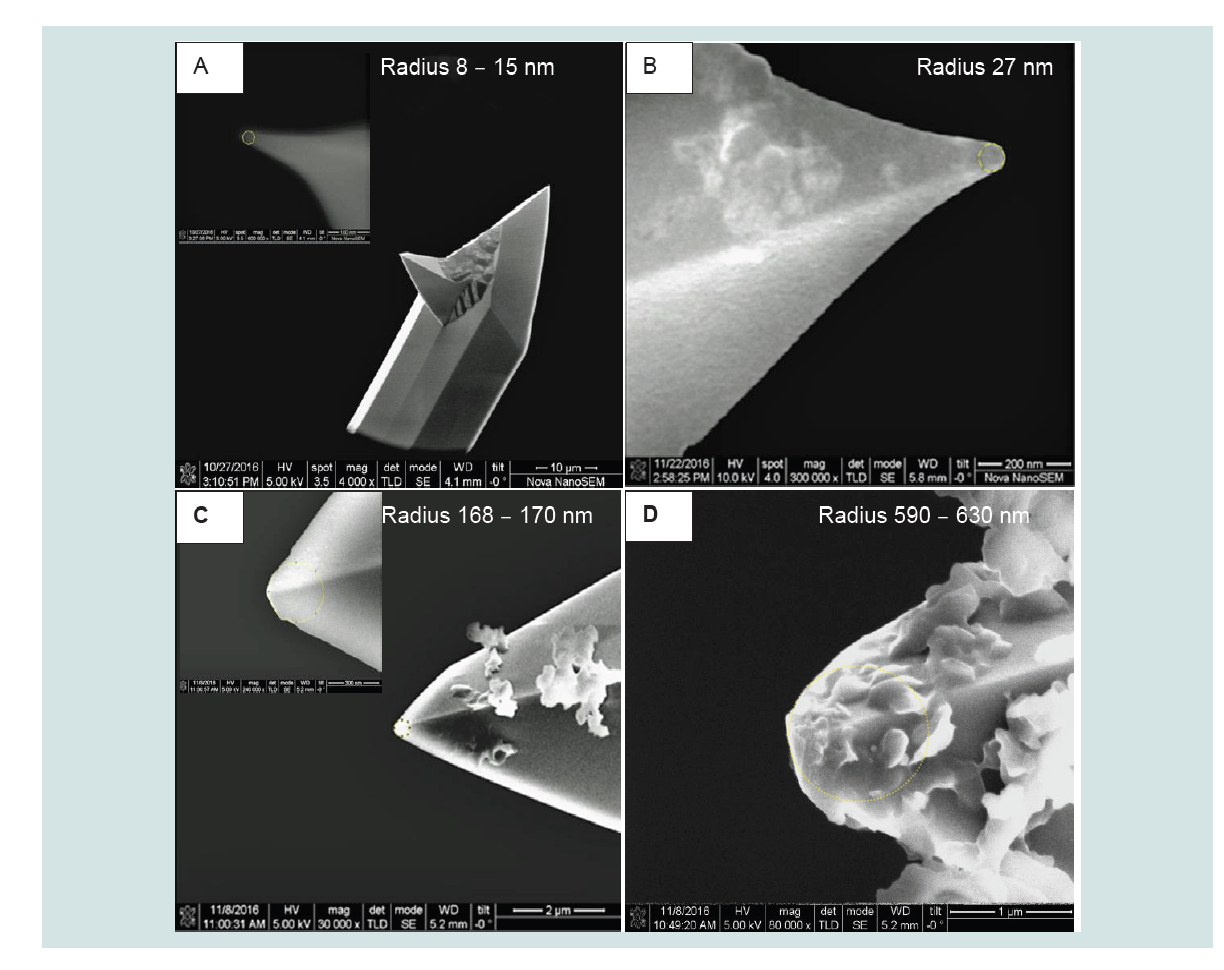
By first using a silicon tip (Olympus, with a spring constant of 38.75 N/m based on sapphire calibration) for RBC indentations in a 5-day old bloodstain we noticed with scanning electron microscopy (SEM) blunting of the tip and consequently an increase in the tip’s radius. Starting from 10 nm the radius increased to 83 nm after 4 to 6 continuous RBC indentations (using 256 x 256 pixels/elasticity map), an average maximum load of 711 nN and a single tip calibration on sapphire. An example of a FV map based on RBC nano-indentations and representative FD-curve is provided in respectively
Figures 1A and 1B. The processing of the FD-curves in order to produce RBC elasticity maps was done with JPK Data Processing Software (Berlin, Germany) and the Hertz model with a tip radius corrected for blunting (using SEM images analyzed with ImageJ Software) (
Figure 1C).
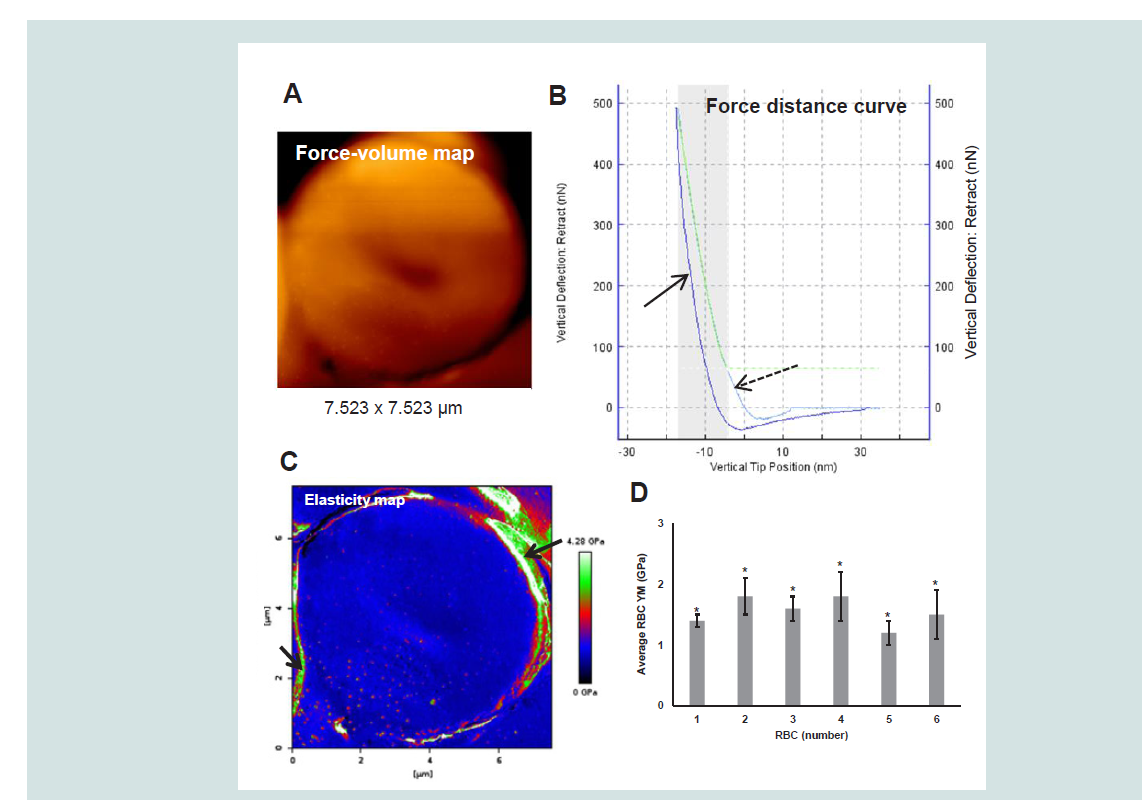
Figure 1: A representative example of a (5-day-old) RBC FV map (A), FD curve (B) and corresponding elasticity map (C) obtained from measurements on a randomly chosen RBC from the peripheral zone of a 5-day-old bloodstain (3 μL, 6.5 - 7 mm in diameter). Mean YM values (± SD) thus determined for 6 RBCs in total are presented in D. The broken arrow in the FD curve (B) refers to the approach curve while the solid arrow in this image indicates the retract curve.The arrows in the image in C indicate areas with artifacts. The bloodstain was deposited on a glass surface in a Petri-dish, dried (23.9 ± 0.5 °C and 35 ± 7% relative humidity, n = 7) and measured after 5 days (27 °C, 36% relative humidity).
AFM specifications: Sapphire calibrated silicon tip (Olympus), spring constant 38.75 N/m and sensitivity 18.77 nm/V; Frequency: 300 kHz; Maximum load: 548 to 874 nN; speed: 5 μm/s; Indentation depths: 12 to 16 nm. Statistical data analysis was performed using One-Way ANOVA and Gabriel and Hochberg post-hoc tests (IBM SPSS statistics 20) with a critical level of significance of p = 0.05 and based on YM values calculated [Hertz model; Poisson ratio: 0.5; Tip radii: 10 nm (RBC 1 - 3) and 83 nm (RBC 4 - 6)] for 40564 to 42856 FD curves per cell. *p < 0.001; Size effect η
2 = 0.065; Grand mean RBC YM: 1.6 ± 0.4 GPa.
Notice that the shaded area and the green line in the FD-curve indicate the part of the curve that is used for fitting and further modelbased calculations. The YM data thus obtained and given in
Figure 1D were derived from RBC elasticity maps that were cropped leaving the outer edge out. The indicated high YM values derived from these peripheral RBC areas (see the arrows in
Figure 1C) were considered false and based on artifacts that must have been created by the sharp fall of the tip at these peripheries. These edges and the area outside the cell where thus excluded from further calculations. The mean YM values of individual RBCs from the same bloodstain differed significantly (p < 0.001). However, because of the large number of YM data significance is mainly caused by the size of the sample rather than by the chosen level of significance and thus leading to the detection of extremely small differences. However, theeta-squared (η
2) effect size appeared to be 0.065. This means that the spreading between the data was for only 6.5% caused by the RBC itself. As illustrated by the representative elasticity map (
Figure 1C) the elasticity appeared homogenous over the cell with a grand mean YM for the 6 randomly selected, peripheral bloodstain RBCs of 1.6 ± 0.4 GPa. For comparison it may be noticed that force spectroscopy measurements on well-preserved RBCs from a 5000-year-old mummy tissue resulted in a YM of 2.0 ± 1.0 GPa and for equally processed recent RBCs 2.5 ± 1.2 GPa (sample sizes: 213 - 263). The study used similar AFM conditions (spring constant of 40 Nm
-1, resonance frequencies of 300 kHz, maximum load 500 nN and 10 nm silicon tip radii) as the here presented investigation [
9]. As it is not mentioned how many cells were measured with the same cantilever their higher YM values (one would expect lower stiffness for fresh RBCs when compared to 5-day aged cells) could be caused by blunting of the tip. If this is the case the actual, increased radius would render lower values in the applied Hertz model (see
Equation 1). As illustrated in Figure 2 increasing the maximum load aggravated this blunting problem. Changes in silicon tip radii were in this study investigated as a function of the number of RBC indentations and sapphire calibrations. An average load of 2812 nN (spring constant 55.1 N/m and sensitivity 14.58 nm/V) resulted in a 50 times increase in radius after 24 RBC indentations and 4 sapphire calibrations (compare
Figures 2A with
2D). However, tip radii as large as ~ 600 nm where not used because the resolution of the topography images and the FV data would then be severely reduced. Consequently, potentially interesting nanoscale variations of the YM could thus be missed. For 2 to 6 RBCs indentations the tip radii increased to respectively 27 and 169 nm (
Figures 2B and 2C). It may be noticed that observed bluntness is probably mostly caused by the intensive RBC indentations rather than by the few sapphire indentations.
Figure 2: Representative SEM images showing changes in tip radius (silicon, Micromash) after a variety of sapphire calibrations (Spring constant: 55.1 N/m;Sensitivity: 14.58 nm/V) and RBC (between 5 and 7 days old) indentations (Maximum load: 2410 - 3213 nN; 256 x 256 pixels).
A: Calibrated only once on sapphire; B: 1 Sapphire calibration and 2 RBC indentations in total; C: 2 Sapphire calibrations and 6 RBC indentations in total; D: 4 Sapphire calibrations and 24 RBC indentations in total.
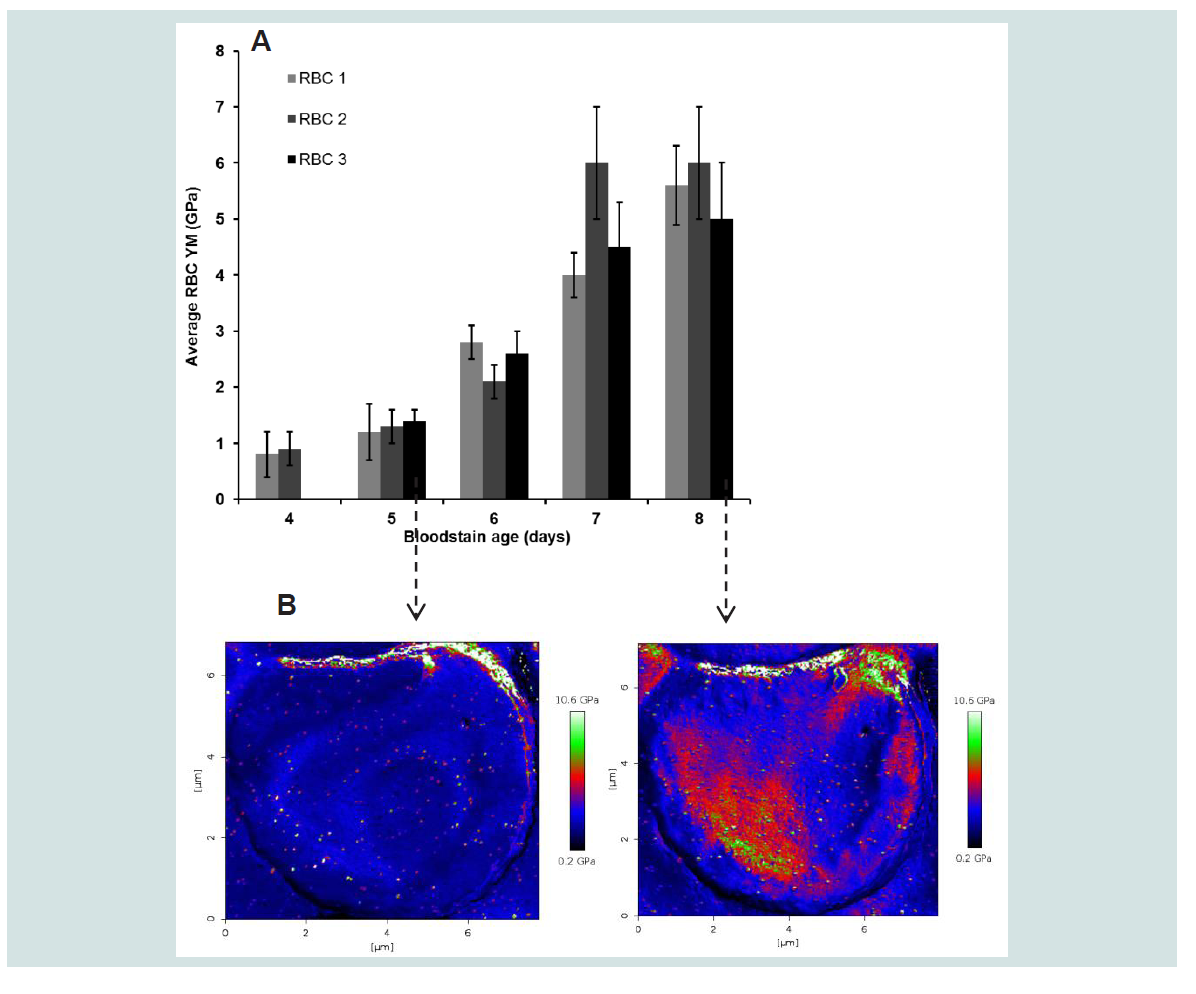
To investigate daily changes in RBC elasticity 2 to 3 RBCs were selected randomly from a peripheral bloodstain zone and their elasticity followed between 4 and 8 days. To assure sufficient indentation 45.5 - 55.1 N/m cantilevers were chosen and the maximum load increased (3028 - 3414 nN). This choice was based on the most accurate results obtained from a polystyrene film calibration sample with a known YM (2.5 GPa) in the same order of magnitude as the YM of the RBCs. The results as shown in
Figures 3A are based on the average YM obtained for each cell (43046 to 44272 FD-curves/cell) using corrected tip radii supported by SEM data. The data indicate that RBC elasticities, under the given controlled circumstances, differ significantly for the factor day (p < 0.001). Moreover, with an η
2 effect size of 0.81 the effect of this factor is large [10]. Interestingly, η
2 first increased from 0.195 to 0.727 for respectively day 5 vs 6 and day 6 vs 7 day but decreased again when YM results obtained for day 7 were compared with those obtained for day 8 (η
2 = 0.597). This observation could suggest the start of saturation. It may also be noticed that the mutual spreading between cells within the day increases with increasing bloodstain age indicating a decreased precision of the measurement. An example of the changes that occur in the elasticity maps of a RBC between 5 and 8 days is given in
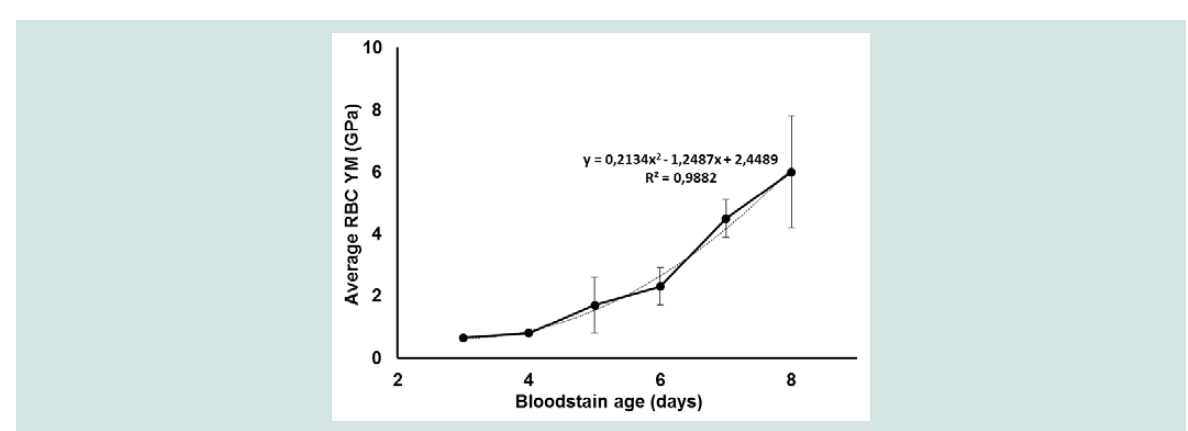
Figure 3B for RBC 3. Similar changes were obtained for the other cells in this stain. It may be noticed that the homogeneous distribution of YM values over the cell disappeared upon ageing of the cells over 5 days while the mean RBC elasticity remained mutual comparable. The periodical bloodstain studies were performed 4 times in total for varying ageing periods (3 to 8 days) under similar controlled conditions, the resulting FV maps processed (Hertz model) into elasticity maps using SEM-supported tip radius corrections, the data pooled and results summarized in
Figure 4. These pooled results also showed a significant effect for the bloodstain age in days (p < 0.001) with still a large overall size effect (η
2 = 0.611). The size of the effect decreases as the bloodstain becomes older than 5 days. For comparison of 5-to 6-day-old bloodstains η
2 is 0.591 while for 6- to-7-day and 7- to 8-day bloodstains η
2 was respectively 0.408 and 0.328. Curve fitting of the YM data, illustrated in Figure 4 with the dotted line, resulted in a second-order polynomial relationship between RBC age and elasticity. As it has been reported that RBCs in a bloodstain collapse between 3 and 4 days resulting in a drop and subsequently an increase in YM a non-linear relationship like the one we noticed could be indeed expected when 3- and 4-day bloodstains are included in the measurements [
8].
Figure 3: Representative changes in YM (± SD) of RBCs selected from the peripheral zone of a bloodstain between 4 and 8 days old (
(A) the bloodstain test conditions were the same a described for Figure 2). Representative spatial changes in RBC elasticity resulting from aging of the cell between 5 and 8 days is illustrated in
(B) with the elasticity map of RBC 3.
AFM specifications: Sapphire calibrated silicon tips (Micromash) with spring constants and sensitivities of 45.5 N/m and 16.64 nm/V, 55.8 N/m and 15.30 nm/V, 55.1 and 14.58 nm/V for respectively day 4, day 5, 6 and day 7, 8; Frequency: 300 kHz; Maximum load: 3018 to 3414 nN; Speed: 5 μm/s; Indentation depths: 20 to 45 nm. Statistical data analysis was performed with One-Way Repeated Measures Anova (IBM SPSS statistics 20) with a critical level of significance of p = 0.05 and based on YM values calculated with the Hertz model (Poisson ratio: 0.5; Corrected radii: 20 nm for day 4 data, 70 nm for day 5 data, 133 nm for day 6 data, 75 nm for day 7 data, 130 nm for day 8 data) for 43046 to 44272 FD curves per cell. Given are the mean YM values/cell (± SD). Size effect η2 for the factor day is 0.810. Calculated size effects for day 5 vs 6 , 6 vs 7 and 7 vs 8 were respectively 0.195, 0.727 and 0.597. Grand mean RBC YM: 0.8 ± 0.3 GPa (4 days), 1.3 ± 0.4 GPa (5 days), 2.7 ± 0.3 GPa (6 days), 4.7 ± 0.8 GPa (7 days), 5.5 ± 1 GPa (8 days).
Figure 4: Average changes in the YM (± SD) of RBCs obtained from different bloodstains ageing between 3 and 8 days. The dotted line illustrates the polynomial relationship between the data based on curve fitting. Presented mean YM values (Hertz model, Poisson ratio: 0.5) were based on force measurements of 3 RBCs per stain. Prior to and in between the measurements the stains were treated the same as described for Figure 2 and all RBCs were selected from the peripheral zone of the stain.
AFM specifications: Sapphire calibrated silicon tips (Olympus andMicromash) with spring constants and sensitivities of respectively 25.16 - 67.48 N/m and 14.74 - 24.34 nm/V; Frequency: 300 kHz; Maximum load: 548 -3905 nN; Speed: 5 μm/s; Indentation depths: 8 to 63 nm.
Age specification: 3 days: 1 bloodstain, 139643 FD-curves: 0.65 ± 0.08 GPa; 4 days: 2 bloodstains, 226961 FD-curves: 0.8 ± 0.1 GPa; 5 days: 4 bloodstains,477888 FD-curves: 1.7 ± 0.9 GPa; 6 days: 3 bloodstains, 319896 FD-curves: 2.3 ± 0.6 Gpa; 7 days: 4 bloodstains, 338245 FD-curves: 4.5 ± 0.6 GPa; 8 days: 4bloodstains, 338245 FD-curves: 6.0 ± 1.8 GPa. Statistical data analysis was performed using One-Way ANOVA (IBM SPSS statistics 20) with a critical level of significance of p = 0.05.
With respect to a potential forensic usefulness of AFM for age determination of bloodstains at or nearby the scene of the crime the spreading between the data observed in this study is far from optimal. However, it should be noticed that presented data were all based on corrected tip radii calculated from SEM images for tips used for 3 to a maximum of 6 cells. Moreover, the best indentations and FD-curves were obtained using the stiffer cantilevers with a spring constant larger than 45 N/m. One must remember that indentation is an essential requirement for accurate YM determinations. The increasing stiffness of the RBCs made it impossible for softer cantilevers to indent the cells sufficiently. In our search for the right probe at the start of this study the less stiff cantilevers (approximately 25 N/m) were tested as well (mostly for cells from 3- to 4-day-old stains) and the results included in the data from
Figure 4. This may certainly have contributed to the large daily spreading and thus low precision found in stiffness of particularly 8-day-old RBCs. A 24-h accuracy of the average age of RBCs as measure for the age of the bloodstain from which the cells were derived is therefore not always possible. Based on the results of this research such a 12 to 24 h accuracy could only be obtained for stains of 6 to 7 days. In this respect, the investigated AFM technology could be supplementary to the HSI technique for bloodstain age determination where both precision and accuracy are drastically reduced after an actual age of 2 days [
1]. This deviation is resulting from reduced changes in bloodstain color while at the same time RBC stiffness is starting to increase as demonstrated in this study where bloodstain ages could be established with an accuracy of at least 48 hours. However, one must realize that this outcome accounts only for the very controlled conditions used in this study. Additional experiments using similar but also realistic forensic conditions with optimized AFM probes, such as those with a more robust tip, are required. As the mechanism of RBC stiffening in a bloodstain is not completely known it may be important to investigate not only the influence of external factors but also intrinsic RBC properties. Preliminary results with diamond coated tips indeed resulted in only limited tip blunting (1.5 times increase in the original 154 nm tip radius, with cantilever spring constant of 137 N/m was observed after 12-20 RBC indentations). However, processed FV maps showed, without exception, many artifacts. These undesired effects could have been caused by the laser reflecting properties of the diamond coating on the tip apex. Unfortunately, the data thus produced were not reliable. The use of a robust and reliable tip could superfluous tip radius corrections thereby reducing the spreading between the results. Meanwhile more specific information could be given on the minimum number of RBCs that is required for elasticity determinations as measure for the age of the whole bloodstain. Other useful future investigations should involve the (minimum) number of FD-curves that are required to obtain an accurate average RBC YM. It may also be noticed that particularly for crime scene investigations of both biological and non-biological traces with stiffness in the GPa range acoustic or ultrasonic AFM could be an interesting option as well in combination with the use of robust AFM tips [
11]. Specifically for usage of AFM at a crime scene where the age of a bloodstain is completely unknown tip robustness is of utmost importance.
References
- Edelman G, van Leeuwen TG, Aalders MC (2012) Hyperspectral imaging for the age estimation of blood stains at the crime scene. Forensic Sci Int 223: 72-77.
- Bremmer RH, de Bruin KG, van Leeuwen TG, Aalders MC (2012) Forensic quest for age determination of bloodstains. Forensic Sci Int 216: 1-11.
- Butt HJ, Cappella B, Kappl M (2005) Force measurements with the atomic force microscope: technique, interpretation and applications. Surf Sci Rep 59: 1-152.
- Stegemann B, Backhaus H, Kloss H, Santner E (2007) Spherical AFM probes for adhesion force measurements on metal single crystals. In: Méndez-Vilas A, Díaz J (Eds), Modern research and educational topics in microscopy. World Scientific Publishing, Spain, pp. 820-827.
- Hertz H (1882) Across the touch solid elastic body. J Pure Appl Math 92: 156-171.
- Heinz WF, Hoh JH (1999) Spatially resolved force spectroscopy of biological surfaces using the atomic force microscope. Trends Biotechnol 17: 143-150.
- Smijs T, Galli F, van Asten A (2016) Forensic potential of atomic force microscopy. Forensic Chem 2: 93-104.
- Wu Y, Hu Y, Cai J, Ma S, Wang X, et al. (2009) Time-dependent surface adhesive force and morphology of RBC measured by AFM. Micron 40: 359-364.
- Janko M, Stark RW, Zink A (2012) Preservation of 5300 year old red blood cells in the Iceman. J R Soc Interface 9: 2581-2590.
- Bakeman R (2005) Recommended effect size statistics for repeated measures designs. Behav Res Methods 37: 379-384.
- Yamanaka K, Noguchi A, Tsuji T, Koike T, Goto T (1999) Quantitative material characterization by ultrasonic AFM. Surf Interface Anal 27: 600-606.