
Journal of Forensic Investigation
Download PDF
Research Article
*Address for Correspondence: Robert W. Allen, PhD, School of Forensic Sciences, 1111 West 17th Street, Tulsa, OK 74107, USA, Tel: 918-561-1292; E-mail: Robert.w.allen@okstate.edu
Citation: Allen LN, Jun Fu, Pritchard JK, Wellendorf R, Allen RW. Complex Variability within the THCA and CBDA Synthase Genes in Cannabis Species.J Forensic Investigation. 2016;4(1): 7.
Copyright © 2016 Allen LN, et al. This is an open access article distributed under the Creative Commons Attribution License, which permits unrestricted use,distribution, and reproduction in any medium, provided the original work is properly cited.
Journal of Forensic Investigation | ISSN: 2330-0396 | Volume: 4, Issue: 1
Submission: 15 January, 2016 | Accepted: 15 February, 2016 | Published: 19 February, 2016
Complex Variability within the THCA and CBDA Synthase Genes in Cannabis SpeciesTM Identity Panel
Lindsey N. Allen, Jun Fu, Jane K. Pritchard, Rachel Wellendorf and Robert W. Allen*
- School of Forensic Sciences, Center for Health Sciences, Oklahoma State University, Tulsa, USA
*Address for Correspondence: Robert W. Allen, PhD, School of Forensic Sciences, 1111 West 17th Street, Tulsa, OK 74107, USA, Tel: 918-561-1292; E-mail: Robert.w.allen@okstate.edu
Citation: Allen LN, Jun Fu, Pritchard JK, Wellendorf R, Allen RW. Complex Variability within the THCA and CBDA Synthase Genes in Cannabis Species.J Forensic Investigation. 2016;4(1): 7.
Copyright © 2016 Allen LN, et al. This is an open access article distributed under the Creative Commons Attribution License, which permits unrestricted use,distribution, and reproduction in any medium, provided the original work is properly cited.
Journal of Forensic Investigation | ISSN: 2330-0396 | Volume: 4, Issue: 1
Submission: 15 January, 2016 | Accepted: 15 February, 2016 | Published: 19 February, 2016
Abstract
The genes encoding the enzymes THCA and CBDA synthase, enzymes catalyzing the final biosynthetic steps in the production of the cannabinoids Δ-9-tetrahydrocannabinolic acid (THCA) and cannabidiolic acid (CBDA), have been subjected to DNA sequencing to better understand the variability of gene structure in different strains of marijuana (Cannabis sp.) and to begin to explore how this variability may have consequences in cannabinoid synthesis. Genomic DNA was extracted from a collection of marijuana samples seized by local law enforcement and made available for molecular analysis. Massively parallel sequencing as well as Sanger sequencing were used to elucidate the sequence of the synthase gene from different seized samples. The sequences were compared with THCA and CBDA synthase gene sequences contained within the GenBank database of NCBI to investigate the variability of these genes and to try and differentiate active from inactive synthase genes known to exist in Cannabis sp.. Results suggest the existence of numerous copies of THCA and CBDA synthase gene sequences in the genome of Cannabis. THCA synthase sequences are less variable than CBDA sequences in terms of SNP polymorphisms visualized and SNPs visualized in THCA synthase are more highly conserved among the seized samples analyzed. Our results suggest the existence of multiple synthase genes that exist combinations of functional and non-functional combinations of genes. It may be difficult to design a simple molecular assay that will distinguish between active and inactive synthase genes in a way that would be useful to growers desiring to propagate plants selected to produce only one or the other of the principal cannabinoids useful for medicinal purposes.Keywords
DNA polymorphism; Cannabis sp.; cannabinoid synthesis; THCA synthase; CBDA synthase; DNA sequencingIntroduction
The history of marijuana (Cannabis sp.) use dates back thousands of years and there has been extensive analysis and characterization of the cannabinoid family of chemicals [1,2]. More recently, there has been genetic analysis of the plant with particular emphasis on the enzymes that participate in the final stages of Δ-9-tetrahydrocannabinolic acid (THCA) and cannabidiolic acid (CBDA) biosynthesis [3-7]. The THCA and CBDA synthase genes are responsible for this final conversion of cannabigerolic acid to THCA and/or CBDA and both genes have been sequenced repeatedly from genomic DNA or cDNA copies of synthase gene transcripts (mRNAs)from many strains of Cannabis [3-7]. Simple molecular assays have also been described that claim to be able to distinguish between active (active for catalysis) versus inactive (inactive for catalysis) synthase genes [4, 6-8]. The rationale underlying such assays derives from SNPs that exist within both active and inactive genes that can be the targets for PCR primers that direct selective amplifications of active or inactive genes [6-8]. A mini sequencing assay has also been described that interrogates one or more SNP sites presumably associated with active or inactive genes [4]. As might be expected, inactive genes for THCA and CBDA synthase are likely to harbor many more SNP type polymorphisms than active genes. Moreover, the notion is that a SNP in an inactive synthase gene either radically alters the amino acid sequence of the enzyme, likely inactivating it or at least affecting activity, or creates one or more stop codons [4, 6-8]. Interestingly, even active genes carry SNPs; however they are fewer in number and only slightly change the amino acid sequence or do not affect it at all.The biosynthesis of the two principal cannabinoids of widespread interest, Δ-9-tetrahydrocannibinolic acid and cannabidiolic acid are the end products of a biosynthetic pathway in which cannabigerolic acid (CBG) serves as a precursor for both CBDA synthase and THCA synthase [3, 8,9]. Both synthase enzymes require the assistance of the cofactor FAD for activity resulting in the conversion of CBG to the acidic cannabinoids THCA and CBDA that then spontaneously decarboxylate to the final pharmacologically active forms of THC and CBD [9]. The synthase enzymes consist of 545 amino acids and are encoded by an intronless gene of approximately 1635 bp [5, 9,10]. Within the amino acid sequence of both CBDA and THCA synthase, residues 81-218 exhibit a consensus sequence characteristic of an FAD binding domain and histidine 114 and cysteine 175 appear to be especially critical for the functional enzyme as these residues covalently link the FAD cofactor to the polypeptide backbone [10].
We initiated a study of the molecular characteristics of the THCA and CBDA genes isolated from marijuana seized by local law enforcement and destined for destruction. Sequencing of amplified THCA and CBDA synthase gene products using both the Ion Torrent PGM platform and Sanger methods were performed and sequence data from almost the entire THCA or CBDA synthase gene was collected and compared to known active and inactive reference gene sequences obtained from GenBank (http://www.ncbi.nlm.nih.gov/genbank/). Results from sequencing identified both SNPs and insertions/deletions in the inactive THCA and CBDA synthase genes. Many of the SNPs and insertions/deletions alterations were also common to many of the strains tested. When massively parallel sequencing (NGS) results were examined, marijuana samples were identified that were apparent homozygotes for active or inactive synthase genes as well as many that were apparent heterozygotes. However, a number of samples subjected to NGS exhibited severe imbalance in the number of sequencing reads for one nucleotide at a given SNP position versus its counterpart. Furthermore, this imbalance was consistent across numerous SNP sites within the synthase genes. These data were interpreted to suggest the existence of multiple THCA and CBDA synthase gene sequences, some of which may not be active in cannabinoid biosynthesis.
In addition to genetic analysis, the THC and CBD levels present in the seized marijuana samples were quantified using GC-MS in an attempt to correlate cannabinoid levels with the nucleotide sequence data. All 75 seized samples had THC levels consistent with “drug type” marijuana and so all samples had at least one copy of active THCA synthase enzyme. However, no strong correlation between genotype and chemotype for THC was found in the seized strains. Our results suggest there is multiple “pseudogene” like synthase genes for both THCA and CBDA that contribute to genotyping results and obscure the true “activity genotype” or the THCA and CBDA synthase genes.
Materials and Methods
Isolation of genomic DNAGenomic DNA was extracted from 10-15 mg aliquots of plant materials selected from seizures as “buds” to help ensure that all the extracted material was from a single plant. Plant tissue was macerated with a scalpel and resuspended in 300 μl of 10 mM Tris-Cl, pH 8.0 containing 0.2 M NaCl, 40 μg/ml Proteinase K, and 0.5% SDS. The extract was heated at 65 °C for 90 minutes and then extracted with an equal volume of phenol: chloroform: isoamyl alcohol (9:0.96:0.04). The aqueous phase was re-extracted with an equal volume of chloroform: isoamyl alcohol (24:1) to remove residual phenol and then 2 volumes of DNA binding buffer supplied as part of the Clean and Concentrator kit (Zymo Research, Orange, CA) were added. The extract was centrifuged through silica packed capture devices supplied with the Clean and Concentrator kit and washed twice with 200 μl of the wash buffer also supplied with the kit. Genomic DNA was recovered from the capture device during two sequential elutions with 15 μl of TE-4 (10 mM Tris-Cl, pH 8.0 containing 0.1 mM EDTA), pre-warmed to 65 °C. Typical recoveries of genomic DNA were 100-200 ng.
Primers and PCR
The primers used in this study and their purposes are summarized in Table 1. PCR reactions were composed of the following reactants:
Go-Taq 2X master mix (Promega Corp., Madison, WI) (60% of total PCR reaction volume), PCR Primer (at final concentrations indicated in Table 1 and supplied at 10% of total volume from a 10X concentrate), DNA (200 pg - 1 ng), and reagent grade water. Thermal cycling consisted of a cycling program of the following temperatures: 95 °C for 2 minutes; 30 cycles of 94 °C for 15 seconds followed by 57 °C for 30 seconds followed by 72 °C for 30 seconds; a 10 minute hold of 72 °C and then an infinite hold at 4 °C.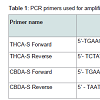 DNA sequencing by massive parallel and chain termination methods
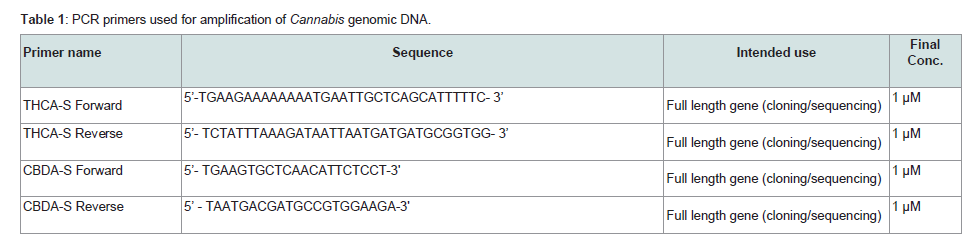
Table 1: PCR primers used for amplification of Cannabis genomic DNA.
Massively parallel sequencing was performed using an Ion Torrent platform.
Merriman and Rothberg have written a good overview of Ion Torrent sequencing technology, and that basic procedure was followed in this study using various kits supplied by Applied Biosystems, Inc., Carlsbad, CA [11]. DNA libraries sequenced on the Ion Torrent PGM instrument (Applied Biosystems, Inc., Carlsbad, CA) were prepared following the instructions provided with the Ion Plus Fragment Library preparation kit (Applied Biosystems, Inc., Carlsbad, CA) using PCR amplicons produced from 1625-1630 bp of the THCA or CBDA synthase genes (1635 bp is full length of the coding sequence). PCR amplicons were checked by agarose gel electrophoresis to confirm successful amplification and then were randomly sheared to about 200 or 400 bp in length using a Bioruptor-200 (Diagenode, Denville, NJ) calibrated to create predominantly 200 or predominately 400 bp genomic DNA fragments. The desired size range of sheared fragments was size selected using agarose gel electrophoresis (E-gel, Applied Biosystems, Inc., Carlsbad, CA). Sheared and sized amplicons were end repaired and ligated to oligonucleotide linkers (one of which represented a bar code to identify a particular sample) supplied with the amplicon sequencing kit (Applied Biosystems, Inc., Carlsbad, CA). Emulsion PCR was performed on a One-Touch 2 instrument (Applied Biosystems, Inc., Carlsbad, CA) and during this process individual amplicons were attached to an Ion Sphere particle through hybridization of the common linker ligated to one end of the amplicon that is complementary to a linker covalently attached to the particle, thereby creating a solid phase for the sequencing reaction. Emulsion PCR amplifies the immobilized sequence ultimately “coating” the particle with clonally amplified copies of the original amplicon associated with the Ion Sphere [11]. The amplicon coated spheres were then deposited into micro wells on a sequencing chip which was flooded with dNTPs sequentially. When a nucleotide is incorporated into a growing polynucleotide chain at each cycle, hydrogen ions are released and the momentary change is pH is registered by an ion sensitive layer in the chip matrix [11]. Next generation sequencing results in the form of BAM files were produced using the software supplied with the Ion Torrent PGM and results were visualized using Integrated Genomics Viewer software (Broad Institute, Cambridge, MA, https://www.broadinstitute.org/igv/).
Sanger sequencing
Sanger sequencing was performed on THCA or CBDA synthase amplicons produced from genomic DNA isolated from the various Cannabis strains. In some cases PCR amplicons produced from genomic DNA were cloned using a kit tailored for cloning PCR amplicons (NEB PCR cloning kit, New England Biolabs, Ipswich, MA). In other cases, the amplicon was sequenced directly as PCR products. In all cases, DNA was subjected to dideoxy Sanger sequencing by the core laboratory at Oklahoma State University (Stillwater, OK) using standard procedures. Sanger sequencing data were analyzed using SnapGene software (http://www.snapgene.com/) through alignment to sequences downloaded from the NCBI website.
Results
The THCA synthase gene(s) amplified from genomic DNA extracted from a total of 27 samples of seized marijuana from the Tulsa, Oklahoma area were sequenced on the Ion Torrent PGM platform. The CBDA synthase genes from 11 samples of seized marijuana and 3 samples of genomic DNA extracted from hemp seeds were sequenced as well. Read depth per nucleotide site ranged from a low of 150 reads/nucleotide up to 10,000 reads/nucleotide and quality scores for all sequencing experiments were above 20, normally considered reliable for sequencing.Reference nucleotide sequences for active and inactive THCA synthase genes used for comparisons in this study were chosen based upon the publication of Weiblen et al. who sequenced cDNA prepared from mRNA extracted from Cannabis plants [9]. The final THCA and CBDA concentrations in these plants were known thereby establishing a link between the activity of the synthase genes and the actual cannabinoid composition of the plants from which the genes were derived. The reference sequences used were KJ469378 (active THCA synthase), KJ469379 (inactive THCA synthase), KJ469374 (active CBDA synthase), and KJ469376 (inactive CBDA synthase).
Typical NGS results for the THCA synthase gene are shown in Figure 1 for three strains of seized marijuana. Results from the IGV display are shown and each vertical column (grey or colored) represents a single nucleotide position. If the column is grey, the nucleotide in that position is identical to the nucleotide in the reference sequence, in this case active THCA synthase. The middle panel (labeled h-Active/Inactive) would presumably represent a heterozygous plant harboring one copy of an active gene and one copy of an inactive gene based upon the relative proportion of the two different nucleotides that occupy SNP sites in the THCA synthase gene. The relative proportion of each nucleotide at each of the sites is displayed by the IGV software as colored columns which have been further characterized by the relative percentage of each of the two nucleotides that occupy a given position. Breaks in the horizontal sequencing results represent gaps in the sequencing for a given DNA strand. However, the massively parallel nature of the sequencing technology ensures that sufficient strands are sequenced at all positions to provide the complete nucleotide sequence of the DNA fragment being investigated. The bottom panel in Figure 1 (H-Inactive?) represents a result that was encountered often in which SNPs exist within the sequence, but there is not a balance in the nucleotides occupying a given SNP position. For example, one nucleotide may be present in 80% of the fragments sequenced while the other is only present 20% of the time as shown in the figure. Moreover, the 80:20 proportions are maintained at all the SNP sites in the sequence suggesting a haplotype structure within the family of THCA synthase amplicons sequenced. Possible explanations for the imbalance include polyploidy or the presence of multiple copies of THCA synthase sequences in the genome of Cannabis that exhibit different SNP profiles.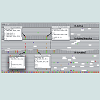 In contrast to the results obtained for THCA synthase, CBDA synthase exhibited a much more complex and extensive distribution of SNPs (Figure 2). Interestingly, rather than just two nucleotide possibilities at a given SNP site, examples of 3 nucleotide possibilities are evident in the CBDA synthase sequences produced on the Ion Torrent (Figure 2, result highlighted for strain 0777 with 30%-C, 32%-A, and 38%-T) at the SNP site shown. One possible explanation for this result is that both functional and multiple non-functional CBDA genes exist in the Cannabis genome.
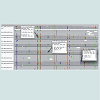 In order to investigate the THCA and CBDA synthase gene variability in greater detail, Sanger sequencing was performed either on synthase gene amplicons that were largely full length (i.e. ~1600 bp) and were produced using PCR primers specific for either the active or inactive forms of the gene or through cloning of PCR amplicons and sequencing recombinant plasmids harboring active or inactive genes.
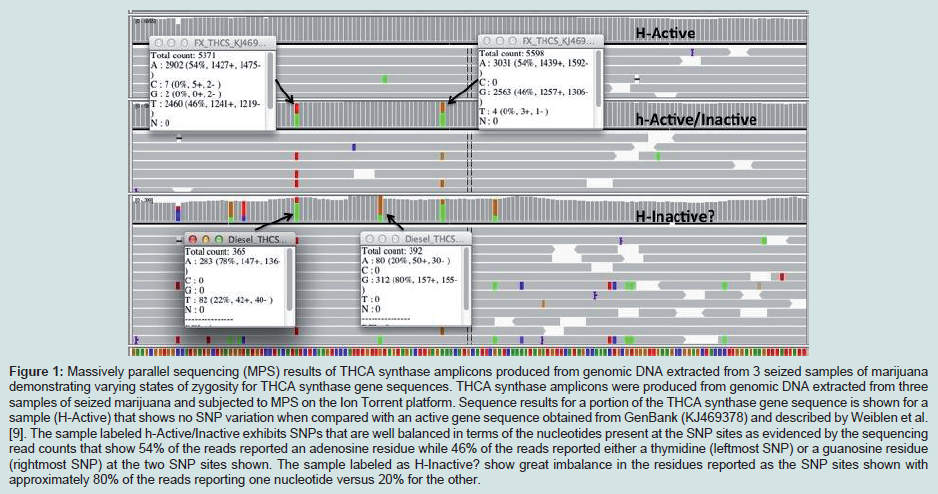
Figure 1: Massively parallel sequencing (MPS) results of THCA synthase amplicons produced from genomic DNA extracted from 3 seized samples of marijuana demonstrating varying states of zygosity for THCA synthase gene sequences. THCA synthase amplicons were produced from genomic DNA extracted from three samples of seized marijuana and subjected to MPS on the Ion Torrent platform. Sequence results for a portion of the THCA synthase gene sequence is shown for a sample (H-Active) that shows no SNP variation when compared with an active gene sequence obtained from GenBank (KJ469378) and described by Weiblen et al. [9]. The sample labeled h-Active/Inactive exhibits SNPs that are well balanced in terms of the nucleotides present at the SNP sites as evidenced by the sequencing read counts that show 54% of the reads reported an adenosine residue while 46% of the reads reported either a thymidine (leftmost SNP) or a guanosine residue (rightmost SNP) at the two SNP sites shown. The sample labeled as H-Inactive? show great imbalance in the residues reported as the SNP sites shown with approximately 80% of the reads reporting one nucleotide versus 20% for the other.
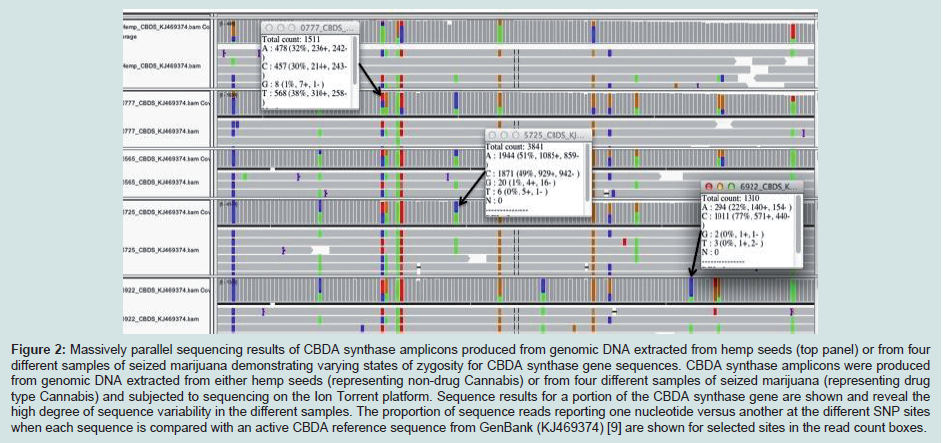
Figure 2: Massively parallel sequencing results of CBDA synthase amplicons produced from genomic DNA extracted from hemp seeds (top panel) or from four different samples of seized marijuana demonstrating varying states of zygosity for CBDA synthase gene sequences. CBDA synthase amplicons were produced from genomic DNA extracted from either hemp seeds (representing non-drug Cannabis) or from four different samples of seized marijuana (representing drug type Cannabis) and subjected to sequencing on the Ion Torrent platform. Sequence results for a portion of the CBDA synthase gene are shown and reveal the high degree of sequence variability in the different samples. The proportion of sequence reads reporting one nucleotide versus another at the different SNP sites when each sequence is compared with an active CBDA reference sequence from GenBank (KJ469374) [9] are shown for selected sites in the read count boxes.
Table 1 and Table 2 summarize the extent of variability in the sequences of synthase gene clones for THCA (Table 2) and CBDA (Table 3) synthase among seized marijuana samples that would be expected to harbor active THCA synthase genes. Indeed, GC-MS analysis of THC and CBD levels in methanol extracts from these samples confirmed that all 75 samples had THC levels consistent with being classified as drug type marijuana (Allen et al. in preparation). THCA synthase gene recombinant clones produced from genomic DNA from seized samples with THC levels exceeding 5% all showed sequences that aligned with minimal SNP variation from the reference active KJ469378 sequence (Figure 3). It should also be noted that the portion of the THCA synthase gene encoding amino acids constituting the proposed FAD binding domain of the enzyme (nucleotides 241- 644) is largely free of SNPs in THCA synthase active genes (Table 2) (Figure 3), whereas in inactive genes, SNPs accumulate over the entire coding sequence (Table 2) (Figure 3). It is also of interest to note that there is great conservation in the locations and nucleotide composition of SNPs within the inactive THCA synthase genes (Figure 3). Of 70 SNPs detected in THCA synthase gene sequences from three different seized samples compared to KJ469378, 87% of the SNPs were conserved in terms of the location within the coding sequence and in the nucleotide present at the site (Figure 3).
 In the case of CBDA synthase, an increase in the number of SNPs was observed compared to THCA synthase (Table 3) (Figure 4). As was observed for THCA synthase, active genes obtained from genomic DNA extracted from hemp seeds harbored fewer SNPs within the sequence encoding the FAD binding domain in the enzyme than did inactive gene sequences produced from seized marijuana samples (Table 3) (Figure 4). In addition, in most cases there were more SNPs in inactive CBDA synthase sequences when compared with KJ469374 (an active gene sequence) than were observed in the comparison of inactive THCA gene sequences from seized samples compared to the active THCA synthase sequence KJ479378 (Tables 2 and 3 ). In addition, there was also a highly conserved deletion of 4 nucleotides beginning at nucleotide position 153 as well as a conserved insertion of 3 basepairs in the gene sequence at nucleotide position 758 in inactive CBDA synthase sequences. An additional difference between CBDA and THCA synthase gene variability relates to the extent to which SNP sites and nucleotides were conserved in CBDA synthase sequences among the seized Cannabis samples. In contrast to the extensive sharing of SNPs in THCA gene sequences in the different seizures (87%), SNPs in CBDA gene sequences were conserved only to a level of about 34% (Figure 4).
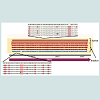 For both CBDA and THCA synthase gene sequences, there were an roughly equal number of transitions and transversions at the SNP sites (57% transitions versus 43% transversions in THCA synthase and 62% transitions versus 38% transversions in CBDA synthase), an interesting observation given that transitions are generally much more common at SNP sites than are transversions.
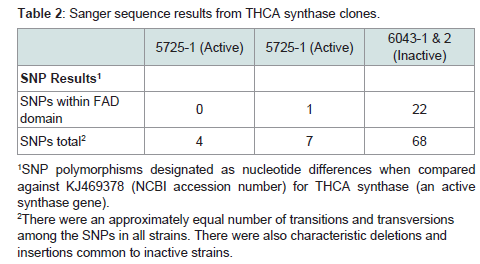
Table 2: Sanger sequence results from THCA synthase clones.
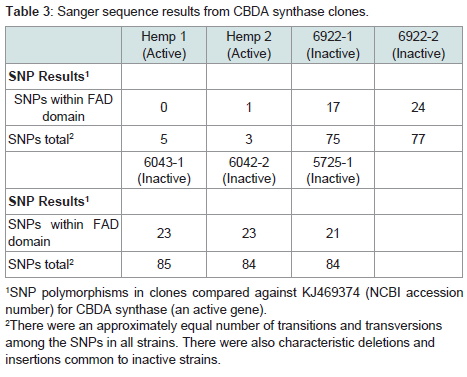
Table 3: Sanger sequence results from CBDA synthase clones.
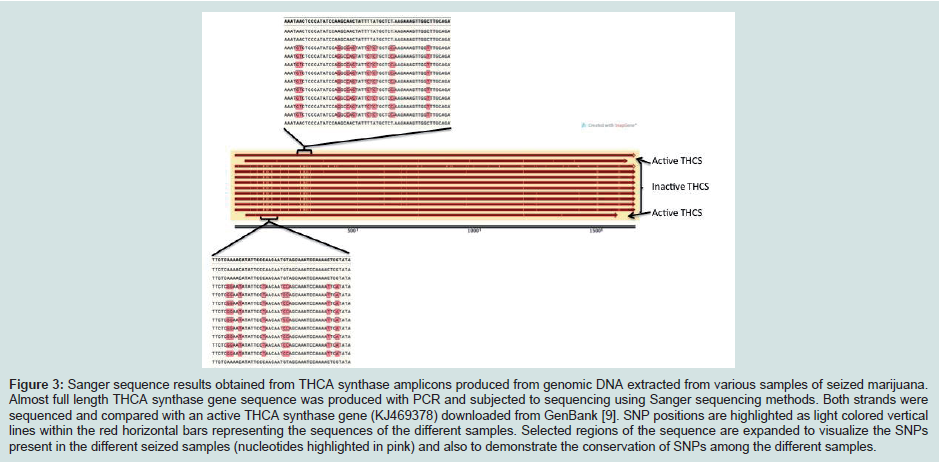
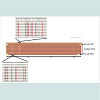
Figure 3: Sanger sequence results obtained from THCA synthase amplicons produced from genomic DNA extracted from various samples of seized marijuana. Almost full length THCA synthase gene sequence was produced with PCR and subjected to sequencing using Sanger sequencing methods. Both strands were sequenced and compared with an active THCA synthase gene (KJ469378) downloaded from GenBank [9]. SNP positions are highlighted as light colored vertical lines within the red horizontal bars representing the sequences of the different samples. Selected regions of the sequence are expanded to visualize the SNPs present in the different seized samples (nucleotides highlighted in pink) and also to demonstrate the conservation of SNPs among the different samples.
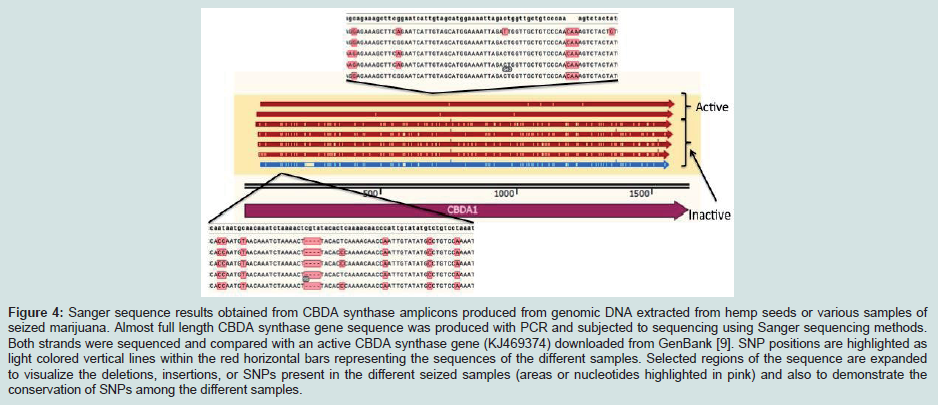
Figure 4: Sanger sequence results obtained from CBDA synthase amplicons produced from genomic DNA extracted from hemp seeds or various samples of seized marijuana. Almost full length CBDA synthase gene sequence was produced with PCR and subjected to sequencing using Sanger sequencing methods. Both strands were sequenced and compared with an active CBDA synthase gene (KJ469374) downloaded from GenBank [9]. SNP positions are highlighted aslight colored vertical lines within the red horizontal bars representing the sequences of the different samples. Selected regions of the sequence are expanded to visualize the deletions, insertions, or SNPs present in the different seized samples (areas or nucleotides highlighted in pink) and also to demonstrate the conservation of SNPs among the different samples.
Discussion
Cannabis species are known to manufacture a large family of highly related cannabinoid compounds, some of which are claimed to have medicinal effects ranging from stimulating appetite and easing anxiety for psychoactive cannabinoids like Δ-9-tetrahydrocannabinolic acid (THCA) to reducing the frequency and severity of seizures for the non-psychoactive cannabinoid cannabidiolic acid (CBDA) [12-15]. The potential beneficial effects of cannabinoids are, in part, responsible for the widespread legalization or decriminalization of Cannabis use in the U.S. over the past 10-15 years [13,14]. The genetics underlying the biosynthesis of cannabinoids is therefore also of increasing interest inasmuch as it might be possible to develop simple molecular assays that will predict the phenotype of a plant at maturity in terms of its cannabinoid composition. This would be useful information for producers who want to maximize the production of a particular class of cannabinoid.Numerous publications have claimed to be able to distinguish between active and inactive THCA synthase genes in genomic DNA isolated from “drug type” plants producing THCA levels in excess of 0.3-0.4% (the THCA level distinguishing drug type marijuana from non-drug type hemp) [4, 6-8]. In most cases, simple PCR based assays using primers specific for active or inactive gene SNPs are coupled with agarose gel electrophoresis to detect the diagnostic amplicon to genotype the plant. The results of our study raise a question about the accuracy of such simple assays inasmuch as we believe our data indicate the presence of multiple THCA and CBDA synthase gene sequences, perhaps reflecting the presence of a single functional gene existing among a number of non-coding pseudogenes. Non-coding THCA synthase and CBDA synthase gene sequences have been reported and, especially in the case of CBDA synthase, the number of DBDA synthase sequences appear to out number sequences encoding THCA synthase [9]. The results of massive parallel sequencing experiments support the existence of multiple THCA and CBDA synthase sequences [9]. We often observed sequences in genomic DNA from different seized samples in which SNP sites exhibited extreme imbalance in the nucleotide present. Occasionally, we would even detect SNP sites in which three nucleotide possibilities existed (Figure 2 for example). Thus, we conclude that there exist multiple THCA and CBDA synthase gene sequences that are highly homologous in terms of their homology to the functional synthase gene. These THCA and CBDA synthase sequences may represent a mix of active and inactive genotypes. In our own attempts to develop a genotyping assay to distinguish between plants with active versus inactive THCA genes, we have often observed the imbalance of active versus inactive PCR amplicons that, on face value, would suggest some plants are largely “active” with some “inactive” gene sequences or vice versa (unpublished). It should be noted however that these assays, like those reported by others [4,6-8], rely on SNPs within the nucleotide sequence of the gene that would alter the amino acid sequence but not necessarily inactivate the THCA synthase enzyme in all cases. Genomic DNAs or and/or THCA synthase gene PCR amplicons sequenced in this study that were designated as inactive all had changes in the nucleotide sequence that created a stop codon that would result in a truncated polypeptide when compared to the sequence of the THCA synthasegene shown to be active by Weiblen et al. and present in GenBank (KJ469378) [9]. A second GenBank submission (KJ469379) from Wieblen et al. [9] claimed to represent a non-expressed THCA synthase gene could nonetheless be translated in silico into a complete polypeptide chain. The translated polypeptide did not exhibit changes in key amino acids necessary for enzyme activity as described by Shoyama et al. [10]. This non-expressed homolog may have regulatory changes that silence the gene that our sequencing would not detect. It is therefore possible that many assays presumably discriminating between active and inactive THCA synthase genes may not in fact discriminate between them.
When the seized marijuana samples were subjected to chemical analysis for THC and CBD, all plants had THC levels consistent with the drug type phenotype, i.e. THC levels in excess of 0.4% w/w (unpublished). This is to be expected given the sample types being studied, i.e. marijuana being sold on the street for its psychoactive effects. Thus, active THCA synthase genes were clearly present even in samples designated as largely inactive based upon nucleotide sequencing or upon simple PCR based assays targeting particular SNP sites (Figures 1 and 3).
Whether or not THCA or CBDA synthase pseudogenes exist as retrotransposons is unclear because the functional synthase genes lack introns which is one of the hallmark features of retrotransposon sequences that exist in the genome [8]. Whether or not any of these additional synthase gene sequences are expressed is also unclear at present. Attempts to extract mRNA from the seized samples was largely unsuccessful, probably because the plant material was not fresh and any mRNA present for either CBDA synthase or THCA synthase was likely degraded to small fragments (unpublished). In the case of the CBDA synthase genes from the seized samples, there was a commonly encountered stop codon at nucleotide 343 due to a frameshift resulting from a 4 bp deletion at nucleotide position 153. There was also a second single nucleotide deletion at nucleotide position 297. These deletions would result in the production of atruncated, and therefore an inactive, CBDA synthase polypeptide if the gene were expressed. In the case of the THCA synthase sequences produced from the seized samples, the amino acid changes resulting from SNPs may or may not have an effect on enzyme activity. Shoyama et al. have identified several amino acid residues in the THCA synthase enzyme they claim are critical to enzyme activity [10]. Those critical amino acid residues are present in translations of both active and inactive THCA synthase sequences we produced from seized samples. Thus, it is possible THCA synthase sequences represent functional genes with perhaps altered activity, but active nonetheless.
Acknowledgements
The authors express their gratitude to the Tulsa Police Department Forensic Laboratory for providing the seized Cannabis samples used for this study. In particular, we thank Tara Valouch and Kim Lee for their assistance.References
- United Nations Office on Drugs and Crime (2007) Cannabis: A short review.
- United Nations Office on Drugs and Crime (2009) Recommended methods for the identification and analysis of cannabis and cannabis products. United Nations Publication, USA.
- de Meijer EP, Bagatta M, Carboni A, Crucitti P, Moliterni VM, et al. (2003) The inheritance of chemical phenotype in Cannabis sativa L. Genetics 163: 335-346.
- Kojoma M, Seki H, Yoshida S, Muranaka T (2006) DNA polymorphisms in the tetrahydrocannabinolic acid (THCA) synthase gene in ‘‘drug-type’’ and ‘‘fiber-type’’ Cannabis sativa L. Forensic Sci Int 159: 132-140.
- Rotherham D, Harbison SA (2011) Differentiation of drug and non-drug Cannabis using a single nucleotide polymorphism (SNP) assay. Forensic Sci Int 207: 193-197.
- van Bakel H, Stout JM, Cote AG, Tallon CM, Sharpe AG, et al. (2011) The draft genome and transcriptome of Cannabis Sativa. Genome Biol 12: R102.
- Thichak S, Natakankitkul S, Chansakaow S, Chutipongvivate S (2011) Identification of drug-type and fiber-type of hemp (Cannabis sativa L.) by multiplex PCR. Chiang Mai J Sci 38: 608-618.
- Onofri C, de Meijer EP, Mandolino G (2015) Sequence heterogeneity of cannabidiolic- and tetrahydrocannabinolic acid-synthase in Cannabis sativa L. and its relationship with chemical phenotype. Phytochemistry 116: 57-68.
- Sirikantaramas S, Morimoto S, Shoyama Y, Ishikawa Y, Wada Y, et al. (2004) The gene controlling marijuana psychoactivity: molecular cloning and heterologous expression of Delta1-tetrahydrocannabinolic acid synthase from Cannabis sativa L. J Biol Chem 279: 39767-39774.
- Weiblen GD, Wenger JP, Craft KJ, ElSohly MA, Mehmedic Z, et al. (2015) Gene duplication and divergence affecting drug content in Cannabis sativa. New Phytol 208: 1241-1250.
- Shoyama Y, Tamada T, Kurihara K, Takeuchi A, Taura F, et al. (2012) Structure and function of Δ1-tetrahydrocannabinolic acid (THCA) synthase, the enzyme controlling the psychoactivity of Cannabis sativa. J Mol Biol 423: 96-105.
- Merriman B, Ion Torrent R&D Team, Rothberg JM (2012) Progress in ion torrent semiconductor chip based sequencing. Electrophoresis 33: 3397-3417.
- Jacobson R (2014) Medical marijuana: how the evidence stacks up. Scientific American.
- Ben Amar M (2006) Cannabinoids in medicine: a review of their therapeutic potential. J Ethnopharmacol 105: 1-25.
- Baker D, Pryce G, Giovannoni G, Thompson AJ (2003) The therapeutic potential of cannabis. Lancet Neurol. 2: 291-298.