
Research Article
*Address for Correspondence: Motoki Osawa, M.D., Ph.D, Department of Forensic Medicine, Tokai University School of Medicine, 143 Shimokasuya, Isehara, Kanagawa Prefecture 259-1143, Japan, Tel: +81-463-93-1121; Fax: +81-463-92- 0284; E-mail: osawa@is.icc.u-tokai.ac.jp
Citation: Miyashita K, Ochiai E, Tamura T, Osawa M. Kinship Analysis Based on SNP Data from the HID-Ion AmpliSeqTM Identity Panel. J Forensic Investigation. 2015;3(2): 6.
Copyright © 2015 Miyashita K, et al. This is an open access article distributed under the Creative Commons Attribution License, which permits unrestricted use,distribution, and reproduction in any medium, provided the original work is properly cited.
Journal of Forensic Investigation | ISSN: 2330-0396 | Volume: 3, Issue: 2
Submission: 30 August, 2015 | Accepted: 9 November, 2015 | Published: 13 November, 2015
Kinship Analysis Based on SNP Data from the HID-Ion AmpliSeqTM Identity Panel
Keiko Miyashita1, Eriko Ochiai1, Tomonori Tamura1,2and Motoki Osawa1*
- 1Department of Forensic Medicine, Tokai University School of Medicine, Isehara, Kanagawa, Japan
- 2Scientific Crime Laboratory, Kanagawa Prefectural Police, Yokohama, Japan
*Address for Correspondence: Motoki Osawa, M.D., Ph.D, Department of Forensic Medicine, Tokai University School of Medicine, 143 Shimokasuya, Isehara, Kanagawa Prefecture 259-1143, Japan, Tel: +81-463-93-1121; Fax: +81-463-92- 0284; E-mail: osawa@is.icc.u-tokai.ac.jp
Citation: Miyashita K, Ochiai E, Tamura T, Osawa M. Kinship Analysis Based on SNP Data from the HID-Ion AmpliSeqTM Identity Panel. J Forensic Investigation. 2015;3(2): 6.
Copyright © 2015 Miyashita K, et al. This is an open access article distributed under the Creative Commons Attribution License, which permits unrestricted use,distribution, and reproduction in any medium, provided the original work is properly cited.
Journal of Forensic Investigation | ISSN: 2330-0396 | Volume: 3, Issue: 2
Submission: 30 August, 2015 | Accepted: 9 November, 2015 | Published: 13 November, 2015
Abstract
Next generation sequencing supports extensive single nucleotide polymorphism (SNP) analysis owing to its comprehensive sequencing capacity. In the present study, a number of 20 parent–child pairs and 17 full siblings were genotyped for SNPs taken from the HIDIon AmpliSeqTM Identity Panel, which includes 90 sites on autosomal chromosomes. Kinship analyses of parent–child pairs and full siblings were carried out using the combined likelihood ratio principle based on the product rule. Eight SNPs (rs7520386, rs876724, rs7704770, rs214955, rs727811, rs6955448, rs445251, and rs1523537) were eliminated because of lower depth and allelic imbalance. The combined likelihood ratio values of 82 sites ranged from 1.15 × 10³ to 1.26 × 10⁸ for parent–child (n = 20), and from 1.00 × 10² to 9.40 × 10¹⁰ for full siblings (n = 17). To evaluate the likelihood ratio distribution more precisely, genotypes were constructed for 10,000 simulated parent–child pairs and full siblings based on allelic frequencies in the Japanese population. As the definitive threshold, likelihood ratio values of less than 1000 were found for 165 (1.7%) parent–child pairs and 243 (2.4%) full siblings. In two inconclusive cases of short tandem repeat analysis, the addition of SNP assays provided conclusive results. Better estimation power was achieved using the set of 82 sites than that in the conventional IdentifilerTM system. Because of the benefits of analyzing degraded samples present in small DNA quantities, the Ion PGMTM system will be favored to obtain informative SNP markers in forensic analyses.Keywords
Kinship analysis; Forensic investigation; Next generation sequencing; Personal identification; Likelihood ratioAbbreviations
STR: Short Tandem Repeat; SNP: Single Nucleotide Polymorphism; NGS: Next Generation Sequencing; LD: Linkage Disequilibrium; LR: Likelihood Ratio; CLR: Combined Likelihood ratio; ERSA: Estimation of Recent Shared Ancestry; CODIS: Combined DNA Index System.Introduction
For kinship estimation in forensic fields, the analyses of divergent short tandem repeat (STR) have been conducted preferentially. Several commercial kits for fragment analysis of up to 15–23 loci in a single PCR tube, designated as multiplex systems, have been developed. High sensitivity assays that can be carried out with as little as 1 ng of template DNA, and the small amplified DNA products, mostly less than 340 bp, have been effective for analysis of degraded materials, such as bone and human remains [1]. However, STR analysis entails some shortcomings such as high mutation rates and stutter peaks in electropherograms. The bi-allelic markers of SNPs do not share these complications; however, because SNPs are not as polymorphic as STRs, more SNPs must be used to achieve equivalent identification power. Moreover, when various SNPs are examined, genetic linkage on the same chromosome may also become problematic.The important difference contrasting the two types of STR and SNP markers resides in the respective mutation rates. Because tetranucleotide STRs are frequently mutated, with estimates on the order of 10-3 per generation [2], even true parent–child relationships will display one inconsistency among 40–50 cases in 15 STR loci examined in conventional multiplex systems [3]. In contrast, SNPs have negligible mutation rates on the order of 10-8 per nucleotide site [4]. With regard to kinship analysis, this feature is the major reason for application of SNP analysis in personal identification [5].
Several systems have been developed for SNP genotyping, including DNA microarray chips. In the early phase of development of next generation sequencing (NGS) technologies, the error rates were too high to meet the standards required for forensic casework [6]. However, currently available NGS instruments serve to detect nucleotide substitutions with high precision owing to their massive sequencing capacity. Among several instruments, the Ion PGMTM system operates with a small amount of DNA, as little as 1 ng, which is expected to be compatible with conventional STR multiplex systems [7].
The HID-Ion AmpliSeqTM Identity Panel is a new SNP-tying system developed by the Life Technologies Inc. based on Ion Torrent PGM platform, which the main purpose is to provide a solution for human identification, especially for complicated or degraded samples. The HID-Ion AmpliSeqTM Identity Panel contains 90 SNPs on autosomal chromosomes and 34 SNPs on the Y-chromosome, but its application value in the kinship analysis has rarely been estimated. Therefore, the purpose of this study is to evaluate the application value of the system in kinship analysis.
In this study, we conducted kinship analyses of parent–child pairs and full siblings from genotypes determined using the Ion PGMTM system.
Materials and Methods
SamplesDNA was extracted from buccal swabs of volunteers of relatives with written informed consent prior to experimentation. In eight cases, we used the blood and nails of unidentified deceased at forensic autopsy. A total of 37 Japanese families, consisting of 20 parent–child pairs and 17 full siblings, were analyzed. The total of 74 specimens consisted of 56 male and 18 female. Additionally, we separately selected two earlier inconclusive cases having one inconsistent locus in IdentifilerTM analysis. This project was approved by the Ethics Committee of Tokai University School of Medicine.
Construction of genotypes for 90 SNPs by simulation
Genotypes were assumed for 10,000 parent–child pairs and full siblings using simulations conducted with a Microsoft Excel algorithm (2010; Microsoft Corp.), as described previously [8].Briefly, the assumed genotypes of 20,000 unrelated individuals were constructed at 90 SNPs on autosomal chromosomes according to allele frequencies in the Japanese population, obtained from the JSNP database (http://snp.ims.u-tokyo.ac.jp). After the 10,000 sets of two individuals as putative matings of randomized combinations were chosen, genotypes of the offspring were determined by means of random selection of one of the four possible combinations.
SNP genotyping using NGS
DNA libraries were constructed using an Ion AmpliSeqTM Library Kit 2.0 (Life Technologies Inc.) in conjunction with an HID-Ion AmpliSeqTM Identity Panel (Life Technologies). Then, DNA of 5 ng was added to each reaction, except in the sensitivity experiment. PCR proceeded under the following protocol: 2 min at 99 °C, 18 cycles of 15 s at 99 °C, and 4 min at 60 °C, and a final hold at 10 °C. FuPa reagent of 2 μL (Life Technologies) was then added to the reaction mixture to digest excess PCR primers and the ends of PCR products. After libraries were barcoded using Ion Xpress Barcode Adapters (Life Technologies), a total of Switch Solution (4 μL), adapter mixture (2 μL), and DNA Ligase (2 μL) were added to the libraries, followed by incubation at 22 °C for 30 min and 72 °C for 10 min. Libraries were purified using Agencourt AMPure XP reagents (Beckman Coulter Inc.), and PCR amplification was performed with the addition of Platinum PCR SuperMix High Fidelity (50 μL) and Library Amplification Primer Mix (2 μL) at 98 °C for 2 min, followed by five cycles of 15 s at 98 °C and 1 min at 64 °C. After purification, the libraries were quantified using an Agilent High Sensitivity DNA Kit (Agilent Technologies Inc.), and pooled to a concentration of 100 pM.
Emulsion PCR (emPCR) was performed on an OneTouch 2 device (Life Technologies). The emPCR products were concentrated using an Ion OneTouch Enrichment System (Life Technologies) with an Ion PGMTM Template OT2 200 Kit (Life Technologies) following the manufacturer’s protocol. Sequencing was performed on an Ion PGMTM instrument settled with a 314 or 316 chip with Ion PGMTM Sequencing 200 Kit v2 reagents. The chip sizes varied depending on the number of samples. The final call of genotypes was obtained using the HID SNP Genotyper v4.3 plugin.
As a series of sensitivity experiments, genotyping was performed at the initial input DNA doses of 0.5, 1, 5, and 10 ng.
Linkage analysis
Allele frequencies were derived from the profiled data of 37 unrelated Japanese individuals in addition to 104 Japanese individuals deposited in the 1000 Genomes project, available at http://www.1000genomes.org/ [9]. However, the database did not cover the whole 90 SNPs. For the uncovered three sites of rs876724, rs1015250 and rs938283, we utilized the JSNP database (http://snp. ims.u-tokyo.ac.jp/) which is comprised of 152 subjects. Regarding SNPs on the same chromosome, linkage disequilibrium (LD), as D’ and r2, was calculated using the Haploview ver.4.2 algorithm, which is available at http://www.broadinstitute.org/haploview/haploview [10]. According to the procedure by Sallam and Martsch, LD (r2) values were plotted to physical distance of each SNP pair that was available from database of the National Center for Biotechnology Information web site (http://www.ncbi.nlm.nih.gov/) [11]. Moreover, P value for LD was obtained using Genepop version 4.2. Linkage disequilibrium algorithm(http://genepop.curtin.edu.au/genepop_op2.html), accompanied by Bonferroni correction, with the significance level of 0.05.
Estimation of kinship
Statistical weighting of the evidence for genetic relatedness was evaluated using the likelihood ratio (LR) principle under two case scenarios: parent–child (H1) versus unrelated individuals (H2), and full siblings (H1) versus unrelated individuals (H2). For instance, if two individuals had the same genotype of (F,G), then the LR was represented as the following formula under the alternative hypothesis, LR = P(F,G|H1) / P(F,G|H2).
For calculations, the LR for each SNP locus was obtained by dividing the joint probability assuming the two individuals were relatives (H1) by that assuming the two individuals were unrelated (H2) [8]. For the present study, duo analysis rather than trio analysis was performed for the parent–child relationship. The formulae for LR values are described elsewhere [12,13]. For all sets of SNP loci, the combined LR (CLR) was calculated by multiplying LRs based on the product rule. We considered cases in which the CLR value was over 1000 or 10,000 to be related [13,14].
Results
Amount of input DNATo examine the minimum DNA amount for application in NGS assays using the Ion PGMTM system, SNP genotyping was started using 0.5, 1, 5, or 10 ng DNA in duplication. The series of experiments revealed that every locus showed identical genotype calls as long as the final concentration of each library was adjusted to 100 pM.
Linkage analysis
Table 1 presents the accession numbers of the 90 examined SNPs and their chromosomal location. In LD values obtained from 141 unrelated Japanese individuals, r2 values are plotted to the physical distance of SNP pairs (n = 151) on the same chromosome (Figure 1). The maximal value of D' was 0.55 between rs9905977 and rs740910 on chromosome 17. All pairs of SNPs showed >0.05 of the P value, accompanied by Bonferroni correction, except for re1821380 and re1528460 (P = 0.03) on chromosome 15. Because no pairs of adjacent SNPs showed apparent linkage except one, we treated each SNP as an independent inheritance for the following analyses.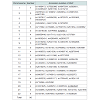
 Exclusion of subjective SNPs
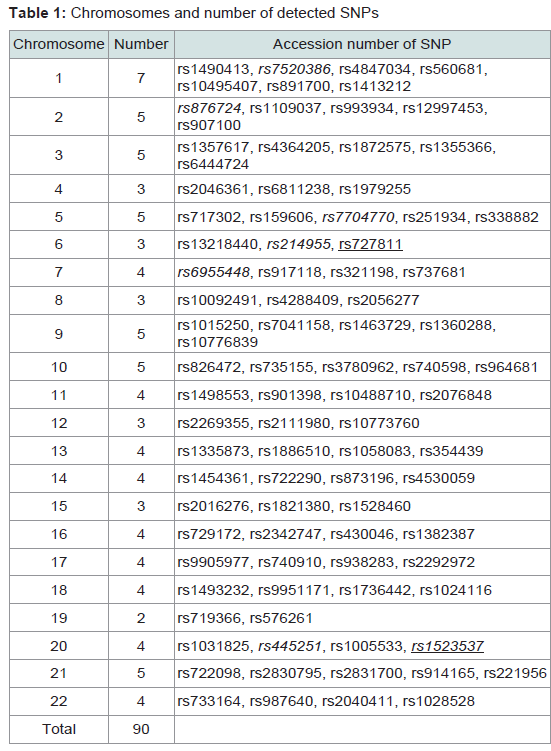
Table 1: Chromosomes and number of detected SNPs
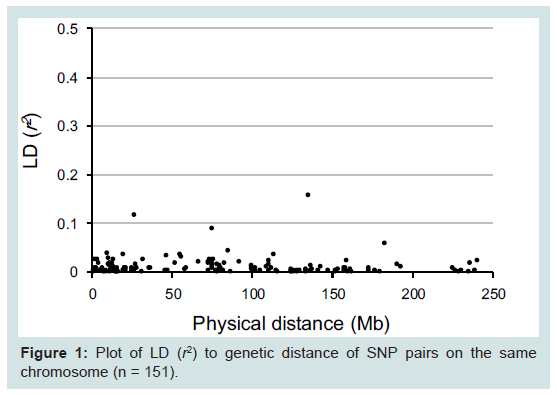
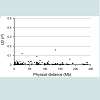
Figure 1: Plot of LD (r2) to genetic distance of SNP pairs on the same chromosome (n = 151).
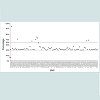
Next, we compared coverage rates among the detected SNPs, with two patterns of six profiles for one individual, and six profiles from distinct individuals, as shown in Figure 2. However, no differences were observed between the two groups. The lowest median coverage of 350 at rs876724 was lower than the mean of around 590 at SNPs on the mono-chromosomal Y-chromosome. Because the lower coverage tended to result from allelic imbalance during NGS reactions, the ratio of allelic reads in heterozygotes was compared (Figure 3). Allelic imbalance was observed in a subtotal of eight SNPs (rs7520386, rs876724, rs7704770, rs214955, rs727811, rs6955448, rs445251, and rs1523537). The rs876724, which had the poorest depth, revealed predominant detection of one allele; however, detection of the others was not always related to their corresponding coverage level. These eight SNPs were eliminated from this series of experiments because of ambiguity in heterozygote detection.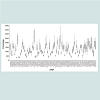
 Application to parent-child relation
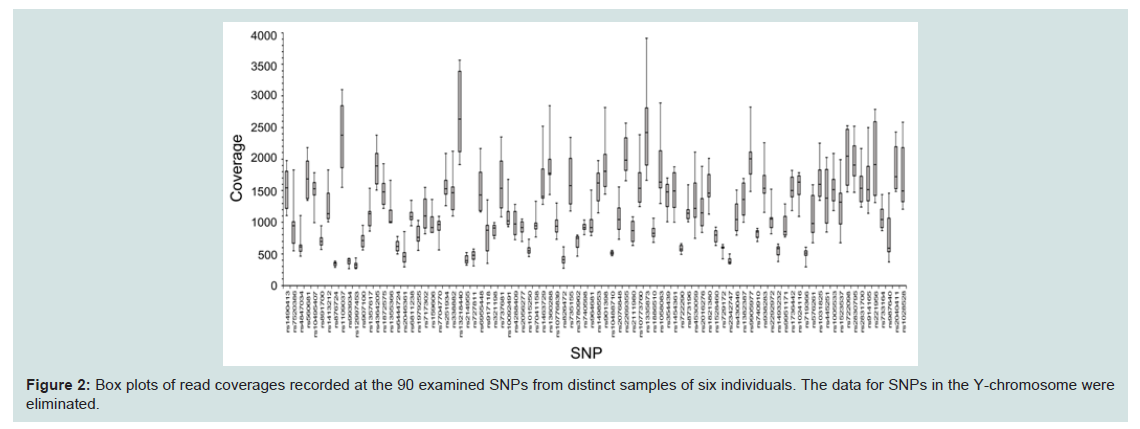
Figure 2: Box plots of read coverages recorded at the 90 examined SNPs from distinct samples of six individuals. The data for SNPs in the Y-chromosome were eliminated.
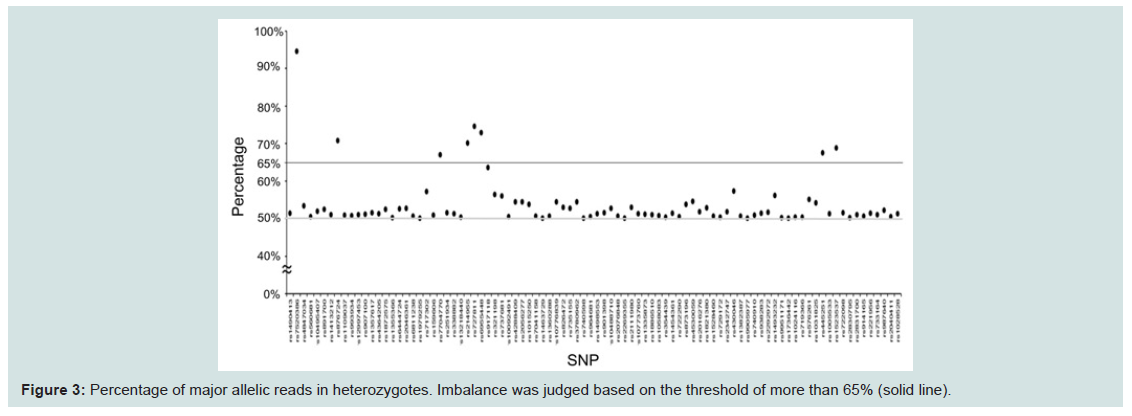
Figure 3: Percentage of major allelic reads in heterozygotes. Imbalance was judged based on the threshold of more than 65% (solid line).
The NGS data from 82 SNP loci were applied to 20 duo cases of parent–child pairs. When the weight of evidence was calculated as relative LR values under the alternative hypotheses, the CLR values were 1.15 × 10³ to 1.26 × 10⁸ with a mean of 8.31 × 10⁶ (Figure 4), which provided decisive values in favor of relatedness in all cases. Moreover, no inconsistencies that were assumed to be mutational events and null alleles were detected. To evaluate the CLR distribution more precisely, 10,000 parent–child sets were constructed by simulation, for which the distribution was compatible with the observed cases. As definitive criteria of CLR thresholds, those less than 1000 counted to 166 (1.7%). Those less than 10,000 counted to 798 (8.0%).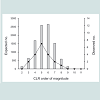 Application to full siblings
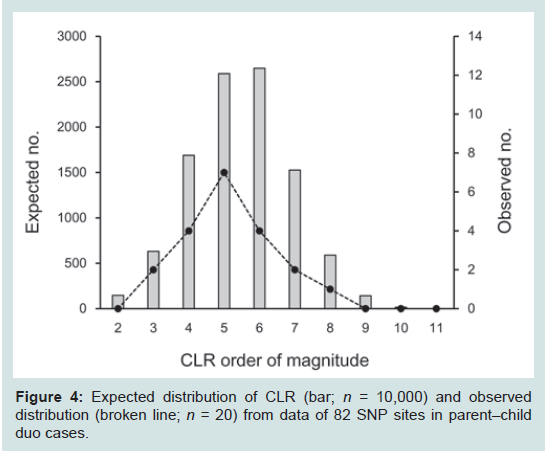
Figure 4: Expected distribution of CLR (bar; n = 10,000) and observed distribution (broken line; n = 20) from data of 82 SNP sites in parent–child duo cases.
The assay was further applied to 17 pairwise cases of full siblings. As portrayed in Figure 5, the CLR values ranged 1.00 × 10² to 9.40 × 10¹⁰ with a mean of 5.63 × 10⁸. To ensure the distribution precisely, 10,000 sets of full siblings were constructed by simulation as well, of which the distribution was compatible with that in the observed cases. As definitive criterion of CLR thresholds, those of less than 1000 were observed in 243 (2.4%) cases, and those of less than 10,000 were in 821 (8.2%) cases.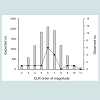 Assessing relationships with inconclusive STR cases
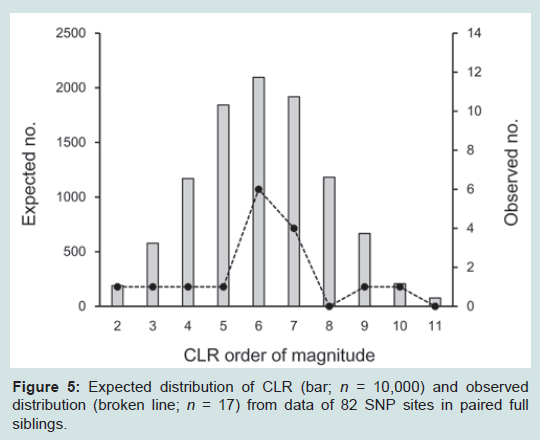
Figure 5: Expected distribution of CLR (bar; n = 10,000) and observed distribution (broken line; n = 17) from data of 82 SNP sites in paired full siblings.
One expected application of SNP data is to supplement inconclusive STR analyses. In a previous parent–child analysis, two cases of a single inconsistency in 15 STR loci analysis were encountered using the IdentifilerTM kit at D2S1338 in case #1 and at D19S433 in case #2. CLRs in the STR analysis did not lead to a conclusive result, but the addition of the SNP assay yielded high values (Table 2).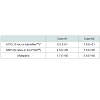
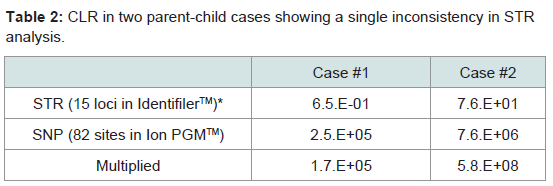
Table 2: CLR in two parent-child cases showing a single inconsistency in STR analysis.
Discussion
In addition to conventional paternity tests, kinship analyses based on parent–child and full sibling relationships have been applied for indirect personal identification of a victim using bones and other tissues. In this study, we performed kinship analysis using parent–child pairs and full siblings from genotypes determined using the Ion PGM system. Our results provide important insights into the utility of NGS systems and multiplex PCR in forensic analysis of SNPs and STRs.The Ion PGMTM system provides high-sensitivity analysis but yields a limited number of sequence reads compared with that of other NGS systems. In this study, SNP genotyping was performed using as little as 0.5 ng of the DNA template, suggesting that the sensitivity was compatible with that of conventional STR multiplexsystems. Consistent with this, Eduardolf et al. performed sensitivity analysis using the Ion PGMTM system, and demonstrated that 90–95% of SNP genotypes could be obtained, even from 25–100 pg of input DNA [15]. Thus, our data suggested that kinship analysis using NGS can achieve such personal identification from degraded materials that are present only in small quantities.
The suitability of the SNPs within HID-Ion AmpliSeqTM Identity Panel, which is a mixture of two distinct panels, similar to the SNP for ID Consortium, has not yet been evaluated NGS genotyping [16]. Additionally, there are several problems with this panel, such as large coverage variance, which may affect the mistyping of heterozygotes. In the present study, eight SNPs were eliminated from the 90 SNPs included in the panel. Similarly, Børsting et al. excluded eight SNPs from analysis of an Iraqi population group, three of which were also excluded in our panel [17]. Only rs1523537 was common in both studies, and the other four excluded SNPs differed. Eduardolf et al. reported excluding 25 SNPs (14.8%) from 165 SNPs in the new version of the HID-Ion AmpliSeqTM Identity Panel; of these 25 SNPs, two (rs727811 and rs1523537) were also excluded SNPs from our study. The reasons for the differences among these studies are not known. The choice of examined SNPs remains an important issue related to genome-wide analyses.
In the HID-Ion AmpliSeqTM Identity Panel, two to seven SNPs are selected for each chromosome. The product rule is applicable when the SNPs are inherited independently. In general, two loci must be distant by over 50 cM as the genetic distance, corresponding to 50 Mb as the physical distance, in order to ensure full recombination and therefore independent inheritance [18]. Although several pairs of these SNPs were closer than this minimum distance, the SNPs were not significantly linked as far as judged by P values, except for rs1821380 and rs1528460. In general, linkage is likely to have only a limited effect on relatedness calculations in short pedigrees [19].
Several methods can be used to infer kinship from SNP data. For instance, a simple degree of pairwise allele sharing under a putative LD value, such as a marker like (pie-hat), serves as a rough estimation of kinship based on data from approximately a half million SNPs from microarrays [20]. Furthermore, the estimation of recent shared ancestry (ERSA) analyzes kinship from the length and number of pairwise shared chromosomal segments [21]. Reportedly, a reliable result is obtainable using this ERSA method. In contrast, LR evaluation has been utilized by forensic researchers for several decades, stemming from the era of blood group typing before DNA analysis was prevalent. In LR evaluation, the estimation power of one divergent STR is equivalent to that of 4–5 bi-allelic SNPs [5,22]. In the early days, paternity results were considered decisive, having greater than 0.998 probability of paternity index, which is known as Hummel’s decision. However, since DNA analysis has become widely used, the threshold has been raised to over 1000 or 10,000 [13,14].
Kinship analyses for the two relationships using a total of 82 SNPs produced a wide range of CLR values. As mentioned earlier, a definitive threshold for CLR has not been established clearly in this study, we tentatively selected the values of 1000 and 10,000. CLR values of less than 1000 and 10,000 were observed respectively in 1.7% and 8.0% of cases in the simulation data for the parent–child relationship. In a comparison of the CLR distribution with those of several STR kits, the estimation power of 82 SNP sites was better than that of the conventional IdentifilerTM system consisting of 15 STR loci [23]. Pinto et al. demonstrated additional simulation data of 100 SNP sites in constant allelic frequencies, of which LR distributions found in their study were consistent with that found in the present study [12].
For the full sibling relationship, results less than 1000 and 10,000 were observed in 2.4% and 8.2% of cases, respectively. The estimation power seemed much better than STR analysis of the 15 markers, in which results of less than 1000 were observed in approximately 30% of cases [23]. The reason for this high analytic power in full siblings remains unknown, but we inferred that sharing of identical genotypes between siblings may occur more often in the bi-allelic markers of SNPs than in divergent STRs.
The 13 STR loci defined by the Federal Bureau of Investigation as the Combined DNA Index System (CODIS) have been used for personal identification internationally for about two decades. An option for the future would be to replace the STRs with more informative SNP markers derived from mass-scale sequencing of NGS. However, this type of change would be complicated by the fact that existing forensic databases are based on STR profiles, and SNP analysis could not easily replace the CODIS [3]. The defaults associated with STR analysis, such as high mutation rates and the presence of the stutter band, are apparent. Moreover, the benefits of SNP analysis using NGS, including the ability to analyze degraded samples present in small quantities and the generation of larger amounts of data related to substitution calls, support the replacement of STRs with SNPs for forensic analyses [24].
Moreover, the result for SNPs on Y-chromosome is not shown in the present report because the evaluative procedure is distinct from that of autosomal SNPs. The Y-haplotype was likely to be helpful for kinship estimation as well.
In conclusion, NGS using the Ion PGMTM system was successfully applied to kinship analysis. Our results provide insights into the utility of NGS systems in forensic analysis. The high sensitivity and fidelity in SNP genotyping will be beneficial for forensic applications. However, further trials and optimization are needed to establish standard operating procedures for forensic laboratories.
Acknowledgements
The authors acknowledge the staffs in the Department of Bioinformatics, Support Center for Medical Research and Education, Tokai University School of Medicine for their technical support.References
- Jobling MA, Gill P (2004) Encoded evidence: DNA in forensic analysis. Nat Rev Genet 5: 739-751.
- Brinkmann B, Klintschar M, Neuhuber F, Hühne J, Rolf B (1998) Mutation rate in human microsatellites: influence of the structure and length of the tandem repeat. Am J Hum Genet 62: 1408-1415.
- Ge J, Eisenberg A, Budowle B (2012) Developing criteria and data to determine best options for expanding the core CODIS loci. Investig Genet 3: 1.
- Nachman MW, Crowell SL (2000) Estimate of the mutation rate per nucleotide in humans. Genetics 156: 297-304.
- Amorim A, Pereira L (2005) Pros and cons in the use of SNPs in forensic kinship investigation: a comparative analysis with STRs. Forensic Sci Int 150: 17-21.
- Bandelt HJ, Salas A (2012) Current next generation sequencing technology may not meet forensic standards. Forensic Sci Int Genet 6: 143-145.
- Berglund EC, Kiialainen A, Syvänen AC (2011) Next-generation sequencing technologies and applications for human genetic history and forensics. Investig Genet 2: 23.
- Tamura T, Osawa M, Kimura R, Inaoka Y, Tanaka S, et al. (2013) Evaluation of the allele-sharing approach, known as the IBS method, in kinship analysis. J Forensic Leg Med 20: 112-116.
- 1000 Genomes Project Consortium, Abecasis GR, Auton A, Brooks LD, DePristo MA, et al. (2012) An integrated map of genetic variation from 1,092 human genomes. Nature 491: 56-65.
- Barrett JC, Fry B, Maller J, Daly MJ (2005) Haploview: analysis and visualization of LD and haplotype maps. Bioinformatics 21: 263-265.
- Sallam A, Martsch R (2015) Association mapping for frost tolerance using multi-parent advanced generation inter-cross (MAGIC) population in faba bean (Viciafaba L.). Genetica 143: 501-514.
- Pinto N, Magalhães M, Conde-Sousa E, Gomes C, Pereira R, et al. (2013) Assessing paternities with inconclusive STR results: The suitability of bi-allelic markers. Forensic Sci Int Genet 7: 16-21.
- Buckleton J (2005) A framework for interpreting evidence. In: Buckleton J, Triggs CM, Walsh SJ (Eds) Forensic DNA evidence interpretation. Boca Raton, CRC Press, pp. 27-63.
- Gjertson DW, Brenner CH, Baur MP, Carracedo A, Guidet F, et al. (2007) ISFG: Recommendations on biostatistics in paternity testing. Forensic Sci Int Genet 1: 223-231.
- Eduardoff M, Santos C, de la Puente M, Gross TE, Fondevila M, et al. (2015) Inter-laboratory evaluation of SNP-based forensic identification by massively parallel sequencing using the Ion PGM™. Forensic Sci Int Genet 17: 110-121.
- Børsting C, Mikkelsen M, Morling N (2012) Kinship analysis with diallelic SNPs - experiences with the SNP for ID multiplex in an ISO17025 accreditated laboratory. Transfus Med Hemother 39: 195-201.
- Børsting C, Fordyce SL, Olofsson J, Mogensen HS, Morling N (2014) Evaluation of the Ion Torrent™ HID SNP 169-plex: A SNP typing assay developed for human identification by second generation sequencing. Forensic Sci Int Genet 12: 144-154.
- Phillips C, Ballard D, Gill P, Court DS, Carracedo A, et al. (2012) The recombination landscape around forensic STRs: Accurate measurement of genetic distances between syntenic STR pairs using HapMap high density SNP data. Forensic Sci Int Genet 6: 354-365.
- Gill P, Phillips C, McGovern C, Bright JA, Buckleton J (2012) An evaluation of potential allelic association between the STRs vWA and D12S391: implications in criminal casework and applications to short pedigrees. Forensic Sci Int Genet 6: 477-486.
- Inaoka Y, Tajima A, Tamura T, Satoh F, Osawa M (2011) Kinship analysis based on SNP data from microarray assay. Forensic Sci Int Genet Suppl Ser 3: e275-e276.
- Huff CD, Witherspoon DJ, Simonson TS, Xing J, Watkins WS, et al. (2011) Maximum-likelihood estimation of recent shared ancestry (ERSA). Genome Res 21: 768-774.
- Gill P (2001) An assessment of the utility of single nucleotide polymorphisms (SNPs) for forensic purposes. Int J Legal Med 114: 204-210.
- Tamura T, Osawa M, Ochiai E, Suzuki T, Nakamura T (2015) Evaluation of advanced multiplex short tandem repeat systems in pairwise kinship analysis. Leg Med (Tokyo) 17: 320-325.
- Phillips C, García-Magariños M, Salas A, Carracedo A, Lareu MV (2012) SNPs as supplements in simple kinship analysis or as core markers in distant pairwise relationship tests: when do SNPs add value or replace well-established and powerful STR tests? Transfus Med Hemother 39: 202-210.