
Journal of Environmental Studies
Download PDF
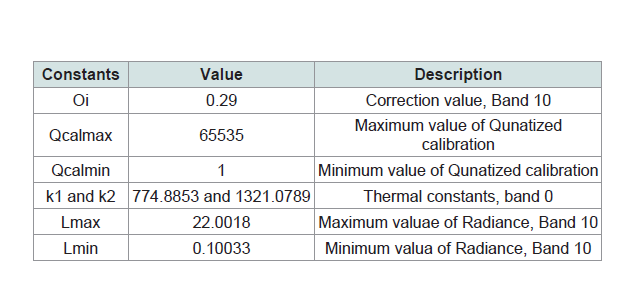 Figure 1: The study area overviewing the aerial view of the Girnar wildlife sanctuary.
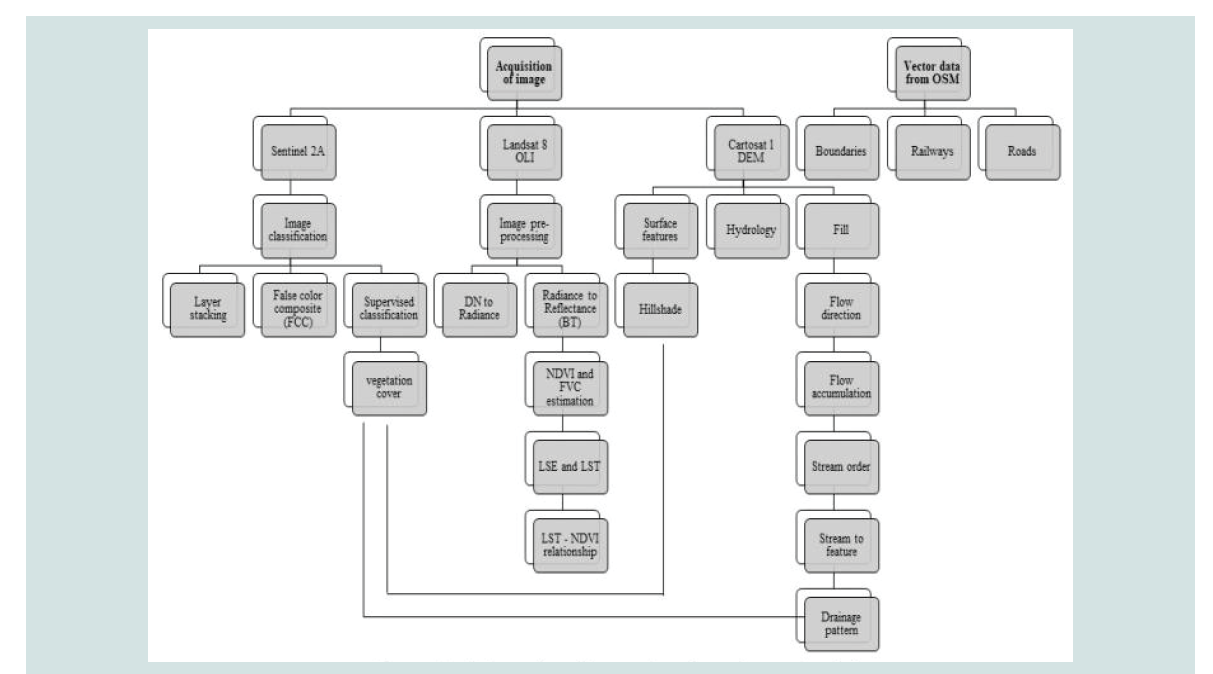 Figure 2: A flow chart illustrating the entire methodology.


 Table 1: The metadata of Landsat 8 OLI consisting required constant values for
calculations.
Table 1: The metadata of Landsat 8 OLI consisting required constant values for
calculations.


 Figure 3: Land Use L and Cover (LULU) Supervised classification based on forest cover..
 Figure 4: The areas covered by dense vegetation in the south western part of the sanctuary, which is situated at higher eleveation with sloppy terrain.
 Figure 5: The pattern of water channels with respect to elevation in the sanctuary.
 Figure 6: LST-NDVI inverse relationship from Landsat 8 OLI data.
Research Article
Assessment of Wildlife Habitats Using Geo-Spatial Techniques; Implications for Long-Term Habitat Management of Girnar Wildlife Sanctuary, Gujarat, India
Aditya D1* and Nishith D2
1Geology Department, M.G. Science Institute, Gujarat University,
India
2Wildlife and Conservation Biology Research Foundation, Patan
(Gujarat), India
*Address for Correspondence: Aditya D, Geology Department, M.G. Science Institute Dadasaheb
Mavlankar Campus, Opp. Gujarat University, Ahmedabad, India; Tel: +918200487460; Email: adiradhu@gmail.com
Submission: 01 August, 2021;
Accepted: 05 September 2021;
Published: 10 September 2021
Copyright: © 2021 Aditya and Nishith. This is an open access article
distributed under the Creative Commons Attribution License, which
permits unrestricted use, distribution, and reproduction in any medium,
provided the original work is properly cited.
Abstract
Wildlife habitats are under significant threat due to rapid
development activities. At present, remote sensing and GIS has been
used widely for modelling, evaluating and monitoring wildlife habitats.
These techniques have proven to be efficient tools for integrating the
spatial and non-spatial data required for monitoring wildlife habitats.
This study focuses on modelling the forest cover, assessing the hydrology
and land surface features of the Girnar wildlife sanctuary using such
geo-spatial techniques. The forest of Girnar is known for Asiatic lions,
birds and its rich floral diversity, in which habitat characteristics and
land surface features are poorly known. The spatial data from various
Earth observation satellites were acquired, interpreted and analysed
using different tools on the GIS platform to derive the hydrology, land
use-land cover and land surface parameters of the sanctuary. Geospatial
maps were prepared showing suitable forest cover, drainage
pattern with respect to elevations, and the land surface temperature
with respect to NDVI. The LST-NDVI plot shows the inverse correlation
between the surface temperature and vegetation indicating the
importance of dense vegetation in the dry deciduous forest. These
deliverables will help policy makers in evaluating suitable habitats
for Asiatic lion and its prey base in Girnar and formulating effective
habitat enhancement and conservation strategies.
Introduction
Although renowned for its rich bio-resources in the present
era, wildlife is vanishing rapidly in India due to growing influence
of humans. The pressure of developmental activities and over
exploitation of resources have been the prime causes for the decline
of wildlife in almost all the countries [1,2]. Declaring National Parks
and reserves are a dominant method for protection and conservation
of remaining wildlife habitats and safeguarding resources like food,
water, forest cover and corridors [3] however, these areas are not
entirely ecological units or functional ecosystems in themselves, thus
have experienced several management problems, like, general decline
in plant and animal diversity leading to poor habitat conditions [4,5].
Wildlife management requires reliable and consistent information
on the abundance, distribution of species and their habitats as well as
threats. Management strategies have focused mainly on single species
and protected areas. The need of developing integrated and advanced
habitat evaluation and management techniques which can help in
formulating long term conservation strategies have been previously
identified [6,7]. These techniques also focuses on the maintenance
of some desired state of the resource base within the reserve, while controlling the factors that negatively impacts habitat quality [8].
The quantification and analysis of current impacts on wildlife habitat
such as logging, agriculture and road development are vital phases
in the process of formulating sound wildlife management policies.
Several ground-based studies and survey techniques such as counting
animals, trapping, scat collection investigation of feeding sites as well
as ground mapping of habitats [9-11] are fruitful.
Traditionally, large carnivore species have served as flagship and
umbrella species for biodiversity conservation, worldwide. In Asia,
lions have been driven almost to extinction, apart the only surviving
free-ranging population of Asiatic lion (Panthera leo persica) is
in and around the Gir forests of Gujarat, India [12]. From 1920 to
present date, the current population has increased from 20 to 674
[13]. However their conservation is bristling with difficulties due to
inhabitation at low densities, requirement of large areas, and often
conflict with human through predation on livestock and sometimes
on people [14,15].
The Girnar hills in Junagadh district of Gujarat, are famous
since ancient times as a place of pilgrimage for both Hindus and
Jains. The town of Junagadh is situated practically at the foothills of
Mount Girnar, the highest peak in Gujarat state of India with the apex
elevation of 1,069m. These hills lie between the parallels of latitude
North 210 25’ and 210 35’ and meridians of longitude East 700 30’ and
700 40’ [16]. The aerial view of the Girnar resembles a circular disc of
the diameter of 16km (Figure 1). Mount Girnar is a major igneous
plutonic complex which intruded into the basalts towards the close
of the Deccan Trap period [17,18]. The climate of Girnar is semi-arid
with a mean temperature and mean annual precipitation of 25.7 0C
and 827mm, respectively along with more than 800 species of plants
and more than 200 faunal species. The Girnar forests is approximately
50km far from the Gir National Park and Wildlife Sanctuary. The area
of 180km2 of Girnar wildlife sanctuary (WLS) is now known as a part
of greater Gir ecosystem constituted for the conservation of Asiatic
lion. Once, the forests of Girnar were contiguous with the Gir forest,
but gradually the urbanization and agricultural expansion have isolated these two forests converting Girnar as an isolated compact patch of forested habitat (Figure 2).
The topographic maps which are similar to any type of land cover
mapping are hitherto being used by wildlife managers for formulating
management plans in the sanctuary [19,20]. However, these ground
surveys are limited, because it is difficult to access the entire area
and the information collected may not be as accurate as is possible
through remote sensing. Hence, it acts as a supplement or partially
replaces these monotonous ground-based surveys. The geospatial
technology such as Remote sensing and Geographical Information
System (RS and GIS) play a key role in such situations and currently
it is one of the quickest possible ways in deriving the environmental
map layers to develop contemporary strategies for wildlife habitat
assessment. This also has been used as a fundamental tool for getting
information about the habitat preferences of wildlife species [21,22]
and helps in monitoring areas of land that are suitable to endangered species, through integration and interpretation of various habitat
variables of both spatial and non-spatial nature [23].
Preparation of habitat management plans is one of the crucial
management practices in the protect areas in India, which generally
are prepared using the ground study and topographic maps. The
intention behind the current study is to assist the forest managers
to map the current vegetation cover of the wildlife habitat in Girnar
Wildlife Sanctuary which serves as critical habitats for the Asiatic lion.
The study also focuses on mapping of existing water channels which
can help in planning the water conservation in the area. Remotely
sensed spatial data of the sanctuary along with the land use layers,
and Digital Elevation Models (DEMs) are also applied, interpreted
and analysed on the GIS platform for habitat classification and water
resource mapping which can be used as a base map for preparing
management plan and formulating future conservation strategies in
the Girnar wildlife sanctuary.
Materials and Methods
Data Sources:
The satellite imagery of Sentinel-2A of the study area was
acquired from Copernicus open access hub developed by the
European Space Agency (ESA) https://scihub.copernicus.eu/
dhus/#/home.The Cartosat-1 Digital Elevation Model (DEM) of
Girnar wildlife sanctuary, was acquired fromIndian Space Research
Organisation (ISRO)’s Geoportal Bhuvan, https://bhuvan-app3.nrsc.
gov.in/data/download/index.php. It is an interactive versatile Earth-
Browser which showcases multi-sensor, multi-platform and multitemporal
images with capabilities to overlay thematic information,
interpreted from such imagery as a vector layer [24]. The acquisition
of Landsat 8 OLI data was done using https://earthexplorer.usgs.gov.
The United States Geological Survey (USGS) Earth Explorer data
portal was used to obtain various earth imagery across available geospatial
datasets [25,26]. Open Street Map (OSM) were also used to
create a free editable map of the World https://www.openstreetmap.
org/#map=15/24.4803/72.7920 & layers=N.In this study, several
landuse layers such as roads, railways, built-ups, etc., were extracted
along with the country and state boundaries of Gujarat and India
from the OSM server and were digitized using ArcGIS tool [27,28].
Data analysis:
Terrain and hydrology: The Digital Elevation Models (DEMs)
are digital records of terrain elevations for ground position at
regularly spaced intervals. The elevation values of terrain are valuable
for modelling the terrain, drainage area, as well as studying the land
use patterns [29]. It was used to compute the elevation range and
to process several hydrological functions. At first, it was taken as
an input raster to process the Fill tool, which resulted a depression
less raster with all the sinks, filled. This output was taken as desired
input raster to process the Flow Direction tool which generates the
pixel value based on the flow path of water from higher elevation to
lower elevation and also assigns a flow eight to each grid cell in the
catchment, such that each grid cell tends to flow only in one of the eight
neighbouring grid cells with the steepest slope [30,31]. It identifies all
the sinks in the DEM and raises their elevation to the lowest level of
pour point around their edge by using the eight directions pour point
model. While running the flow direction algorithm, the resulting
values ranged from 1, 2, 4, 8, 16, 32, 64, and 128 which describes all
the adjacent eight directions at a given point. For processing the Flow
Accumulation tool, the output rasters i.e., Fill and flow direction were
taken as input rasters. Basically, in this sub-step, it calculates the total
number of grid cells contributing to each grid cell in the catchment
and assigns this value to this grid cell as flow accumulation [32,33]. After processing it, an algebraic expression was given to determine
the threshold value while ordering the stream network, where flow
accumulation = > 9500 which calculates all the respective streams and
its branches in the output raster. Based on the above calculation, the
calculated raster and flow direction raster were taken as input rasters
and were processed using the Stream order tool where the ordering
method STRAHLER was used[34]. This function based on the above
user-defined threshold values of accumulation delineates the stream
network for the catchment [35]. Lastly, the above output raster of
stream order was converted into a vector layer by processing the tool,
stream to feature. With this, the drainage pattern or the Streams were
generated. The Hill shade tool along with slope and the aspect tool
[36]was processed on the DEM to analyse surface features of the
study area to correlate with the stream network from the highest to
lowest elevation points.
Land Use Land Cover (LULC): The monitoring of vegetation is
an accepted technique for habitat assessment. The sentinel 2A satellite
consists of 13 bands in the visible, near infrared and short-wave
infrared part of the spectrum which supplies multi-spectral data and a
spatial resolution of 10, 20 and 60 m. Thus, it makes possible to figure
out large amount of minute details of various ground features. In order
to classify the image, the band composite function was processed for
layer stacking to obtain a False Colour Composite (FCC). Maximum
Likelihood Supervised Classification was performed in the Sentinel
imagery and six different classes (i.e., water body, built ups, barren
lands, open forests, moderate vegetation and dense vegetation)
were differentiated based on the spectral signatures of each pixel.
Maximum Likelihood Classification assumes the statistics in each
class in each band are equally distributed and defines a specific class
in which the given pixel value falls, where each pixel is assigned to
the class that has highest probability (i.e., Maximum Likelihood). The
area of each class was interpreted based on pixel count and resolution
of cell. Other Land Use layers like roads, and railways were extracted
from the open-source data repository, Open Street maps (OSM)
which is used as a server and digitised in GIS environment through
Web Mapping Services (WMS). A WMS defines an interface or a
consortium that allows to get maps of geospatial data and can able
to gain detailed information on specific features shown on the map.
WMS can produce a map, as a picture, series of graphical elements
or a set of geographic data. It also can answer basic queries about the
content of the map.
Estimation of Land Surface Temperature (LST): The Landsat
8 OLI data was used to determine the Land Surface Temperature
(LST) of the study area. It consists of two sensors OLI and Thermal
Infrared Sensors (TIRs)in which OLI comprises of 8 bands located
in the visible, near infrared and the short-wave infrared region of the
spectrum which provides the data of 30 m spatial resolution. The TIRs
senses the Thermal Infrared (TIR) radiance at a spatial resolution of
100 m with the help of two bands located in the atmospheric window
between 10 and 12 μm [37]. For pre-processing the imagery, the
first step is to convert the Digital Number (DN) values of band 10 to
spectral radiance using the following equation:
After conversion of DN values to spectral radiance, the data
is further converted to Brightness Temperature (BT) using the
following equation:
Where K1 and K2 are the thermal constants of TIR band, that can
be identified in the metadata file associated with the satellite image.
It is necessary to add absolute zero, which is approx. (–273.15)°C to
obtain the results in Degree Celsius. The required metadata of the
satellite image is shown in Table 1.
In order to calculate the Fractional Vegetation Cover (FVC), the
Normalised Difference Vegetation Index(NDVI) was calculated in
the Landsat imagery which is necessary for further calculations of
emissivity, and proportional vegetation. The NDVI is one of the most
generally used indices for vegetation monitoring[38], as it quantifies
the spatial distribution of vegetation biomass, hence, it is also said
as ‘Greenness Index’ [39,40]. It is calculated as the normalised ratio
between Red and near-infrared band data sensed by Landsat 8 satellite
sensor. For calculating NDVI (Normalised Difference Vegetation
Index), Band 5 and Band 4 which is Near Infrared and Red Band
respectively, were processed.
the output raster resulted in ranges from –1 to +1 which depicts
the characteristic features of pixel values of lower to higher vegetation.
It is calculated as the normalised difference of the spectral reflectance
of near infrared λ NIR (0.85 μm) and Red λ RED (0.67 μm). NDVI values
vary between –1 and +1, and are undefined when both λ NIR and λ RED
are zero [41]. For vegetated areas the values generally range from
approximately 0.1 to 0.7, with values greater than 0.5 indicating dense vegetation and values less than 0.1 indicate no vegetation, e.g., barren area, rock, sand or snow [42].
The FVC is the ratio of the vertical projection area of vegetation
(including leaves, stalks, and branches) on the ground to the total
vegetation area which is calculated as per the formula:
Where, NDVI are the DN values from NDVI image, NDVImin are
minimum DN values, NDVImax are maximum DN values.
Land Surface Emissivity (LSE) helps in reducing the Top of
Atmospheric (TOA) Radiance in comparison with blackbody. It
is defined as the ratio of the radiance emitted by an object to the
radiance it would emit if it were a perfect black body at the same
thermodynamic temperature [43]. It is calculated according to the
formula:
The LST is the radiative skin temperature of the land surface, as
measured in the direction of the remote sensor, which is estimated
from TOA brightness temperatures from the Thermal infrared
spectral channels of geostationary satellites. Its estimation further
depends on the albedo, the vegetation covers and the soil moisture
[44].The vegetation and barren soil temperature, respond rapidly to
the incoming solar radiation changes due to cloud cover, thus it is said
as a mixture of both these parameters. The equation for calculating
the Land Surface Temperature (ε) followed by Surface emissivity is
as follows:
Where, BT is the Brightness Temperature and ε is the Surface
Emissivity and Hence, by formulating these equations step-wise in
the raster calculator, the LST of the study area was derived. Figure
3 shows a diagrammatic representation of the entire methodology.
Results and Discussions
Vegetation cover:
The Land use Land Cover (LULC) classification shows a great
significance in detecting regions that are covered by different type of
vegetation and the land use in a particular area. Thus, LULC maps
are the best source of information to the managers for understanding
the landscape of any particular region. (Figure 3), shows the LULC
classification of the study area which comprises of 0.08% (0.19
sq.km) of Water body, 2 % (5.67 sq.km) of Built-up areas which are
mostly the old temples and hermitage. However, there is no any new
other development or built-up structure was recorded in the area.
Further, the habitat of Girnar forest was classifiedas the forest area
with moderate vegetation 35 % (117.89 sq.km), dense vegetation 8 %
(26.1 sq.km), along with 26 % (88.15 sq.km) Grasslands, 30 % (101.78
sq.km) Shrublands and 1 % (1.76 sq.km) of Barren lands. Figure
4, depicts the forest areas with dense vegetation in the South-west
direction with a high elevation and a slopy terrain, can be a suitable
wildlife habitat. Generally, lions are considered as best example
in predator-prey relationships as they usually hunt in groups and
also pondered ambush predators, choosing prey catchability over prey abundance and rely on concealment during hunting [45,46].
Therefore, dense vegetation enables the predators like lion and
leopard to ambush their prey and also provides cover [47]. Thus, the
areas in North-east, North-west and South-east needs to be afforested
more to have a denser vegetation.
Hydrology:
Water is said to be a most important driving factor in wildlife
habitat and also acts as a source of life for all the animals. Figure 5 depicts five streams or water channels flowing from an elevation range of ~ 100 to 300m and also two of the five streams form the
junctions at the reservoir at an elevation of 66 and 79m. Alongside,
the majority of the dense forests is observed in these elevation range
constituting a suitable wildlife habitat (Figure 4). Figure 5 depicts that
all the streams in Girnar forest are of first order stream according
to STRAHLER Order stream classifications, and are considered as
primary or minor streams. These water channels flow and make their
path in almost every direction from the origin point. As these are of first order streams, there is very less chance of getting calculating
water catchment areas and the amount of water carried by each
stream. Unlike the Girnar wildlife sanctuary, the other sanctuaries
of Gujarat, like Jessore [48] and Ratanmahal, several junctions
of streams were identified on the basis of STRAHLER order that
provides an opportunity to wildlife manager to create the natural
water catchment areas or check dams. The study reveals that, artificial
water points such as wildlife guzzlers, artificial ponds, etc. need to be
prepared in the barren areas of the sanctuary such as the Northeast
and Eastern part as well as the origin points of all the five streams as
depicted in(Figure 5). These can aid in soil and moisture conservation
as well as act as sources of water for the wild animals.
Land Surface Temperature:
A habitat quality is often driven by the land surface temperature
and (LST) influenced by the extent of vegetation and surface
roughness. LST also helps in depriving various soil characteristics.
Both NDVI and LST can act as indicators of drought as well [49]. In
this study, the relationship between LST and NDVI is shown in the
form of scatter plot using Landsat 8 datasets (Figure 6). The LST in
the sanctuary has been ranged from 20°C to 90°C and the scatter plot
depicts a negative or inverse relationship between LST and NDVI.
With increasing NDVI, say denser vegetation, the LST gradually
decreases which indicates that dense vegetation in the southwest of
the Girnar sanctuary induces more evapotranspiration and cools the surface [50,51]. This plot also suggests that decrease in LST with
increase in NDVI should not be interpreted as a sign of vegetation
stress and hence LST could be a great determining factor to help in
improving and understanding the water availability, to aid resource
management and improve weather forecasts [52-54].
Conclusion
Remote sensing and geospatial analysis techniques may prove
as effective and advanced tools to conserve the natural resources
such as forests and water. In the present study, the forest habitat
of Girnar hills and the water channel along with the Land Surface
Temperature therein were analysed and mapped to understand
the habitat availability for the Asiatic lion and its prey species. The
outcomes thus, can be utilized for further assessment, evaluation
and monitoring of this habitat for the conservation of Asiatic lion
and its associated fauna. Alongside, the inverse relationship of LSTNDVI
will might come handy in determining future environmental
planning to maintain the vegetation density in the sanctuary. The
water channels assessed might help the forest department to manage
the water resources during the dry season through water conservation
structures. The ability of GIS to capture, store and manage every
type of datasets has proved that the outcomes deprived are selfunderstandable
and self-explanatory to the laymen and persons who
are unfamiliar with these emerging techniques. At a long term, the
advancement in habitat management using geo-spatial technology
will help forest managers, to formulate future conservation and
management strategies.
Declaration of Competing Interests
The authors declare that they have no known competing financial
interests or personal relationships that could have appeared to
influence the work reported in this paper
Acknowledgements
We sincerely acknowledge Dr. C.P. Singh, Scientist, Space
Application ISRO, Ahmedabad Dr. Alpana Shukla, HOD, Botany
Department, M.G. Science Institute, Ahmedabad, for critical review
and encouragement. We also thank WCB Research Foundation and
M.G. Science Institute, Ahmedabad, for the necessary facilities and
the software.
References
Citation
Aditya D, Nishith D. Assessment of Wildlife Habitats Using Geo-Spatial Techniques; Implications for Long-Term Habitat Management of Girnar Wildlife Sanctuary, Gujarat, India. J Environ Stud. 2021;7(1): 8